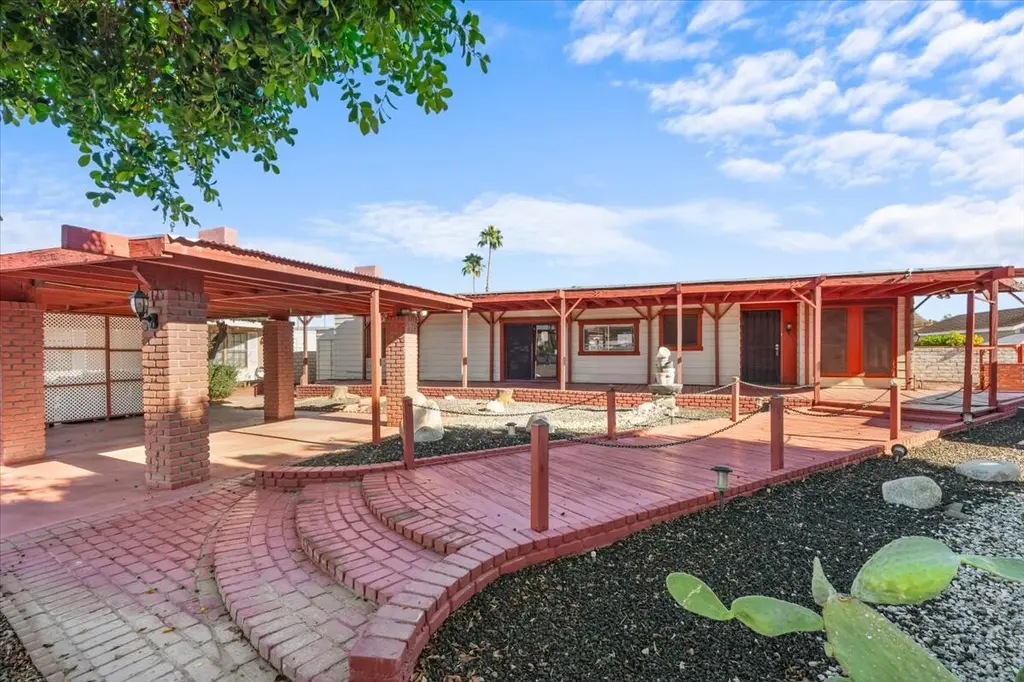
73920 Line Canyon Ln · Palm Desert, CA
Flood risk 1/10 · Minimal
- FEMA flood zone
- X (unshaded)
- Chance of flooding over 30 yrs
- 0.0%
- Est. flood insurance / yr
- $507 – $1,088
Fire risk 1/10 · Minimal
- Est. fire insurance / yr
- $659 – $1,223
Heat risk 9/10 · Severe
- Hot days now (above 114°F)
- 7 days/yr
- Hot days in 30 yrs
- 19 days/yr
Wind risk 1/10 · Minimal
- Chance of severe wind over 30 yrs
- —
Air-quality risk 4/10 · Minor
- Unhealthy air days now
- 5 days/yr
- Unhealthy air days in 30 yrs
- 7 days/yr
Risk factors via First Street. Map © Google.
Why this score? — see what drove the B+ grade
The composite is a weighted blend of 9 inputs, each scored 0–100. Each bar is that input's sub-score; the figure is the points it added to the 100-point composite (weight × sub-score).
- Cash flow +30.0/30.0
- ARV discount +15.0/15.0
- 1% rule +10.0/10.0
- DSCR +10.0/10.0
- Schools +3.8/10.0
- Rent growth +2.9/5.0
- Livability +2.6/5.0
- Condition / age +2.5/5.0
- Appreciation +0.0/10.0
$185,000
🖨 Deal sheet (PDF) 📄 Offer letter ✓ Due diligence
Listing remarks
HUD-owned opportunity in Palm Desert Greens Country Club, a 55+ community. This 2-bedroom, 2-bath home offers strong upside potential for investors, flippers, or buyers seeking a value-add property in a high-demand desert community. Features include a spacious living room with fireplace, dining area with built-in hutch, large family room, laminate flooring, plantation shutters, ceiling fans, and a private hot tub under a gazebo. The functional floor plan provides an excellent foundation for cosmetic updates and personalization. HOA amenities include golf, pools, spas, tennis courts, fitness center, clubhouse, and cable TV. Conveniently located near shopping, dining, and entertainment. Prope
Key facts
- 5,663 sq ft lot
- Garage
- Built 1976
Neighborhood map
What this means for you Summary
Snapshot
- This is a 2-bed/2.0-bath manufactured listed at $185k.
Deal economics
- At list price, monthly cash flow is $1k ($17k/yr) — positive.
- The deal already cash-flows at list — no discount required.
- Meets the 1% rule at list price ($4k rent vs $185k).
- Cap rate 15.7% vs local median 3.5% in Palm Desert — top-decile yield for the area; either an underpriced asset or a hidden risk that comps aren't pricing in. Stress-test before assuming the spread holds.
Location & tenants
- Location reads 51/100 on livability (#1,050 in CA) — a working-class tenant base; expect higher turnover. Strengths: schools A-, employment B+, housing B; Watch: crime D, amenities F, commute F.
- Desert Sands Unified (suburban): math 31% / reading 56% proficiency, ranked #199 of 517 in CA (top 38%) — families likely to look elsewhere, expect single-tenant / working-renter base with shorter leases.
- Market conditions: Rents rising (+1.6%/yr); 545 active listings in the ZIP; 40 comparable units currently listed for rent nearby; rentals lingering (median 44d on market — plan ~5-8 weeks vacancy on turnover, expect pricing pressure); 72% of comp listings sitting > 30 days — soft ceiling on asking rent; 9,195 units permitted in Riverside County in 2024 (1,512 in 5+ unit buildings).
- At $3,956/mo this rent would consume 68% of the median local household income ($70k/yr) (locally 1734% of renters already pay >50% of income on rent) — very limited rent-growth headroom before tenants either downsize or default.
Forward outlook
- Local home prices are declining (-3.0%/yr); year-one equity from $1k of loan paydown is wiped out by about $6k of value loss. Plan a longer hold.
- Riverside County population projected at +22% by 2050 — long-run rental-demand tailwind backs the buy-and-hold thesis.
- At projected returns (-3.0% appreciation + 1.6% rent growth), your $52k cash investment doubles in ~4 years — after that, you're playing with house money.
Negotiation context
- Only 1 days on market — expect competitive offers; lowballing is unlikely to land.
- 7 sale attempts since 20y ago with the ask held roughly flat each time — persistent listings suggest the price (not the market) is what's stuck; bring a comps-based counter.
- Current owner paid $130k; 43% above their basis — modest negotiation headroom, anchor on the comps not their cost.
Risks & watch-outs
- Climate carrying-cost: extreme-heat days projected 7→19/yr by 2055 (HVAC capex compounding) — expect insurance premiums to compound above CPI over the hold.
Questions for the listing agent
- Built in 1976 — when were the roof, HVAC, electrical panel, plumbing, and water heater last replaced?
- What does the HOA fee cover, when was the last increase, and are there any pending special assessments or reserve-fund shortfalls?
- Is there a deadline driving the sale (1031 exchange, divorce, estate, relocation)? That informs how much negotiation room exists.
- Schools are A-rated — typically a magnet for longer-tenancy family renters. What's the average tenant stay here, and is there a school-zone premium baked into asking?
- Crime grade is D in this area — have there been break-ins, vandalism, or insurance claims at this property in the last 3 years? What carrier currently insures it and at what premium?
- What's the average days-on-market for RENTAL listings here right now (not sales)? A rising rental-DOM trend means longer vacancies and softer asking-rent achievability than the comps imply.
- What's the recent tenant-quality profile in this submarket — average credit score on applications, eviction rate, late-payment / NSF rate, and stable-employment percentage? A property-management company in the area should have these aggregated.
- How much new for-sale + rental construction is in the pipeline within 1–3 miles? Heavy new supply typically softens prices + rents 12–24 months out; constrained supply supports both.
Investment metrics
- 1% rule
- 2.14% ✓
- Cap rate
- 15.72%
- Cash-on-cash
- 33.69%
- DSCR
- 2.50
- GRM
- 3.9
CMA / ARV
- ARV (on-the-fly)
- $259,200
- Comps found
- 12
Show comp detail 12 sales within ~0.75 mi
| Address | Dist | Beds/Ba | Sqft | Sold | Price | $/sf | Match |
|---|---|---|---|---|---|---|---|
| 39183 Warm Springs Dr | 0.33mi | 2/2.0 | 1,440 (0%) | 0mo | $200,000 | $139 | 84 |
| 39832 Black Mesa Ln | 0.39mi | 2/2.0 | 1,440 (0%) | 1mo | $260,000 | $181 | 82 |
| 38430 Desert Greens Dr E | 0.39mi | 2/2.0 | 1,440 (0%) | 3mo | $325,000 | $226 | 79 |
| 73651 Adobe Dr | 0.47mi | 2/2.0 | 1,488 (+3%) | 1mo | $199,000 | $134 | 72 |
| 73450 Country Club Dr #75 | 0.62mi | 2/2.0 | 1,440 (0%) | 3mo | $190,000 | $132 | 69 |
| 38703 Desert Greens Dr E | 0.29mi | 2/2.0 | 1,248 (-13%) | 0mo | $322,000 | $258 | 64 |
| 73204 Cold Springs Way | 0.72mi | 2/2.0 | 1,414 (-2%) | 3mo | $375,000 | $265 | 61 |
| 73370 Indian Creek Way | 0.71mi | 2/2.0 | 1,392 (-3%) | 4mo | $250,000 | $180 | 58 |
| 73450 Country Club Dr #26 | 0.64mi | 2/2.0 | 1,344 (-7%) | 3mo | $217,500 | $162 | 56 |
| 73450 Country Club Dr #309 | 0.64mi | 3/2.0 (+1) | 1,344 (-7%) | 2mo | $165,000 | $123 | 52 |
| 38668 Fawn Springs Dr | 0.50mi | 3/2.5 (+1) | 1,600 (+11%) | 0mo | $410,000 | $256 | 51 |
| 73450 Country Club Dr #87 | 0.64mi | 3/2.0 (+1) | 1,636 (+14%) | 1mo | $222,500 | $136 | 41 |
Match score weights: distance 35% · size 25% · config 20% · recency 20%. Top-matched comps best support the ARV.
Projected returns pro-forma
-3.0% appreciation · 1.6% rent growth · sell at horizon
- IRR
- 27.2%
- Equity multiple
- 2.11×
- Total profit
- $57,437
- Equity at exit
- $27,584
- IRR
- 33.9%
- Equity multiple
- 3.87×
- Total profit
- $148,562
- Equity at exit
- $15,995
Cash invested: $51,800 (down + closing). Projections, not guarantees.
Landlord ↔ Tenant lean methodology
- Overall (STATE)
- 18 Strongly Tenant-Friendly
- State California
- 18 Strongly Tenant-Friendly · D+13
- County
- — inherits STATE
- City
- — inherits STATE
ZIP-level market 92260
- Rents YoY
- 1.6%
- Active inventory
- 545
- Price-to-rent
- 3.9×
Monthly cashflow live
- Estimated rent
- $3,956 high interval (Pro) →
- Mortgage (P&I)
- −$970
- Tax from tax record
- −$224 /mo · $2,690/yr
- Insurance
- −$77
- HOA
- −$400
- Vacancy / Maint / Mgmt
- −$831
- Net cashflow
- $1,454
Break-even live
Sensitivity live
| Price | -10% $1,559 | -5% $1,506 | +0% $1,454 | +5% $1,402 | +10% $1,349 |
|---|---|---|---|---|---|
| Rent | -10% $1,142 | -5% $1,298 | +0% $1,454 | +5% $1,610 | +10% $1,767 |
| Rate | -1.0pp $1,547 | -0.5pp $1,501 | base $1,454 | +0.5pp $1,406 | +1.0pp $1,357 |
UW: 25.0% down · 7.5% · 30yr · 1.5% tax · 5.0% vac · 8.0% maint · 8.0% mgmt
Financing live
Cash to close
- Down payment
- $46,250
- Closing costs
- $5,550
- Reserves months
- —
- Total cash needed
- —
Loan-product check · same deal, 3 products live
Conventional
25% down · 7.5% · 30yr
- Down + closing
- —
- Monthly P&I
- —
- Monthly cashflow
- —
- DSCR
- —
- Eligible?
- —
Personal DTI + credit; lowest rate.
DSCR
20% down · 8.5% · 30yr
- Down + closing
- —
- Monthly P&I
- —
- Monthly cashflow
- —
- DSCR
- —
- Eligible?
- —
No personal income docs; deal must DSCR.
Hard money
10% down · 12.0% · 12mo
- Down + closing
- —
- Monthly P&I
- —
- Monthly cashflow
- —
- DSCR
- —
- Eligible?
- —
Short-term bridge; refi at stabilization.
Rent comps 40 comps
| Address | Beds | Baths | Sqft | Rent | $/sqft | DOM | Units | Dist |
|---|---|---|---|---|---|---|---|---|
| 73843 Line Canyon Ln Palm Desert, CA | 2.0 | 2.0 | 1570 | $2,100 | $1.34 | 12d | 1 | 0.07mi |
| 73639 Cabazon Peak Dr Palm Desert, CA | 2.0 | 2.0 | 1717 | $2,400 | $1.40 | 44d | 1 | 0.47mi |
| 74300 Country Club Dr Apt 5001 Palm Desert, CA | 2.0 | 2.0 | 1099 | $7,120 | $6.48 | 44d | 1 | 0.49mi |
| 74300 Country Club Dr Unit 366 Palm Desert, CA | 2.0 | 2.0 | 1140 | $7,170 | $6.29 | 44d | 1 | 0.49mi |
| 2701 Via Calderia Palm Desert, CA | 2.0 | 2.0 | 1559 | $2,850 | $1.83 | 25d | 1 | 0.50mi |
| 8 Las Cruces Ln Palm Desert, CA | 2.0 | 2.0 | 1705 | $5,000 | $2.93 | 44d | 1 | 0.53mi |
| 1803 Via San Martino Palm Desert, CA | 2.0 | 2.0 | 1559 | $3,900 | $2.50 | 44d | 1 | 0.54mi |
| 4 Hermosillo Ln Palm Desert, CA | 2.0 | 2.0 | 1572 | $2,900 | $1.84 | 19d | 1 | 0.56mi |
| 38520 Poppet Canyon Dr Palm Desert, CA | 2.0 | 2.0 | 1392 | $3,700 | $2.66 | 44d | 1 | 0.61mi |
| 40445 Portola Ave Palm Desert, CA | 1.0–2.0 | 1.0–2.0 | 975 | $3,215 | $3.30 | 0d | 16 | 0.61mi |
| 73450 Country Club Dr #120 Palm Desert, CA | 2.0 | 2.0 | 1856 | $2,995 | $1.61 | 12d | 1 | 0.64mi |
| 38250 Azalea Dr Palm Desert, CA | 2.0 | 2.0 | 1806 | $5,500 | $3.05 | 44d | 1 | 0.65mi |
| 73750 Calle Bisque Palm Desert, CA | 3.0 | 2.0 | 1537 | $6,500 | $4.23 | 44d | 1 | 0.70mi |
| 4162 Via Mattina Palm Desert, CA | 2.0 | 2.0 | 1867 | $2,950 | $1.58 | 13d | 1 | 0.70mi |
| 1 Marbella Ln Palm Desert, CA | 2.0 | 2.0 | 1080 | $4,500 | $4.17 | 44d | 1 | 0.71mi |
| 37772 Hollister Dr Palm Desert, CA | 3.0 | 2.0 | 1271 | $3,200 | $2.52 | 44d | 1 | 0.72mi |
| 41517 Armanac Ct Palm Desert, CA | 3.0 | 2.0 | 1537 | $3,400 | $2.21 | 3d | 1 | 0.73mi |
| 73373 Country Club Dr Palm Desert, CA | 1.0–2.0 | 1.0–2.0 | 852 | $2,165 | $2.54 | 44d | 1 | 0.75mi |
| 191 Winterhaven Cir Palm Desert, CA | 2.0 | 1.5 | 1250 | $2,800 | $2.24 | 44d | 1 | 0.82mi |
| 248 Strada Fortuna Palm Desert, CA | 2.0 | 2.0 | 1400 | $2,500 | $1.79 | 44d | 1 | 0.84mi |
| 166 Wimbledon Ct Palm Desert, CA | 2.0 | 2.0 | 1250 | $3,200 | $2.56 | 44d | 1 | 0.86mi |
| 40064 Silktree Ct Palm Desert, CA | 3.0 | 2.0 | 1712 | $3,200 | $1.87 | 25d | 1 | 0.86mi |
| 73075 Buck Springs Dr Palm Desert, CA | 2.0 | 2.0 | 1440 | $1,950 | $1.35 | 44d | 1 | 0.86mi |
| 150 Willow Lake Dr Palm Desert, CA | 2.0 | 2.0 | 1138 | $2,500 | $2.20 | 44d | 1 | 0.95mi |
| 323 San Remo St Palm Desert, CA | 2.0 | 2.0 | 1556 | $8,500 | $5.46 | 44d | 1 | 0.99mi |
| 40255 Sagewood Dr Palm Desert, CA | 3.0 | 2.0 | 1712 | $3,300 | $1.93 | 19d | 1 | 0.99mi |
| 206 Lakecrest Ln Palm Desert, CA | 2.0 | 2.0 | 1138 | $2,300 | $2.02 | 12d | 1 | 1.00mi |
| 363 San Remo St Palm Desert, CA | 2.0 | 2.0 | 1656 | $7,500 | $4.53 | 44d | 1 | 1.03mi |
| 365 San Remo St Palm Desert, CA | 2.0 | 2.0 | 1303 | $5,500 | $4.22 | 44d | 1 | 1.04mi |
| 336 Villena Way Palm Desert, CA | 2.0 | 2.0 | 1303 | $5,500 | $4.22 | 44d | 1 | 1.05mi |
| 255 San Remo St Palm Desert, CA | 2.0 | 2.0 | 1656 | $6,600 | $3.99 | 44d | 1 | 1.07mi |
| 337 Villena Way Palm Desert, CA | 2.0 | 2.0 | 1303 | $5,000 | $3.84 | 44d | 1 | 1.09mi |
| 311 Villena Way Palm Desert, CA | 2.0 | 2.0 | 1653 | $7,000 | $4.23 | 25d | 1 | 1.11mi |
| 726 Vista Lago Dr N Palm Desert, CA | 3.0 | 2.5 | 1814 | $4,900 | $2.70 | 44d | 1 | 1.12mi |
| 430 S Sierra Madre Palm Desert, CA | 2.0 | 2.0 | 1303 | $5,500 | $4.22 | 44d | 1 | 1.15mi |
| 217 Las Lomas Palm Desert, CA | 2.0 | 2.0 | 1656 | $6,300 | $3.80 | 44d | 1 | 1.15mi |
| 432 S Sierra Madre Palm Desert, CA | 2.0 | 2.0 | 1584 | $5,300 | $3.35 | 44d | 1 | 1.15mi |
| 778 Montana Vista Dr Palm Desert, CA | 3.0 | 2.5 | 1814 | $6,500 | $3.58 | 44d | 1 | 1.16mi |
| 305 Durango Palm Desert, CA | 2.0 | 2.0 | 1670 | $6,300 | $3.77 | 44d | 1 | 1.17mi |
| 352 S Sierra Madre Palm Desert, CA | 2.0 | 2.0 | 1584 | $5,800 | $3.66 | 44d | 1 | 1.17mi |
HOA detail
- Monthly dues
- $400 · $4,800/yr
- Likely covers
- cablepoolgym
Listing history 20 events
-
2026-05-17historical
-
2026-02-17historical
-
2026-02-17status Pending
-
2026-02-06status Active
-
2026-01-05status Pending
-
2025-12-18$185,000
-
2025-12-18$185,500 Active
-
2025-10-16soldstatus $129,570
-
2011-01-19historical
-
2010-10-11price $210,000
-
2010-09-26$199,950 Active
-
2008-11-24soldstatus $115,850
-
2008-10-09historical
-
2008-10-03$122,000
-
2008-09-12historical
-
2008-02-22$111,600
-
2007-05-04historical
-
2006-01-04$225,000
-
1992-03-20soldstatus $60,000
-
1990-01-08soldstatus $40,000
ⓘ Source: listings_history table (triggers on properties + properties_extension) + one-shot
backfill from property_details.listing_events for pre-trigger history.
Tax reassessment forecast CA · Resets to sale price
- Current annual tax
- $2,690 · $224/mo
- Projected year-2 tax
- $2,690 · $224/mo
- Expected delta
- $0/yr ($0/mo · 0.0%)
ⓘ Screening estimate from a state-policy table — verify with the county assessor before closing.
Climate risk First Street
- Flood 1/10 Low FEMA zone X (unshaded) · 0% chance over 30 yrs
- Wildfire 1/10 Low
- Heat 9/10 Extreme 7 d/yr ≥114°F today · 19 d/yr by 30 yrs out
- Wind 1/10 Low
- Air quality 4/10 Moderate 5 unhealthy d/yr today · 7 by 30 yrs out
Nearby sold comps map
Loading sold comps map…
Walkable amenities ~0.75 mi
Loading nearby amenities…
Taxation est. · year 1
- Rental income
- $47,475
- − Mortgage interest
- −$10,363
- − Property taxes
- −$2,690
- − Insurance
- −$925
- − Repairs & maintenance
- −$3,798
- − Management
- −$3,798
- − HOA
- −$4,800
- − Depreciation
- −$5,382
- Taxable income
- $15,720
- Est. tax owed @ 24.0%
- −$3,773
- After-tax cash flow
- $13,676/yr
For passive investors: Depreciation is non-cash, so a rental often shows a tax loss while cash-flowing — sheltering income. Rental losses are passive: they offset passive income freely, and up to $25,000/yr can offset ordinary (W-2) income if you actively participate and your MAGI is under $100k (phasing out to $0 by $150k); unused losses carry forward. On sale, claimed depreciation is recaptured at up to 25%, and gains may owe capital-gains tax (a 1031 exchange can defer both). Figures are a year-1 estimate at your 24.0% rate — not tax advice; consult a CPA.
Schools (NCES district)
- District
- Desert Sands Unified
- NCES district ID
- 0611110
- Math proficiency
- 31% ▼ -4.00%
- Reading proficiency
- 56% ▲ 7.00%
- Median HH income
- $54,957
- Composite
- 37.77/100
- National rank
- #4346
- State rank
- #199 of 517 in CA
Livability — Palm Desert
- Score
- 51/100
- State rank
- #1050
- US rank
- #25164
Category grades
Schools grade is shown separately in the Schools card above.
Census & demographics
- Census place
- Palm Desert, CA
- County
- Riverside County · 2,287,001 people
- City population
- 58,615
- Metro
- Riverside-San Bernardino-Ontario, CA
- Population (ZIP)
- 30,523
- Household income
- $70,091
- Rent vs Own
- Severe rent burden
- 1734.0
Population outlook (Riverside County) Hauer SSP2
- Today (2025)
- 2,664,475 people
- By 2030
- 2,802,692 · +5.2%
- By 2040
- 3,050,904 · +14.5%
- By 2050
- 3,256,783 · +22.2%
- By 2075
- 3,655,058 · +37.2%
- By 2100
- 3,766,594 · +41.4%
Race, ethnicity, and origin ACS 2023
- Neighborhood character
- Majority White (61%)
- Race & ethnicity
- White 61% Hispanic / Latino 31% Two or more races 20% Asian 4% Black 2%
- Hispanic origin (detail)
- Mexican 25%
- Common ancestry
- Italian 4% Lithuanian 3% Slovak 2%
- Foreign-born
- 18% · Canada, South Korea, Vietnam
- Languages at home
- 73% English-only · Spanish 22% French/Haitian/Cajun 1% Other Indo-European 1%
Political lean MEDSL · Riverside
- 2024 margin
- Toss-up / Even · D 48.0% · R 49.3% · Other 2.6%
- 2008→2024 swing
- -3.6pp toward R · 2008: 2.3pp · 2024: -1.3pp
- All cycles
- 2024: R+1.3 2020: D+8.0 2016: D+4.3 2012: R+0.4 2008: D+2.3
Not yet ingested
- Civics
- —
Market trends
- HPI YoY
- ▼ -364.94%
- Current HPI
- 294.9425
- Rent YoY
- ▲ 1.60%
- Metro
- Riverside-San Bernardino-Ontario, CA
- State GDP YoY
- ▲ 3.21%
- F500 in state
- 116
Industry mix (Fortune 500 HQ in CA)
| Industry | F500 HQs | Revenue |
|---|---|---|
| Technology | 27 | $1,492B |
|
||
| Financial Services | 3 | $174B |
|
||
| Retail | 3 | $44B |
|
||
| Insurance | 3 | $26B |
|
||
| Media / Entertainment | 2 | $115B |
|
||
| Pharmaceuticals / Biotech | 2 | $62B |
|
||
Price history
+363.8% since first listed20 events — show timeline
- 2026-05-17 Listing Removed — GPSMLS
- 2026-02-17 Listing Removed — GPSMLS
- 2026-02-17 Pending — GPSMLS
- 2026-02-06 Relisted — GPSMLS
- 2026-01-05 Pending — GPSMLS
- 2025-12-18 Listed $185,500 GPSMLS
- 2025-12-18 Listed $185,000 GPSMLS
- 2025-10-16 Sold (Public Records) $129,570 Public Records
- 2011-01-19 Listing Removed — GPSMLS
- 2010-10-11 Price Changed $210,000 GPSMLS
- 2010-09-26 Listed $199,950 GPSMLS
- 2008-11-24 Sold (MLS) $115,850 CRMLS
- 2008-10-09 Listing Removed — CRMLS
- 2008-10-03 Listed $122,000 CRMLS
- 2008-09-12 Listing Removed — CRMLS
- 2008-02-22 Listed $111,600 CRMLS
- 2007-05-04 Listing Removed — GPSMLS
- 2006-01-04 Listed $225,000 GPSMLS
- 1992-03-20 Sold (Public Records) $60,000 Public Records
- 1990-01-08 Sold (Public Records) $40,000 Public Records
Property tax history
+4.7%/yrLatest (2025): $2,690 · -8.7% YoY. Source: county tax records.
Cash-flow waterfall
monthlySold comps — $/sqft
last 12 mo · ≤1 miLoading sold comps…