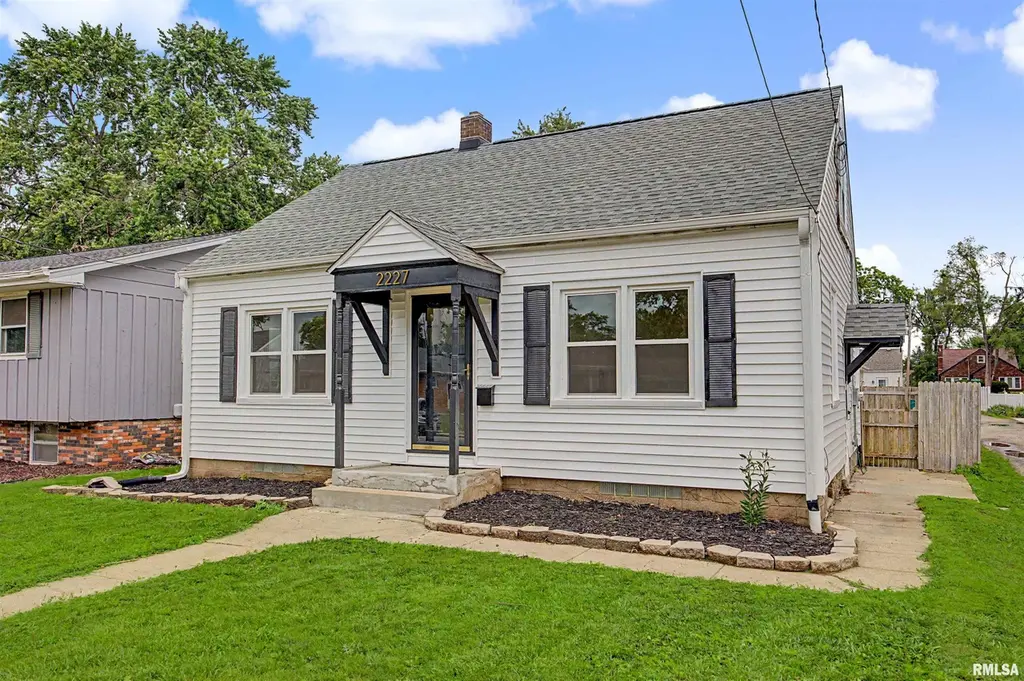
2227 W Callender Ave · West Peoria, IL
Flood risk 1/10 · Minimal
- FEMA flood zone
- X
- Chance of flooding over 30 yrs
- 0.0%
- Est. flood insurance / yr
- $473 – $860
Fire risk 1/10 · Minimal
- Est. fire insurance / yr
- $804 – $1,492
Heat risk 3/10 · Minor
- Hot days now (above 105°F)
- 7 days/yr
- Hot days in 30 yrs
- 18 days/yr
Wind risk 2/10 · Minimal
- Chance of severe wind over 30 yrs
- 1.0%
Air-quality risk 3/10 · Minor
- Unhealthy air days now
- 1 days/yr
- Unhealthy air days in 30 yrs
- 3 days/yr
Risk factors via First Street. Map © Google.
Why this score? — see what drove the F grade
The composite is a weighted blend of 9 inputs, each scored 0–100. Each bar is that input's sub-score; the figure is the points it added to the 100-point composite (weight × sub-score).
- Cash flow +9.7/30.0
- Livability +3.8/5.0
- 1% rule +3.2/10.0
- Rent growth +3.1/5.0
- DSCR +2.7/10.0
- Condition / age +2.5/5.0
- Schools +1.1/10.0
- ARV discount +0.0/15.0
- Appreciation +0.0/10.0
$144,900
🖨 Deal sheet 📄 Offer letter ✓ Due diligence
Listing remarks
Move right in to this fully updated 3 bedroom, 1.5 story home! The main floor features beautifully refinished hardwood floors in the living room and bedrooms. Main floor bathroom is updated with tiled tub/bath and modern finishes. Eat in kitchen with charming grey cabinets and stainless steel appliances. Spacious 3rd bedroom is upstairs. The basement offers more flexible finished space to use as a family room/rec room as well as unfinished space for storage. Step outside to a private, fenced-in backyard with patio that's perfect for summer entertaining. New vinyl siding, gutters, main floor windows 2026. New roof 2019. Schedule your tour of this turnkey gem today!
Key facts
- Eat in kitchen
- New vinyl siding
- Updated bathroom
Tags
Property features AI
Finance
- Other: Living area reported as 1,534; Building area reported as 1,215; Lot dimensions approximately 43 x 127; Corner lot in the Bestor subdivision
Exterior
- Parking: Detached 2-car garage; On-street parking available
- Utilities: Public water; Public sewer
- Home design: Single family residence; Not new construction; Shingle roof; Built in 1948
- Construction: Full basement (partially finished); Established construction (1948)
- Exterior features: Fenced yard; Replacement windows; Corner, level lot; Paved road access
Interior
- Kitchen: Refrigerator included
- Bedrooms: 3 bedrooms (bedrooms located on main, upper and upper levels as noted)
- Flooring: Hardwood flooring in several rooms; Tile flooring in one upper bedroom; Vinyl flooring in kitchen; Other flooring in basement family room
- Bathrooms: 2 full bathrooms
- Heating & cooling: Forced air heating; Central air conditioning
- Interior features: Attic storage; Ceiling fans
- Laundry & utility: Laundry room in basement; Gas water heater
Neighborhood map
What this means for you Summary
Snapshot
- This is a 3-bed/2.0-bath single-family listed at $145k.
Deal economics
- At list price, monthly cash flow is $-95 ($-1k/yr) — negative.
- To cash-flow at today's rent, offer at most $128k (11.6% below list).
- To meet the 1% rule (rent ≥ 1% of price), the offer needs to be $119k (17.9% below list).
- Recommended offer: $119k (17.9% below list) — sets the bar for 1% rule.
Location & tenants
- Location reads 76/100 on livability (#181 in IL, #3,474 nationally) — a middle-class / working-renter tenant base. Strengths: cost of living A+, housing A+, commute A-; Watch: amenities F.
- Peoria SD 150 (urban): math 11% / reading 14% proficiency, ranked #554 of 620 in IL (top 89%) — low school quality limits family demand, transient renter base, plan for 1-2y turnover; 70% free/reduced lunch — lower-income household profile, screen leases tightly.
- Zoned schools: Manual High School (math 2% / reading 2%, grade F, #659 of 693 statewide, top 100%, 656 students, 0% FRL) — zoned schools average 0% FRL vs 70% district-wide (70 pts lower); this property's tenant base skews higher-income than the district average.
- Market conditions: Rents rising (+2.3%/yr); 180 active listings in the ZIP; 23 comparable units currently listed for rent nearby; rentals leasing fast (median 14d on market — plan ~1-2 weeks tenant-placement turnaround); 73 units permitted in Peoria County in 2024 (0 in 5+ unit buildings).
Forward outlook
- Local home prices are declining (-3.0%/yr); year-one equity from $1k of loan paydown is wiped out by about $4k of value loss. Plan a longer hold.
- Peoria County population projected at -11% by 2050 — secular population decline; favor cash flow + early exit over multi-decade hold.
Negotiation context
- Only 10 days on market — expect competitive offers; lowballing is unlikely to land.
- 2 sale attempts since 13y ago with the ask held roughly flat each time — persistent listings suggest the price (not the market) is what's stuck; bring a comps-based counter.
- Current owner paid $71k; list at $145k implies a 104% gain — meaningful room to come down on a strong offer.
Risks & watch-outs
- Watch-outs: built in 1948 — expect roof / HVAC / electrical / plumbing capex.
Questions for the listing agent
- What do current leases actually rent for vs. the listed asking? Can we see a recent rent roll and the last 12 months of T-12 income?
- Built in 1948 — when were the roof, HVAC, electrical panel, plumbing, and water heater last replaced?
- Is there a deadline driving the sale (1031 exchange, divorce, estate, relocation)? That informs how much negotiation room exists.
- Schools are F-rated, which usually means shorter tenancies and higher turnover. Who's the typical renter profile here, and what's been the actual vacancy rate?
- The area grade is low — what's the realistic commute time and amenity access for the typical tenant pool here? Any planned neighborhood developments (good or bad) we should know about?
- What's the average days-on-market for RENTAL listings here right now (not sales)? A rising rental-DOM trend means longer vacancies and softer asking-rent achievability than the comps imply.
- What's the recent tenant-quality profile in this submarket — average credit score on applications, eviction rate, late-payment / NSF rate, and stable-employment percentage? A property-management company in the area should have these aggregated.
- How much new for-sale + rental construction is in the pipeline within 1–3 miles? Heavy new supply typically softens prices + rents 12–24 months out; constrained supply supports both.
Investment metrics
- 1% rule
- 0.82% ✗
- Cap rate
- 5.51%
- Cash-on-cash
- -2.81%
- DSCR
- 0.87
- GRM
- 10.2
CMA / ARV
- ARV (on-the-fly)
- $112,995
- Comps found
- 12
Show comp detail 12 sales within ~0.75 mi
| Address | Dist | Beds/Ba | Sqft | Sold | Price | $/sf | Match |
|---|---|---|---|---|---|---|---|
| 2008 W Clarke Ave | 0.31mi | 3/2.0 | 1,284 (+6%) | 3mo | $119,000 | $93 | 73 |
| 2208 W Ayres Ave | 0.10mi | 2/1.5 (-1) | 1,297 (+7%) | 4mo | $120,000 | $93 | 73 |
| 2111 W Callender Ave | 0.13mi | 3/1.0 | 1,050 (-14%) | 1mo | $43,500 | $41 | 67 |
| 2027 W Sherman Ave | 0.21mi | 3/1.0 | 1,109 (-9%) | 6mo | $110,000 | $99 | 66 |
| 2118 W Sherman Ave | 0.18mi | 3/1.0 | 1,075 (-12%) | 3mo | $85,000 | $79 | 66 |
| 2306 Laura Ave | 0.36mi | 2/1.0 (-1) | 1,159 (-5%) | 2mo | $116,000 | $100 | 65 |
| 1913 W Laura Ave | 0.48mi | 3/1.0 | 1,155 (-5%) | 8mo | $28,500 | $25 | 59 |
| 1622 W Callender St | 0.51mi | 3/1.0 | 1,134 (-7%) | 2mo | $95,000 | $84 | 59 |
| 2511 W Downs Cir | 0.36mi | 2/1.0 (-1) | 1,063 (-12%) | 2mo | $101,000 | $95 | 52 |
| 1808 W Fredonia Ave | 0.40mi | 4/1.0 (+1) | 1,340 (+10%) | 8mo | $48,000 | $36 | 49 |
| 809 N Idaho St | 0.59mi | 2/1.0 (-1) | 1,129 (-7%) | 8mo | $110,000 | $97 | 45 |
| 614 N Lammers Ave | 0.74mi | 2/1.0 (-1) | 1,350 (+11%) | 6mo | $130,000 | $96 | 33 |
Match score weights: distance 35% · size 25% · config 20% · recency 20%. Top-matched comps best support the ARV.
Projected returns pro-forma
-3.0% appreciation · 2.3% rent growth · sell at horizon
- IRR
- -21.8%
- Equity multiple
- 0.25×
- Total profit
- $-30,323
- Equity at exit
- $21,605
- IRR
- -17.3%
- Equity multiple
- 0.08×
- Total profit
- $-37,405
- Equity at exit
- $12,528
Cash invested: $40,572 (down + closing). Projections, not guarantees.
Landlord ↔ Tenant lean methodology
- Overall (STATE)
- 43 Moderately Tenant-Leaning
- State Illinois
- 43 Moderately Tenant-Leaning · D+7
- County
- — inherits STATE
- City
- — inherits STATE
ZIP-level market 61604
- Home prices YoY
- -24.6%
- Rents YoY
- 2.3%
- Active inventory
- 180
- Price-to-rent
- 10.2×
Monthly cashflow live
- Estimated rent
- $1,189 high interval (Pro) →
- Mortgage (P&I)
- −$760
- Tax from tax record
- −$214 /mo · $2,569/yr
- Insurance
- −$60
- HOA
- −$0
- Vacancy / Maint / Mgmt
- −$250
- Net cashflow
- $-95
Break-even live
UW: 25.0% down · 7.5% · 30yr · 1.5% tax · 5.0% vac · 8.0% maint · 8.0% mgmt
Financing live
Cash to close
- Down payment
- $36,225
- Closing costs
- $4,347
- Reserves months
- —
- Total cash needed
- —
Loan-product check · same deal, 3 products live
Conventional
25% down · 7.5% · 30yr
- Down + closing
- —
- Monthly P&I
- —
- Monthly cashflow
- —
- DSCR
- —
- Eligible?
- —
Personal DTI + credit; lowest rate.
DSCR
20% down · 8.5% · 30yr
- Down + closing
- —
- Monthly P&I
- —
- Monthly cashflow
- —
- DSCR
- —
- Eligible?
- —
No personal income docs; deal must DSCR.
Hard money
10% down · 12.0% · 12mo
- Down + closing
- —
- Monthly P&I
- —
- Monthly cashflow
- —
- DSCR
- —
- Eligible?
- —
Short-term bridge; refi at stabilization.
Rent comps 23 comps
| Address | Beds | Baths | Sqft | Rent | $/sqft | DOM | Units | Dist |
|---|---|---|---|---|---|---|---|---|
| 102 N Cedar Ave West Peoria, IL | 4.0 | 1.0 | 1272 | $995 | $0.78 | 43d | 1 | 0.35mi |
| 2601 W Kenwood Ave West Peoria, IL | 3.0 | 1.5 | 1405 | $1,500 | $1.07 | 13d | 1 | 0.39mi |
| 1723 W Fredonia Ave Peoria, IL | 4.0 | 2.5 | 1219 | $2,100 | $1.72 | 13d | 1 | 0.44mi |
| 2317 W Martin Luther King Junior Dr Peoria, IL | 1.0–2.0 | 1.0 | 697 | $800 | $1.15 | 13d | 3 | 0.53mi |
| 2317 W Martin Luther King Junior Dr Unit 2-214 Peoria, IL | 2.0 | 1.0 | 807 | $800 | $0.99 | 43d | 1 | 0.53mi |
| 1019 N Farmington Rd Unit 1017 Peoria, IL | 3.0 | 1.0 | 1304 | $1,600 | $1.23 | 43d | 1 | 0.66mi |
| 2807 W Howett St Peoria, IL | 3.0 | 2.0 | 1388 | $1,550 | $1.12 | 43d | 1 | 0.78mi |
| 1401 W Adrian G Hinton Ave Peoria, IL | 2.0 | 1.0 | 1100 | $775 | $0.70 | 43d | 1 | 0.79mi |
| 1540 W Kettelle St Peoria, IL | 3.0 | 1.0 | 1001 | $748 | $0.75 | 13d | 1 | 0.80mi |
| 1220 W John H Gwynn Jr Ave Peoria, IL | 2.0 | 1.0 | 853 | $745 | $0.87 | 21d | 1 | 0.84mi |
| 2116 W Proctor St Peoria, IL | 2.0 | 1.0 | 912 | $879 | $0.96 | 13d | 1 | 1.01mi |
| 3001 W Wiswall St Peoria, IL | 2.0 | 1.0 | 1000 | $1,100 | $1.10 | 13d | 1 | 1.03mi |
| 1214 W Butler St Peoria, IL | 4.0 | 1.0 | 1440 | $795 | $0.55 | 43d | 1 | 1.05mi |
| 3031 W Wiswall St Peoria, IL | 2.0 | 1.0 | 1100 | $1,100 | $1.00 | 13d | 1 | 1.08mi |
| 928 S Matthew St Peoria, IL | 2.0 | 1.0 | 1080 | $748 | $0.69 | 13d | 1 | 1.14mi |
| 2822 W Antoinette St Peoria, IL | 2.0 | 1.0 | 720 | $1,149 | $1.60 | 21d | 1 | 1.16mi |
| 945 S Shelley St Peoria, IL | 1.0–3.0 | 1.0–2.0 | 929 | $1,025 | $1.10 | 13d | 1 | 1.18mi |
| 2320 W Garden St Peoria, IL | 2.0 | 1.0 | 1096 | $1,000 | $0.91 | 43d | 1 | 1.19mi |
| 906 S Tonti Cir Peoria, IL | 2.0 | 1.0 | 780 | $950 | $1.22 | 13d | 1 | 1.20mi |
| 1801 N Gentry Ln West Peoria, IL | 3.0 | 1.0 | 1000 | $1,650 | $1.65 | 13d | 1 | 1.22mi |
| 911 N Sheridan Rd Unit a1 Peoria, IL | 2.0 | 1.0 | 825 | $850 | $1.03 | 13d | 1 | 1.36mi |
| 911 N Sheridan Rd Unit A4 Peoria, IL | 2.0 | 1.0 | 825 | $850 | $1.03 | 43d | 1 | 1.36mi |
| 1507 S Livingston St Peoria, IL | 2.0 | 1.0 | 842 | $946 | $1.12 | 43d | 1 | 1.45mi |
Listing history 9 events
-
2026-06-19days on market $144,900 Active 10 DOM
-
2026-06-18days on market $144,900 Active 9 DOM
-
2026-06-17days on market $144,900 Active 8 DOM
-
2026-06-16days on market $144,900 Active 7 DOM
-
2026-06-15days on market $144,900 Active 6 DOM
-
2026-06-14days on market $144,900 Active 4 DOM
-
2026-06-13days on market $144,900 Active 3 DOM
-
2026-06-10remarks 672-char remark
-
2026-06-10$144,900 Active 1 DOM
ⓘ Source: listings_history table (triggers on properties + properties_extension) + one-shot
backfill from property_details.listing_events for pre-trigger history.
Tax reassessment forecast IL · Partial reset (capped growth)
- Current annual tax
- $2,569 · $214/mo
- Projected year-2 tax
- $2,929 · $244/mo
- Expected delta
- +$360/yr (+$30/mo · 14.0%)
ⓘ Screening estimate from a state-policy table — verify with the county assessor before closing.
Climate risk First Street
- Flood 1/10 Low FEMA zone X · 0% chance over 30 yrs
- Wildfire 1/10 Low
- Heat 3/10 Moderate 7 d/yr ≥105°F today · 18 d/yr by 30 yrs out
- Wind 2/10 Low 100% chance of damaging wind over 30 yrs
- Air quality 3/10 Moderate 1 unhealthy d/yr today · 3 by 30 yrs out
Nearby sold comps map
Loading sold comps map…
Walkable amenities ~0.75 mi
Loading nearby amenities…
Taxation est. · year 1
- Rental income
- $14,268
- − Mortgage interest
- −$8,117
- − Property taxes
- −$2,569
- − Insurance
- −$724
- − Repairs & maintenance
- −$1,141
- − Management
- −$1,141
- − Depreciation
- −$4,215
- Taxable loss
- −$3,640
- Est. tax savings @ 24.0%
- +$874
- After-tax cash flow
- $-266/yr
For passive investors: Depreciation is non-cash, so a rental often shows a tax loss while cash-flowing — sheltering income. Rental losses are passive: they offset passive income freely, and up to $25,000/yr can offset ordinary (W-2) income if you actively participate and your MAGI is under $100k (phasing out to $0 by $150k); unused losses carry forward. On sale, claimed depreciation is recaptured at up to 25%, and gains may owe capital-gains tax (a 1031 exchange can defer both). Figures are a year-1 estimate at your 24.0% rate — not tax advice; consult a CPA.
Schools (NCES district)
- District
- Peoria SD 150
- NCES district ID
- 1731230
- Math proficiency
- 11% ▼ -5.00%
- Reading proficiency
- 14% ▼ -4.00%
- Median HH income
- $41,951
- Composite
- 10.92/100
- National rank
- #9751
- State rank
- #554 of 620 in IL
Livability — West Peoria
- Score
- 76/100
- State rank
- #181
- US rank
- #3474
Category grades
Schools grade is shown separately in the Schools card above.
Census & demographics
- Census place
- West Peoria, IL
- County
- Peoria County · 120,495 people
- Metro
- Peoria, IL
- Population (ZIP)
- 28,313
- Household income
- $52,414
- Rent vs Own
- Severe rent burden
- 815.0
Population outlook (Peoria County) Hauer SSP2
- Today (2025)
- 183,007 people
- By 2030
- 179,643 · -1.8%
- By 2040
- 171,782 · -6.1%
- By 2050
- 163,508 · -10.7%
- By 2075
- 140,178 · -23.4%
- By 2100
- 114,493 · -37.4%
Race, ethnicity, and origin ACS 2023
- Neighborhood character
- Diverse neighborhood (Simpson 0.61)
- Race & ethnicity
- White 55% Black 29% Two or more races 10% Hispanic / Latino 7% Asian 2%
- Hispanic origin (detail)
- Mexican 5%
- Common ancestry
- Italian 2% Slovak 1% Iranian 1%
- Foreign-born
- 6% · Canada, China
- Languages at home
- 92% English-only · Spanish 4% Chinese 1% French/Haitian/Cajun 1%
Political lean MEDSL · Peoria
- 2024 margin
- Toss-up / Even · D 51.5% · R 46.9% · Other 1.6%
- 2008→2024 swing
- -9.2pp toward R · 2008: 13.9pp · 2024: 4.7pp
- All cycles
- 2024: D+4.7 2020: D+6.3 2016: D+2.8 2012: D+4.4 2008: D+13.9
Not yet ingested
- Civics
- —
Market trends
- HPI YoY
- ▼ -54.15%
- Current HPI
- 165.8838
- Rent YoY
- ▲ 2.30%
- Metro
- Peoria, IL
- State GDP YoY
- ▲ 1.59%
- F500 in state
- 60
Industry mix (Fortune 500 HQ in IL)
| Industry | F500 HQs | Revenue |
|---|---|---|
| Insurance | 4 | $201B |
|
||
| Consumer Goods | 4 | $87B |
|
||
| Industrial Machinery | 3 | $64B |
|
||
| Healthcare | 2 | $55B |
|
||
| Retail / Pharmacy | 1 | $148B |
|
||
| Agriculture / Food | 1 | $86B |
|
||
Price history
+93.5% since first listed6 events — show timeline
- 2026-06-09 Listed $144,900 RMLSA as Distributed by MLS Grid
- 2021-08-06 Listing Removed — RMLSA as Distributed by MLS Grid
- 2021-08-06 Listing Removed — RMLSA as Distributed by MLS Grid
- 2014-07-28 Sold (Public Records) $71,000 Public Records
- 2014-07-25 Sold (MLS) $70,750 RMLSA as Distributed by MLS Grid
- 2013-08-05 Listed $74,900 RMLSA as Distributed by MLS Grid
Property tax history
+3.7%/yrLatest (2025): $2,569 · +13.2% YoY. Source: county tax records.
Cash-flow waterfall
monthlySold comps — $/sqft
last 12 mo · ≤1 miLoading sold comps…