335 Coventry Ct · Clarendon Hills, IL
Flood risk 1/10 · Minimal
- FEMA flood zone
- X (unshaded)
- Chance of flooding over 30 yrs
- 0.0%
- Est. flood insurance / yr
- $507 – $1,088
Fire risk 1/10 · Minimal
- Est. fire insurance / yr
- $804 – $1,492
Heat risk 3/10 · Minor
- Hot days now (above 103°F)
- 7 days/yr
- Hot days in 30 yrs
- 14 days/yr
Wind risk 2/10 · Minimal
- Chance of severe wind over 30 yrs
- 0.0%
Air-quality risk 3/10 · Minor
- Unhealthy air days now
- 3 days/yr
- Unhealthy air days in 30 yrs
- 4 days/yr
Risk factors via First Street. Map © Google.
Why this score? — see what drove the C grade
The composite is a weighted blend of 9 inputs, each scored 0–100. Each bar is that input's sub-score; the figure is the points it added to the 100-point composite (weight × sub-score).
- Cash flow +20.5/30.0
- ARV discount +7.5/15.0
- DSCR +6.5/10.0
- Schools +6.0/10.0
- 1% rule +5.8/10.0
- Livability +4.2/5.0
- Rent growth +2.5/5.0
- Condition / age +2.5/5.0
- Appreciation +0.0/10.0
$249,900
🖨 Deal sheet 📄 Offer letter ✓ Due diligence
Listing remarks
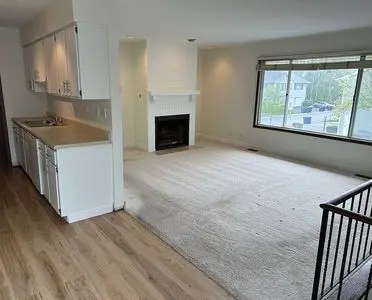
Beautiful and well-maintained 2-bedroom, 1-bath condo in a quiet, established community in Clarendon Hills. This bright and spacious unit features an open living area with a cozy fireplace, large windows for natural light, and a functional layout. Enjoy a private balcony, attached garage, and convenient access to shopping, dining, and major highways.
Key facts
- Attached garage
- Private balcony
- Convenient access
Tags
Neighborhood map
What this means for you Summary
Snapshot
- This is a 2-bed/1.0-bath condo listed at $250k.
Deal economics
- At list price, monthly cash flow is $331 ($4k/yr) — positive.
- The deal already cash-flows at list — no discount required.
- Meets the 1% rule at list price ($3k rent vs $250k).
- Recommended offer: $242k (3.0% below list) — sets the bar for market timing.
- Cap rate 7.9% vs local median 0.7% in Clarendon Hills — top-decile yield for the area; either an underpriced asset or a hidden risk that comps aren't pricing in. Stress-test before assuming the spread holds.
Location & tenants
- Location reads 83/100 on livability (#48 in IL, #978 nationally) — a professional / high-income tenant draw. Strengths: schools A+, crime A+, commute A+; Watch: health & safety C-, amenities F, cost of living F.
- Hinsdale Twp Hsd 86 (suburban): math 62% / reading 64% proficiency, ranked #17 of 620 in IL (top 3%) — acceptable for families but not a draw, mixed tenant base, ~2y average lease.
- Market conditions: 27 active listings in the ZIP; 13 comparable units currently listed for rent nearby; rentals leasing fast (median 5d on market — plan ~1-2 weeks tenant-placement turnaround); high-income renter base; 1,378 units permitted in DuPage County in 2024 (594 in 5+ unit buildings).
Forward outlook
- Local home prices are declining (-3.0%/yr); year-one equity from $2k of loan paydown is wiped out by about $7k of value loss. Plan a longer hold.
Negotiation context
- It's been on market 37 days — a 3% lower offer ($242k) is reasonable based on typical stale-listing flexibility.
- Current owner paid $121k; list at $250k implies a 107% gain — meaningful room to come down on a strong offer.
Questions for the listing agent
- It's been on market 37 days. Have you received any prior offers? Is the seller open to a 3% concession, seller financing, or rate buy-down credit?
- Any open or pending special assessments — roof, HVAC, plumbing, elevator, façade? What's the per-unit balance and payoff schedule, and is the seller paying it off at close or rolling it to the buyer?
- Is there a deadline driving the sale (1031 exchange, divorce, estate, relocation)? That informs how much negotiation room exists.
- Schools are A-rated — typically a magnet for longer-tenancy family renters. What's the average tenant stay here, and is there a school-zone premium baked into asking?
- What's the average days-on-market for RENTAL listings here right now (not sales)? A rising rental-DOM trend means longer vacancies and softer asking-rent achievability than the comps imply.
- What's the recent tenant-quality profile in this submarket — average credit score on applications, eviction rate, late-payment / NSF rate, and stable-employment percentage? A property-management company in the area should have these aggregated.
- How much new apartment / multifamily construction is in the pipeline within 1–3 miles? Heavy new supply (>2% of stock underway) typically softens rents 12–24 months out; light construction supports rent growth.
Investment metrics
- 1% rule
- 1.08% ✓
- Cap rate
- 7.88%
- Cash-on-cash
- 5.68%
- DSCR
- 1.25
- GRM
- 7.7
CMA / ARV
No comps found within radius.
Projected returns pro-forma
-3.0% appreciation · 3.0% rent growth · sell at horizon
- IRR
- -7.5%
- Equity multiple
- 0.72×
- Total profit
- $-19,302
- Equity at exit
- $37,261
- IRR
- 2.1%
- Equity multiple
- 1.15×
- Total profit
- $10,715
- Equity at exit
- $21,607
Cash invested: $69,972 (down + closing). Projections, not guarantees.
Landlord ↔ Tenant lean methodology
- Overall (STATE)
- 43 Moderately Tenant-Leaning
- State Illinois
- 43 Moderately Tenant-Leaning · D+7
- County
- — inherits STATE
- City
- — inherits STATE
ZIP-level market 60514
- Active inventory
- 27
- Price-to-rent
- 7.7×
Monthly cashflow live
- Estimated rent
- $2,695 high interval (Pro) →
- Mortgage (P&I)
- −$1,311
- Tax from tax record
- −$383 /mo · $4,598/yr
- Insurance
- −$104
- HOA
- −$0
- Vacancy / Maint / Mgmt
- −$566
- Net cashflow
- $331
Break-even live
UW: 25.0% down · 7.5% · 30yr · 1.5% tax · 5.0% vac · 8.0% maint · 8.0% mgmt
Financing live
Cash to close
- Down payment
- $62,475
- Closing costs
- $7,497
- Reserves months
- —
- Total cash needed
- —
Loan-product check · same deal, 3 products live
Conventional
25% down · 7.5% · 30yr
- Down + closing
- —
- Monthly P&I
- —
- Monthly cashflow
- —
- DSCR
- —
- Eligible?
- —
Personal DTI + credit; lowest rate.
DSCR
20% down · 8.5% · 30yr
- Down + closing
- —
- Monthly P&I
- —
- Monthly cashflow
- —
- DSCR
- —
- Eligible?
- —
No personal income docs; deal must DSCR.
Hard money
10% down · 12.0% · 12mo
- Down + closing
- —
- Monthly P&I
- —
- Monthly cashflow
- —
- DSCR
- —
- Eligible?
- —
Short-term bridge; refi at stabilization.
Rent comps 13 comps
| Address | Beds | Baths | Sqft | Rent | $/sqft | DOM | Units | Dist |
|---|---|---|---|---|---|---|---|---|
| 16W780 57th St Unit A Clarendon Hills, IL | 3.0 | 1.5 | 1200 | $2,400 | $2.00 | 12d | 1 | 0.40mi |
| 16W651 56th St Unit 1 Clarendon Hills, IL | 3.0 | 1.5 | 1400 | $2,600 | $1.86 | 4d | 1 | 0.52mi |
| 229 Park Ave Clarendon Hills, IL | 1.0–2.0 | 1.0–3.0 | 1111 | $3,875 | $3.49 | 3d | 8 | 0.65mi |
| 15 W 56th St Westmont, IL | 3.0 | 1.5 | 1152 | $2,850 | $2.47 | 17d | 1 | 0.74mi |
| 143 Ann St Unit 3N Clarendon Hills, IL | 2.0 | 1.0 | 750 | $2,800 | $3.73 | 24d | 1 | 0.75mi |
| 21 58th St Clarendon Hills, IL | 1.0–2.0 | 1.0–2.0 | 900 | $1,935 | $2.15 | 2d | 2 | 0.81mi |
| 1 W Quincy St Westmont, IL | 2.0 | 1.0–2.0 | 826 | $3,294 | $3.99 | 1d | 6 | 0.85mi |
| 6060 Laurel Ln Willowbrook, IL | 1.0–2.0 | 1.0–2.0 | 820 | $2,625 | $3.20 | 1d | 58 | 0.94mi |
| 26 W Burlington Ave Unit 1026690P Westmont, IL | 2.0 | 1.0 | 893 | $4,143 | $4.64 | 1d | 1 | 0.96mi |
| 30 W Burlington Ave Unit 1026700P Westmont, IL | 2.0 | 1.0 | 990 | $4,112 | $4.15 | 5d | 1 | 0.97mi |
| 1 Fountainhead Dr Westmont, IL | 1.0–2.0 | 1.0–1.5 | 950 | $2,080 | $2.19 | 1d | 18 | 1.03mi |
| 6340 Americana Dr #817 Willowbrook, IL | 3.0 | 2.0 | 1350 | $2,500 | $1.85 | 12d | 1 | 1.18mi |
| 6340 Americana Dr Willowbrook, IL | 1.0–3.0 | 1.0–2.0 | 1060 | $2,150 | $2.03 | 5d | 2 | 1.23mi |
HOA detail condo
- Monthly dues
- $0 · $0/yr
- Assessments
- None detected in remarks — confirm with the listing agent.
Listing history 20 events
-
2026-06-18days on market $249,900 Active 37 DOM
-
2026-06-17days on market $249,900 Active 36 DOM
-
2026-06-16days on market $249,900 Active 35 DOM
-
2026-06-15days on market $249,900 Active 34 DOM
-
2026-06-13days on market $249,900 Active 32 DOM
-
2026-06-13days on market $249,900 Active 31 DOM
-
2026-06-09days on market $249,900 Active 28 DOM
-
2026-06-08days on market $249,900 Active 27 DOM
-
2026-06-07days on market $249,900 Active 26 DOM
-
2026-06-04days on market $249,900 Active 23 DOM
-
2026-06-03days on market $249,900 Active 22 DOM
-
2026-06-02days on market $249,900 Active 21 DOM
-
2026-06-01days on market $249,900 Active 20 DOM
-
2026-05-31days on market $249,900 Active 19 DOM
-
2026-05-12$249,900 Active
-
2000-04-19soldstatus $121,000
-
1998-08-13soldstatus $118,000
-
1996-05-16soldstatus $110,000
-
1992-07-08soldstatus $100,000
-
1989-03-28soldstatus $84,000
ⓘ Source: listings_history table (triggers on properties + properties_extension) + one-shot
backfill from property_details.listing_events for pre-trigger history.
Tax reassessment forecast IL · Partial reset (capped growth)
- Current annual tax
- $4,598 · $383/mo
- Projected year-2 tax
- $5,136 · $428/mo
- Expected delta
- +$537/yr (+$45/mo · 11.7%)
ⓘ Screening estimate from a state-policy table — verify with the county assessor before closing.
Climate risk First Street
- Flood 1/10 Low FEMA zone X (unshaded) · 0% chance over 30 yrs
- Wildfire 1/10 Low
- Heat 3/10 Moderate 7 d/yr ≥103°F today · 14 d/yr by 30 yrs out
- Wind 2/10 Low 0% chance of damaging wind over 30 yrs
- Air quality 3/10 Moderate 3 unhealthy d/yr today · 4 by 30 yrs out
Nearby sold comps map
Loading sold comps map…
Walkable amenities ~0.75 mi
Loading nearby amenities…
Taxation est. · year 1
- Rental income
- $32,343
- − Mortgage interest
- −$13,998
- − Property taxes
- −$4,598
- − Insurance
- −$1,250
- − Repairs & maintenance
- −$2,587
- − Management
- −$2,587
- − Depreciation
- −$7,270
- Taxable income
- $52
- Est. tax owed @ 24.0%
- −$13
- After-tax cash flow
- $3,965/yr
For passive investors: Depreciation is non-cash, so a rental often shows a tax loss while cash-flowing — sheltering income. Rental losses are passive: they offset passive income freely, and up to $25,000/yr can offset ordinary (W-2) income if you actively participate and your MAGI is under $100k (phasing out to $0 by $150k); unused losses carry forward. On sale, claimed depreciation is recaptured at up to 25%, and gains may owe capital-gains tax (a 1031 exchange can defer both). Figures are a year-1 estimate at your 24.0% rate — not tax advice; consult a CPA.
Schools (NCES district)
- District
- Hinsdale Twp Hsd 86
- NCES district ID
- 1719320
- Math proficiency
- 62% ▼ -5.00%
- Reading proficiency
- 64% ▬ 0.00%
- Median HH income
- $118,692
- Composite
- 60.13/100
- National rank
- #868
- State rank
- #17 of 620 in IL
Livability — Clarendon Hills
- Score
- 83/100
- State rank
- #48
- US rank
- #978
Category grades
Schools grade is shown separately in the Schools card above.
Census & demographics
- Census place
- Clarendon Hills, IL
- County
- DuPage County · 904,569 people
- City population
- 9,918
- Metro
- Chicago-Naperville-Elgin, IL-IN-WI
- Population (ZIP)
- 9,918
- Household income
- $118,716
- Rent vs Own
- Severe rent burden
- 248.0
Population outlook (DuPage County) Hauer SSP2
- Today (2025)
- 960,187 people
- By 2030
- 965,850 · +0.6%
- By 2040
- 965,812 · +0.6%
- By 2050
- 954,890 · -0.6%
- By 2075
- 910,185 · -5.2%
- By 2100
- 816,255 · -15.0%
Race, ethnicity, and origin ACS 2023
- Neighborhood character
- Predominantly White (81%)
- Race & ethnicity
- White 81% Asian 12% Two or more races 5% Hispanic / Latino 3%
- Common ancestry
- Romanian 8% Italian 4% Slovak 3%
- Foreign-born
- 13% · China, Canada
- Languages at home
- 83% English-only · Other Indo-European 9% Russian/Polish/Slavic 2% Spanish 2%
Political lean MEDSL · DuPage
- 2024 margin
- D (+13.3) · D 55.9% · R 42.5% · Other 1.6%
- 2008→2024 swing
- +2.5pp toward D · 2008: 10.8pp · 2024: 13.3pp
- All cycles
- 2024: D+13.3 2020: D+18.1 2016: D+14.1 2012: D+1.0 2008: D+10.8
Not yet ingested
- Civics
- —
Market trends
- HPI YoY
- ▼ -330.36%
- Current HPI
- 207.7712
- Rent YoY
- —
- Metro
- Chicago-Naperville-Elgin, IL-IN-WI
- State GDP YoY
- ▲ 1.59%
- F500 in state
- 60
Industry mix (Fortune 500 HQ in IL)
| Industry | F500 HQs | Revenue |
|---|---|---|
| Insurance | 4 | $201B |
|
||
| Consumer Goods | 4 | $87B |
|
||
| Industrial Machinery | 3 | $64B |
|
||
| Healthcare | 2 | $55B |
|
||
| Retail / Pharmacy | 1 | $148B |
|
||
| Agriculture / Food | 1 | $86B |
|
||
Price history
+197.5% since first listed6 events — show timeline
- 2026-05-12 Listed $249,900 FSBO.com
- 2000-04-19 Sold (Public Records) $121,000 Public Records
- 1998-08-13 Sold (Public Records) $118,000 Public Records
- 1996-05-16 Sold (Public Records) $110,000 Public Records
- 1992-07-08 Sold (Public Records) $100,000 Public Records
- 1989-03-28 Sold (Public Records) $84,000 Public Records
Property tax history
+3.3%/yrLatest (2024): $4,598 · +5.4% YoY. Source: county tax records.
Cash-flow waterfall
monthlySold comps — $/sqft
last 12 mo · ≤1 miLoading sold comps…