27484 Oregon Rd #28 · Rossford, OH
Flood risk No data
- FEMA flood zone
- —
- Chance of flooding over 30 yrs
- —
- Est. flood insurance / yr
- —
Fire risk No data
- Est. fire insurance / yr
- —
Heat risk No data
- Hot days now (above threshold)
- —
- Hot days in 30 yrs
- —
Wind risk No data
- Chance of severe wind over 30 yrs
- —
Air-quality risk No data
- Unhealthy air days now
- —
- Unhealthy air days in 30 yrs
- —
Risk factors via First Street. Map © Google.
Why this score? — see what drove the B grade
The composite is a weighted blend of 9 inputs, each scored 0–100. Each bar is that input's sub-score; the figure is the points it added to the 100-point composite (weight × sub-score).
- Cash flow +30.0/30.0
- 1% rule +10.0/10.0
- DSCR +10.0/10.0
- ARV discount +7.5/15.0
- Rent growth +4.3/5.0
- Schools +4.0/10.0
- Condition / age +4.0/5.0
- Livability +3.6/5.0
- Appreciation +0.0/10.0
$120,000
🖨 Deal sheet 📄 Offer letter ✓ Due diligence
Listing remarks
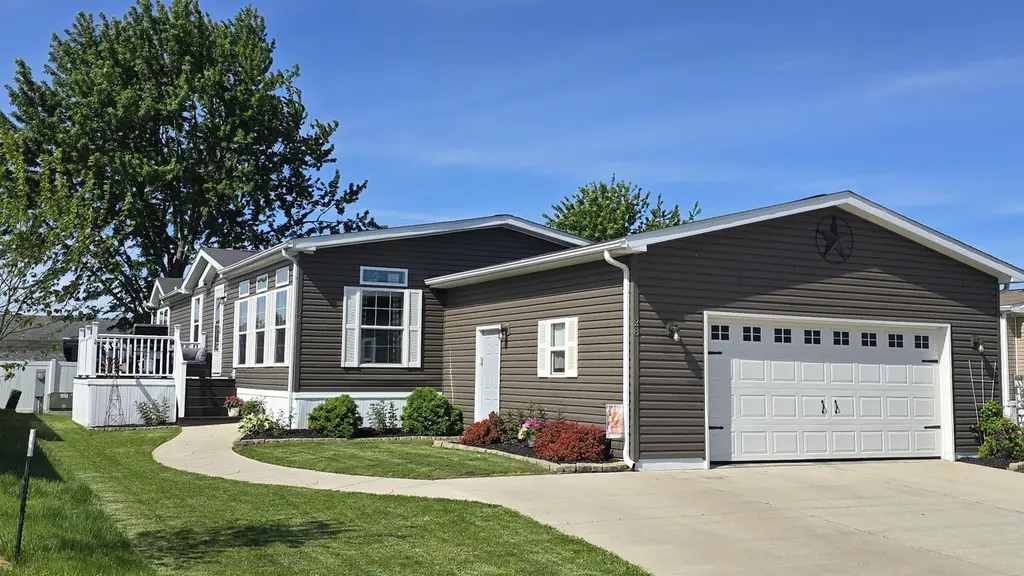
Meadows of Perrysburg is a private manufactured home community located in the great town of Perrysburg, Ohio. This beautiful community offers you a variety of amenities accessible by all residents. From the community center and pool, to the basketball court, volleyball court and playground, every inch of Meadows of Perrysburg is sure to meet your needs. The brand new homes at Meadows of Perrysburg range from 3 to 4-bedrooms and 2-bathrooms and are built for your modern lifestyle. The floor plans include an open concept with a large eat-in kitchen, plenty of cabinet and countertop space, and optional kitchen islands. The primary bedroom suites consist of beautiful spacious bedrooms, walk-in
Key facts
- Volleyball court
- Large eat-in kitchen
- Community center
Tags
Property features AI
Finance
- Other: Living area approximately 1,680; Listed price $125,000; Address: 27484 Oregon Rd #28, Perrysburg, OH 43551
Exterior
- Utilities: Natural gas; Central air
- Home design: Spec home in Colony Meadows of Perrysburg
- Exterior features: Shake roof
Interior
- Kitchen: Includes dishwasher, microwave, and refrigerator
- Bedrooms: 3 bedrooms
- Bathrooms: 2 bathrooms
- Heating & cooling: Natural gas heating; Central air; Ceiling fan(s)
- Interior features: Dishwasher; Microwave; Refrigerator
Neighborhood map
What this means for you Summary
Snapshot
- This is a 3-bed/2.0-bath manufactured listed at $120k. Condition is rated good.
Deal economics
- At list price, monthly cash flow is $644 ($8k/yr) — positive.
- The deal already cash-flows at list — no discount required.
- Meets the 1% rule at list price ($2k rent vs $120k).
- Recommended offer: $118k (1.5% below list) — sets the bar for market timing.
- Cap rate 12.7% vs local median 5.5% in Rossford — top-decile yield for the area; either an underpriced asset or a hidden risk that comps aren't pricing in. Stress-test before assuming the spread holds.
Location & tenants
- Location reads 71/100 on livability (#417 in OH) — a middle-class / working-renter tenant base. Strengths: cost of living A+, housing A+, employment A; Watch: amenities F, commute F, health & safety F.
- Rossford Exempted Village (suburban): math 44% / reading 50% proficiency, ranked #476 of 656 in OH (top 73%) — families likely to look elsewhere, expect single-tenant / working-renter base with shorter leases.
- Market conditions: Rents rising fast (+7.3%/yr); 235 active listings in the ZIP; 3 comparable units currently listed for rent nearby; rentals at typical pace (median 14d on market — plan ~3-4 weeks tenant-placement turnaround); solid renter incomes; 493 units permitted in Wood County in 2024 (48 in 5+ unit buildings).
Forward outlook
- Local home prices are declining (-3.0%/yr); year-one equity from $830 of loan paydown is wiped out by about $4k of value loss. Plan a longer hold.
- Wood County population projected at +14% by 2050 — modest demand growth; plan on rents tracking national, not racing it.
- At projected returns (-3.0% appreciation + 7.3% rent growth), your $34k cash investment doubles in ~5 years — after that, you're playing with house money.
Negotiation context
- It's been on market 26 days — a 2% lower offer ($118k) is reasonable based on typical stale-listing flexibility.
Questions for the listing agent
- Is there a deadline driving the sale (1031 exchange, divorce, estate, relocation)? That informs how much negotiation room exists.
- Schools are B-rated — typically a magnet for longer-tenancy family renters. What's the average tenant stay here, and is there a school-zone premium baked into asking?
- What's the average days-on-market for RENTAL listings here right now (not sales)? A rising rental-DOM trend means longer vacancies and softer asking-rent achievability than the comps imply.
- What's the recent tenant-quality profile in this submarket — average credit score on applications, eviction rate, late-payment / NSF rate, and stable-employment percentage? A property-management company in the area should have these aggregated.
- How much new for-sale + rental construction is in the pipeline within 1–3 miles? Heavy new supply typically softens prices + rents 12–24 months out; constrained supply supports both.
Investment metrics
- 1% rule
- 1.55% ✓
- Cap rate
- 12.74%
- Cash-on-cash
- 23.01%
- DSCR
- 2.02
- GRM
- 5.4
CMA / ARV
- ARV (on-the-fly)
- $63,840
- Comps found
- 2
Show comp detail 2 sales within ~0.75 mi
| Address | Dist | Beds/Ba | Sqft | Sold | Price | $/sf | Match |
|---|---|---|---|---|---|---|---|
| 27484 Oregon Rd #65 | 0.12mi | 3/2.0 | 1,800 (+7%) | 1mo | $60,000 | $33 | 82 |
| 27484 Oregon Rd #12 | 0.00mi | 3/— | 1,836 (+9%) | 8mo | $70,000 | $38 | 78 |
Match score weights: distance 35% · size 25% · config 20% · recency 20%. Top-matched comps best support the ARV.
Projected returns pro-forma
-3.0% appreciation · 7.34% rent growth · sell at horizon
- IRR
- 20.8%
- Equity multiple
- 1.90×
- Total profit
- $30,123
- Equity at exit
- $17,892
- IRR
- 31.8%
- Equity multiple
- 4.49×
- Total profit
- $117,346
- Equity at exit
- $10,375
Cash invested: $33,600 (down + closing). Projections, not guarantees.
Landlord ↔ Tenant lean methodology
- Overall (STATE)
- 73 Landlord-Friendly
- State Ohio
- 73 Landlord-Friendly · R+6
- County
- — inherits STATE
- City
- — inherits STATE
ZIP-level market 43551
- Rents YoY
- 7.3%
- Active inventory
- 235
- Price-to-rent
- 5.4×
Monthly cashflow live
- Estimated rent
- $1,865 medium interval (Pro) →
- Mortgage (P&I)
- −$629
- Tax est. 1.5%
- −$150 /mo · $1,800/yr
- Insurance
- −$50
- HOA
- −$0
- Vacancy / Maint / Mgmt
- −$392
- Net cashflow
- $644
Break-even live
UW: 25.0% down · 7.5% · 30yr · 1.5% tax · 5.0% vac · 8.0% maint · 8.0% mgmt
Financing live
Cash to close
- Down payment
- $30,000
- Closing costs
- $3,600
- Reserves months
- —
- Total cash needed
- —
Loan-product check · same deal, 3 products live
Conventional
25% down · 7.5% · 30yr
- Down + closing
- —
- Monthly P&I
- —
- Monthly cashflow
- —
- DSCR
- —
- Eligible?
- —
Personal DTI + credit; lowest rate.
DSCR
20% down · 8.5% · 30yr
- Down + closing
- —
- Monthly P&I
- —
- Monthly cashflow
- —
- DSCR
- —
- Eligible?
- —
No personal income docs; deal must DSCR.
Hard money
10% down · 12.0% · 12mo
- Down + closing
- —
- Monthly P&I
- —
- Monthly cashflow
- —
- DSCR
- —
- Eligible?
- —
Short-term bridge; refi at stabilization.
Rent comps 3 comps
| Address | Beds | Baths | Sqft | Rent | $/sqft | DOM | Units | Dist |
|---|---|---|---|---|---|---|---|---|
| 27484 Oregon Rd Perrysburg, OH | 3.0 | 2.0 | 1568 | $1,825 | $1.16 | 14d | 1 | 0.11mi |
| 28776 Starbright Blvd Perrysburg, OH | 3.0 | 1.5 | 1242 | $1,500 | $1.21 | 23d | 1 | 1.36mi |
| 28863 Oregon Rd Perrysburg, OH | 2.0 | 2.0 | 1161 | $1,772 | $1.53 | 14d | 7 | 1.44mi |
Listing history 16 events
-
2026-06-18price $120,000 Active 26 DOM
-
2026-06-18days on market $125,000 Active 26 DOM
-
2026-06-17days on market $125,000 Active 25 DOM
-
2026-06-16days on market $125,000 Active 24 DOM
-
2026-06-15days on market $125,000 Active 23 DOM
-
2026-06-14days on market $125,000 Active 21 DOM
-
2026-06-13days on market $125,000 Active 20 DOM
-
2026-06-10days on market $125,000 Active 18 DOM
-
2026-06-09days on market $125,000 Active 17 DOM
-
2026-06-08days on market $125,000 Active 16 DOM
-
2026-06-07days on market $125,000 Active 15 DOM
-
2026-06-03days on market $125,000 Active 11 DOM
-
2026-06-02days on market $125,000 Active 10 DOM
-
2026-06-01days on market $125,000 Active 9 DOM
-
2026-05-31days on market $125,000 Active 8 DOM
-
2026-05-30days on market $125,000 Active 7 DOM
ⓘ Source: listings_history table (triggers on properties + properties_extension) + one-shot
backfill from property_details.listing_events for pre-trigger history.
Nearby sold comps map
Loading sold comps map…
Walkable amenities ~0.75 mi
Loading nearby amenities…
Taxation est. · year 1
- Rental income
- $22,384
- − Mortgage interest
- −$6,722
- − Property taxes
- −$1,800
- − Insurance
- −$600
- − Repairs & maintenance
- −$1,791
- − Management
- −$1,791
- − Depreciation
- −$3,491
- Taxable income
- $6,190
- Est. tax owed @ 24.0%
- −$1,486
- After-tax cash flow
- $6,246/yr
For passive investors: Depreciation is non-cash, so a rental often shows a tax loss while cash-flowing — sheltering income. Rental losses are passive: they offset passive income freely, and up to $25,000/yr can offset ordinary (W-2) income if you actively participate and your MAGI is under $100k (phasing out to $0 by $150k); unused losses carry forward. On sale, claimed depreciation is recaptured at up to 25%, and gains may owe capital-gains tax (a 1031 exchange can defer both). Figures are a year-1 estimate at your 24.0% rate — not tax advice; consult a CPA.
Condition & rehab AI · 12 photos
This home is in good condition with a modern kitchen and bathrooms, and a well-maintained exterior. It is ready for a new owner or renter.
Value-add opportunities
- Resale Paint the exterior siding — Fresh paint can enhance curb appeal and property value.
- Rental Replace any worn-out curtains — Fresh curtains can make the space more inviting and appealing to potential renters.
Renovation cost estimate screening
Value-add ROI direction
- Resale Paint the exterior siding — Fresh paint can enhance curb appeal and property value. ↑
- Rental Replace any worn-out curtains — Fresh curtains can make the space more inviting and appealing to potential renters. ↑
ⓘ Cost ranges are severity-bucket heuristics (US national rule-of-thumb). Get contractor quotes + a written scope before underwriting a rehab budget.
Schools (NCES district)
- District
- Rossford Exempted Village
- NCES district ID
- 3904560
- Math proficiency
- 44% ▼ -13.00%
- Reading proficiency
- 50% ▼ -13.00%
- Median HH income
- $50,587
- Composite
- 40.34/100
- National rank
- #3744
- State rank
- #476 of 656 in OH
Livability — Rossford
- Score
- 71/100
- State rank
- #417
- US rank
- #6855
Category grades
Schools grade is shown separately in the Schools card above.
Census & demographics
- County
- Wood County · 75,163 people
- City population
- 6,157
- Metro
- Toledo, OH
- Population (ZIP)
- 43,770
- Household income
- $95,846
- Rent vs Own
- Severe rent burden
- 1027.0
Population outlook (Wood County) Hauer SSP2
- Today (2025)
- 138,744 people
- By 2030
- 143,189 · +3.2%
- By 2040
- 150,896 · +8.8%
- By 2050
- 158,589 · +14.3%
- By 2075
- 182,166 · +31.3%
- By 2100
- 196,533 · +41.7%
Race, ethnicity, and origin ACS 2023
- Neighborhood character
- Predominantly White (85%)
- Race & ethnicity
- White 85% Two or more races 7% Hispanic / Latino 5% Asian 4% Black 2%
- Hispanic origin (detail)
- Mexican 4%
- Common ancestry
- Romanian 12% Lithuanian 3% Slovak 2%
- Foreign-born
- 5% · Canada, China, Jamaica
- Languages at home
- 93% English-only · Other Indo-European 2% Spanish 2% Other Asian/Pacific 1%
Political lean MEDSL · Wood
- 2024 margin
- R (+10.2) · D 44.4% · R 54.6%
- 2008→2024 swing
- -17.3pp toward R · 2008: 7.1pp · 2024: -10.2pp
- All cycles
- 2024: R+10.2 2020: R+7.6 2016: R+8.5 2012: D+4.2 2008: D+7.1
Not yet ingested
- Civics
- —
Market trends
- HPI YoY
- ▼ -153.34%
- Current HPI
- 200.788
- Rent YoY
- ▲ 7.34%
- Metro
- Toledo, OH
- State GDP YoY
- ▲ 1.98%
- F500 in state
- 48
Industry mix (Fortune 500 HQ in OH)
| Industry | F500 HQs | Revenue |
|---|---|---|
| Insurance | 3 | $145B |
|
||
| Industrial Machinery | 3 | $49B |
|
||
| Financial Services | 3 | $24B |
|
||
| Consumer Goods | 2 | $93B |
|
||
| Aerospace / Defense | 2 | $47B |
|
||
| Utilities | 2 | $33B |
|
||
Cash-flow waterfall
monthlySold comps — $/sqft
last 12 mo · ≤1 miLoading sold comps…