 Duplex
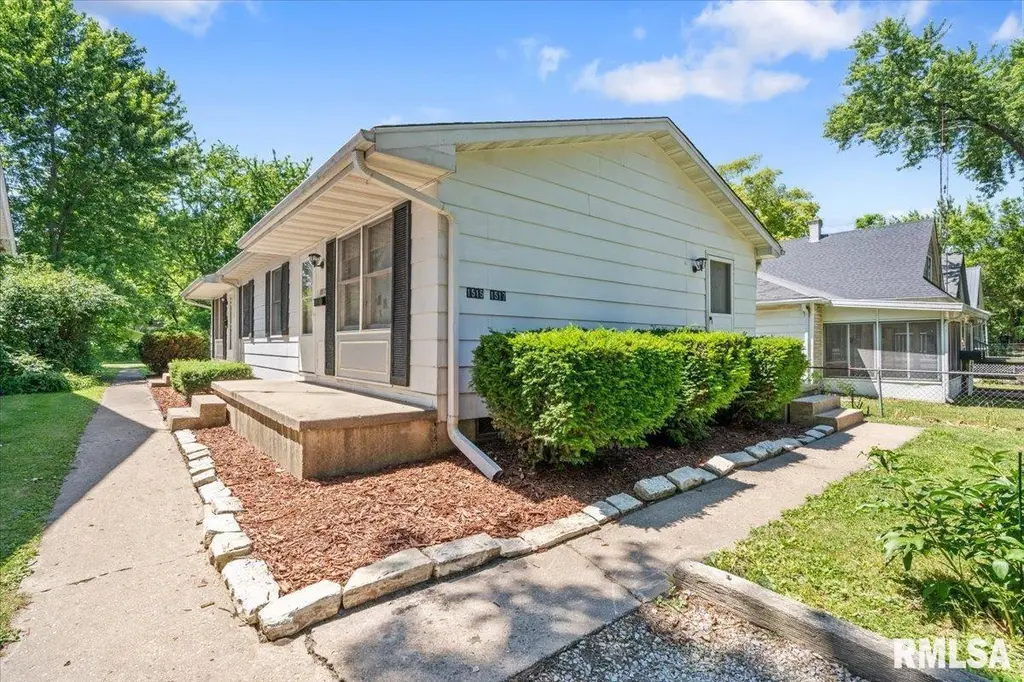
1515-1517 N Maryland Ave · Springfield, IL
Flood risk 1/10 · Minimal
- FEMA flood zone
- X (unshaded)
- Chance of flooding over 30 yrs
- 0.0%
- Est. flood insurance / yr
- $473 – $860
Fire risk 1/10 · Minimal
- Est. fire insurance / yr
- $804 – $1,492
Heat risk 4/10 · Minor
- Hot days now (above 104°F)
- 7 days/yr
- Hot days in 30 yrs
- 20 days/yr
Wind risk 2/10 · Minimal
- Chance of severe wind over 30 yrs
- 1.0%
Air-quality risk 2/10 · Minimal
- Unhealthy air days now
- 1 days/yr
- Unhealthy air days in 30 yrs
- 1 days/yr
Risk factors via First Street. Map © Google.
Why this score? — see what drove the C+ grade
The composite is a weighted blend of 9 inputs, each scored 0–100. Each bar is that input's sub-score; the figure is the points it added to the 100-point composite (weight × sub-score).
- Cash flow +25.5/30.0
- DSCR +8.5/10.0
- ARV discount +7.5/15.0
- 1% rule +6.7/10.0
- Livability +4.0/5.0
- Condition / age +3.8/5.0
- Rent growth +3.7/5.0
- Schools +1.7/10.0
- Appreciation +0.0/10.0
$179,500
🖨 Deal sheet (PDF) 📄 Offer letter ✓ Due diligence
Multi-family units
County records classify this as Multi-Family (2-4 Unit). Listing-text estimate: 2 units. confirmed
Listing remarks
Move-in ready duplex offering an excellent opportunity for both investors and owner -occupants! Each side features 2 bedroom and 1 full bath, with fresh paint, newer flooring and updated kitchen finishes. All appliances are included, including the refrigerator, stove, washer and dryer. Roof on North side is new and 1 hot water new + 2 new toilets and updated bathroom finishes! Located in a quiet neighborhood, this property is a great addition to any portfolio. Live in 1 unit and rent the other to help offset your mortgage, or lease both units for strong income potential! Don't miss this versatile investment opportunity. Schedule your private showing today!
Key facts
- Move in ready
- Quiet neighborhood
- 5,600 sq ft lot
Tags
Property features AI
Exterior
- Parking: Total 4 parking spaces assigned; Each unit has 2 parking spaces (2 uncovered per unit)
- Utilities: Public water; Public sewer
- Home design: Residential income property; One-story duplex; Built in 1977
- Construction: Shingle roof; Crawl space foundation
- Exterior features: Level lot; Paved road frontage; 40 x 140 lot dimensions
Interior
- Bedrooms: Two 2-bedroom units (Unit 1: 2 bedrooms, Unit 2: 2 bedrooms)
- Bathrooms: Unit 1: 1 full bathroom; Unit 2: 1 full bathroom
- Heating & cooling: Central air conditioning; Electric forced-air heating
- Interior features: Cable available; High-speed internet
- Laundry & utility: Each unit has laundry hook-ups
Neighborhood map
What this means for you Summary
Snapshot
- This is a 2 × 2-bed/1.0-bath units multifamily listed at $180k. Condition is rated good.
Deal economics
- At list price, monthly cash flow is $419 ($5k/yr) — positive. Per door: $210/mo.
- The deal already cash-flows at list — no discount required.
- Meets the 1% rule at list price ($2k rent vs $180k).
- Recommended offer: $177k (1.5% below list) — sets the bar for market timing.
- Cap rate 9.1% vs local median 4.9% in Springfield — top-decile yield for the area; either an underpriced asset or a hidden risk that comps aren't pricing in. Stress-test before assuming the spread holds.
Location & tenants
- Location reads 79/100 on livability (#122 in IL, #2,138 nationally) — a middle-class / working-renter tenant base. Strengths: amenities A+, commute A+, cost of living A+; Watch: crime F.
- Springfield SD 186 (urban): math 17% / reading 22% proficiency, ranked #438 of 620 in IL (top 71%) — low school quality limits family demand, transient renter base, plan for 1-2y turnover; 64% free/reduced lunch — lower-income household profile, screen leases tightly.
- Zoned schools: Mcclernand Elem School (math 5% / reading 5%, grade F, #1,741 of 2,056 statewide, top 93%, 191 students, 0% FRL); Washington Middle School (math 3% / reading 6%, grade F, #650 of 665 statewide, top 98%, 531 students, 0% FRL); Springfield High School (math 44% / reading 53%, grade D, #49 of 693 statewide, top 7%, 1,461 students, 0% FRL) — zoned schools average 0% FRL vs 64% district-wide (64 pts lower); this property's tenant base skews higher-income than the district average.
- Market conditions: Rents rising fast (+5.0%/yr); 137 active listings in the ZIP; 4 comparable units currently listed for rent nearby; rentals at typical pace (median 23d on market — plan ~3-4 weeks tenant-placement turnaround); 225 units permitted in Sangamon County in 2024 (48 in 5+ unit buildings).
- At $2,101/mo this rent would consume 49% of the median local household income ($51k/yr) (locally 1230% of renters already pay >50% of income on rent) — very limited rent-growth headroom before tenants either downsize or default.
Forward outlook
- Local home prices are declining (-3.0%/yr); year-one equity from $1k of loan paydown is wiped out by about $5k of value loss. Plan a longer hold.
- Sangamon County population projected to shrink 9% by 2050 — rents likely to lag national; underwrite the cash flow, not the appreciation.
- At projected returns (-3.0% appreciation + 5.0% rent growth), your $50k cash investment doubles in ~9 years — after that, you're playing with house money.
Negotiation context
- It's been on market 18 days — a 2% lower offer ($177k) is reasonable based on typical stale-listing flexibility.
Questions for the listing agent
- Can we see the unit-by-unit rent roll, current vacancy, and any below-market leases? What's the average tenancy length?
- What capital expenditures (roof, boiler, parking lot, exteriors) have been made in the last 5 years, and what's planned in the next 2?
- Built in 1977 — when were the roof, HVAC, electrical panel, plumbing, and water heater last replaced?
- Is there a deadline driving the sale (1031 exchange, divorce, estate, relocation)? That informs how much negotiation room exists.
- Schools are D-rated, which usually means shorter tenancies and higher turnover. Who's the typical renter profile here, and what's been the actual vacancy rate?
- Crime grade is F in this area — have there been break-ins, vandalism, or insurance claims at this property in the last 3 years? What carrier currently insures it and at what premium?
- What's the average days-on-market for RENTAL listings here right now (not sales)? A rising rental-DOM trend means longer vacancies and softer asking-rent achievability than the comps imply.
- What's the recent tenant-quality profile in this submarket — average credit score on applications, eviction rate, late-payment / NSF rate, and stable-employment percentage? A property-management company in the area should have these aggregated.
- How much new apartment / multifamily construction is in the pipeline within 1–3 miles? Heavy new supply (>2% of stock underway) typically softens rents 12–24 months out; light construction supports rent growth.
Investment metrics
- 1% rule
- 1.17% ✓
- Cap rate
- 9.10%
- Cash-on-cash
- 10.01%
- DSCR
- 1.45
- GRM
- 7.1
CMA / ARV
No comps found within radius.
Projected returns pro-forma
-3.0% appreciation · 4.95% rent growth · sell at horizon
- IRR
- 0.9%
- Equity multiple
- 1.04×
- Total profit
- $1,853
- Equity at exit
- $26,764
- IRR
- 12.5%
- Equity multiple
- 2.08×
- Total profit
- $54,076
- Equity at exit
- $15,520
Cash invested: $50,260 (down + closing). Projections, not guarantees.
Landlord ↔ Tenant lean methodology
- Overall (STATE)
- 43 Moderately Tenant-Leaning
- State Illinois
- 43 Moderately Tenant-Leaning · D+7
- County
- — inherits STATE
- City
- — inherits STATE
ZIP-level market 62702
- Home prices YoY
- -34.9%
- Rents YoY
- 5.0%
- Active inventory
- 137
- Price-to-rent
- 14.2×
Monthly cashflow live
- Estimated rent
- $2,101 medium interval (Pro) →
- Mortgage (P&I)
- −$941
- Tax est. 1.5%
- −$224 /mo · $2,692/yr
- Insurance
- −$75
- HOA
- −$0
- Vacancy / Maint / Mgmt
- −$441
- Net cashflow
- $419
Break-even live
Sensitivity live
| Price | -10% $543 | -5% $481 | +0% $419 | +5% $357 | +10% $295 |
|---|---|---|---|---|---|
| Rent | -10% $253 | -5% $336 | +0% $419 | +5% $502 | +10% $585 |
| Rate | -1.0pp $510 | -0.5pp $465 | base $419 | +0.5pp $373 | +1.0pp $325 |
2-unit breakdown (identical units grouped — click to expand)
| Units | Beds | Baths | Est. rent |
|---|---|---|---|
| 2× units | 2 | 1 | $2,100 |
| #1 | 2 | 1 | $1,050 |
| #2 | 2 | 1 | $1,050 |
| Total (2 units) | $2,101 | ||
UW: 25.0% down · 7.5% · 30yr · 1.5% tax · 5.0% vac · 8.0% maint · 8.0% mgmt
Financing live
Cash to close
- Down payment
- $44,875
- Closing costs
- $5,385
- Reserves months
- —
- Total cash needed
- —
Loan-product check · same deal, 3 products live
Conventional
25% down · 7.5% · 30yr
- Down + closing
- —
- Monthly P&I
- —
- Monthly cashflow
- —
- DSCR
- —
- Eligible?
- —
Personal DTI + credit; lowest rate.
DSCR
20% down · 8.5% · 30yr
- Down + closing
- —
- Monthly P&I
- —
- Monthly cashflow
- —
- DSCR
- —
- Eligible?
- —
No personal income docs; deal must DSCR.
Hard money
10% down · 12.0% · 12mo
- Down + closing
- —
- Monthly P&I
- —
- Monthly cashflow
- —
- DSCR
- —
- Eligible?
- —
Short-term bridge; refi at stabilization.
Rent comps 4 comps
| Address | Beds | Baths | Sqft | Rent | $/sqft | DOM | Units | Dist |
|---|---|---|---|---|---|---|---|---|
| 1413 N 5th St Springfield, IL | 3.0 | 1.0 | 1200 | $1,200 | $1.00 | 22d | 1 | 0.62mi |
| 920 N 19th St Springfield, IL | 3.0 | 1.0 | 1000 | $1,100 | $1.10 | 22d | 1 | 0.72mi |
| 3501 E Ridgely Ave Unit FR21 Springfield, IL | 3.0 | 2.0 | 1216 | $1,129 | $0.93 | 22d | 1 | 0.76mi |
| 401 W Elliott Ave Unit A Springfield, IL | 3.0 | 1.0 | 1100 | $1,300 | $1.18 | 45d | 1 | 1.18mi |
Listing history 14 events
-
2026-06-22pricedays on market $179,500 Active 18 DOM
-
2026-06-19days on market $184,900 Active 16 DOM
-
2026-06-18days on market $184,900 Active 15 DOM
-
2026-06-17days on market $184,900 Active 14 DOM
-
2026-06-16days on market $184,900 Active 13 DOM
-
2026-06-15days on market $184,900 Active 12 DOM
-
2026-06-14days on market $184,900 Active 10 DOM
-
2026-06-13days on market $184,900 Active 9 DOM
-
2026-06-10days on market $184,900 Active 7 DOM
-
2026-06-09days on market $184,900 Active 6 DOM
-
2026-06-08days on market $184,900 Active 5 DOM
-
2026-06-07days on market $184,900 Active 4 DOM
-
2026-06-05remarks 664-char remark
-
2026-06-05$184,900 Active 1 DOM
ⓘ Source: listings_history table (triggers on properties + properties_extension) + one-shot
backfill from property_details.listing_events for pre-trigger history.
Climate risk First Street
- Flood 1/10 Low FEMA zone X (unshaded) · 0% chance over 30 yrs
- Wildfire 1/10 Low
- Heat 4/10 Moderate 7 d/yr ≥104°F today · 20 d/yr by 30 yrs out
- Wind 2/10 Low 100% chance of damaging wind over 30 yrs
- Air quality 2/10 Low 1 unhealthy d/yr today · 1 by 30 yrs out
Nearby sold comps map
Loading sold comps map…
Walkable amenities ~0.75 mi
Loading nearby amenities…
Taxation est. · year 1
- Rental income
- $25,212
- − Mortgage interest
- −$10,055
- − Property taxes
- −$2,692
- − Insurance
- −$898
- − Repairs & maintenance
- −$2,017
- − Management
- −$2,017
- − Depreciation
- −$5,222
- Taxable income
- $2,311
- Est. tax owed @ 24.0%
- −$555
- After-tax cash flow
- $4,477/yr
For passive investors: Depreciation is non-cash, so a rental often shows a tax loss while cash-flowing — sheltering income. Rental losses are passive: they offset passive income freely, and up to $25,000/yr can offset ordinary (W-2) income if you actively participate and your MAGI is under $100k (phasing out to $0 by $150k); unused losses carry forward. On sale, claimed depreciation is recaptured at up to 25%, and gains may owe capital-gains tax (a 1031 exchange can defer both). Figures are a year-1 estimate at your 24.0% rate — not tax advice; consult a CPA.
Condition & rehab AI · 13 photos
This move-in ready duplex is in good condition with fresh paint, new flooring, and updated kitchen finishes. It offers a great opportunity for investors and owner-occupants.
Value-add opportunities
- Both Painting the exterior and interior walls — Fresh paint can enhance the curb appeal and interior aesthetics, making the property more attractive to potential buyers and renters.
- Both Updating the kitchen backsplash — A fresh backsplash can modernize the kitchen and make it more appealing to potential buyers and renters.
- Both Upgrading the flooring — Upgrading the flooring can improve the overall look and feel of the home, making it more attractive to potential buyers and renters.
Renovation cost estimate screening
Value-add ROI direction
- Both Painting the exterior and interior walls — Fresh paint can enhance the curb appeal and interior aesthetics, making the property more attractive to potential buyers and renters. ↑
- Both Updating the kitchen backsplash — A fresh backsplash can modernize the kitchen and make it more appealing to potential buyers and renters. ↑
- Both Upgrading the flooring — Upgrading the flooring can improve the overall look and feel of the home, making it more attractive to potential buyers and renters. ↑
ⓘ Cost ranges are severity-bucket heuristics (US national rule-of-thumb). Get contractor quotes + a written scope before underwriting a rehab budget.
Schools (NCES district)
- District
- Springfield SD 186
- NCES district ID
- 1737080
- Math proficiency
- 17% ▼ -7.00%
- Reading proficiency
- 22% ▼ -5.00%
- Median HH income
- $43,744
- Composite
- 16.89/100
- National rank
- #9142
- State rank
- #438 of 620 in IL
Livability — Springfield
- Score
- 79/100
- State rank
- #122
- US rank
- #2138
Category grades
Schools grade is shown separately in the Schools card above.
Census & demographics
- Census place
- Springfield, IL
- County
- Sangamon County · 115,414 people
- City population
- 59,955
- Metro
- Springfield, IL
- Population (ZIP)
- 31,033
- Household income
- $51,136
- Rent vs Own
- Severe rent burden
- 1230.0
Population outlook (Sangamon County) Hauer SSP2
- Today (2025)
- 198,317 people
- By 2030
- 196,127 · -1.1%
- By 2040
- 188,664 · -4.9%
- By 2050
- 179,624 · -9.4%
- By 2075
- 155,027 · -21.8%
- By 2100
- 122,588 · -38.2%
Race, ethnicity, and origin ACS 2023
- Neighborhood character
- Predominantly White (72%)
- Race & ethnicity
- White 72% Black 17% Two or more races 8% Hispanic / Latino 3%
- Common ancestry
- Romanian 2% Slovak 2% Serbian 1%
- Foreign-born
- 2% · Canada
- Languages at home
- 96% English-only · Spanish 1% French/Haitian/Cajun 1% Other Indo-European 1%
Political lean MEDSL · Sangamon
- 2024 margin
- Toss-up / Even · D 46.6% · R 51.6% · Other 1.8%
- 2008→2024 swing
- -9.3pp toward R · 2008: 4.4pp · 2024: -5.0pp
- All cycles
- 2024: R+5.0 2020: R+4.4 2016: R+9.4 2012: R+8.7 2008: D+4.4
Not yet ingested
- Civics
- —
Market trends
- HPI YoY
- ▼ -79.98%
- Current HPI
- 149.1926
- Rent YoY
- ▲ 4.95%
- Metro
- Springfield, IL
- State GDP YoY
- ▲ 1.59%
- F500 in state
- 60
Industry mix (Fortune 500 HQ in IL)
| Industry | F500 HQs | Revenue |
|---|---|---|
| Insurance | 4 | $201B |
|
||
| Consumer Goods | 4 | $87B |
|
||
| Industrial Machinery | 3 | $64B |
|
||
| Healthcare | 2 | $55B |
|
||
| Retail / Pharmacy | 1 | $148B |
|
||
| Agriculture / Food | 1 | $86B |
|
||
Price history
1 event — show timeline
- 2026-06-03 Listed $184,900 RMLSA as Distributed by MLS Grid
Cash-flow waterfall
monthlySold comps — $/sqft
last 12 mo · ≤1 miLoading sold comps…