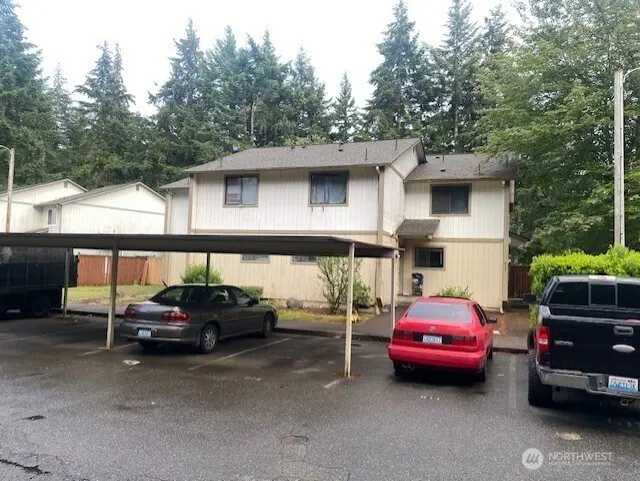
615 Firwood Ct · Shelton, WA
Flood risk 1/10 · Minimal
- FEMA flood zone
- X (unshaded)
- Chance of flooding over 30 yrs
- 0.0%
- Est. flood insurance / yr
- $507 – $1,088
Fire risk 3/10 · Minor
- Est. fire insurance / yr
- $604 – $1,122
Heat risk 3/10 · Minor
- Hot days now (above 88°F)
- 7 days/yr
- Hot days in 30 yrs
- 14 days/yr
Wind risk 1/10 · Minimal
- Chance of severe wind over 30 yrs
- —
Air-quality risk 7/10 · Major
- Unhealthy air days now
- 9 days/yr
- Unhealthy air days in 30 yrs
- 10 days/yr
Risk factors via First Street. Map © Google.
Why this score? — see what drove the C+ grade
The composite is a weighted blend of 9 inputs, each scored 0–100. Each bar is that input's sub-score; the figure is the points it added to the 100-point composite (weight × sub-score).
- Cash flow +25.7/30.0
- DSCR +8.5/10.0
- ARV discount +7.5/15.0
- 1% rule +6.5/10.0
- Livability +3.7/5.0
- Schools +3.4/10.0
- Rent growth +2.5/5.0
- Condition / age +2.5/5.0
- Appreciation +0.0/10.0
$140,000
🖨 Deal sheet (PDF) 📄 Offer letter ✓ Due diligence
Listing remarks
Instant Equity found here! Great affordable townhouse that is being sold in a present "AS-IS" condition. Great opportunity for 2 bedrooms & 1.5 bath home. Fully fenced in yard with storage room. Assigned 1 covered carport space. Cash out or Conventional Rehab loan only. Easy 25-minute commute to Olympia. Close to stores, restaurants and City services.
Key facts
- Storage room
- Close to restaurants
- Close to stores
Tags
Property features AI
Finance
- Other: Property condition listed as fair
- Financial info: Listing accepts Cash and Rehab Loan financing
- HOA & community: CC&Rs
Exterior
- Parking: 1 covered space; Detached carport (1 car); 2 uncovered parking spaces
- Security: Fully fenced
- Utilities: Electric service; Public water; Sewer connected
- Home design: Townhouse (single family residence style); Multi/split levels; Main entry level
- Construction: Wood construction; Composition roof; Poured concrete foundation; Built on lot
- Exterior features: Fully fenced yard; Wood exterior or wood products; Cable TV available; Paved site
Interior
- Kitchen: Refrigerator; Stove/Range
- Bedrooms: 2 bedrooms (both on upper level)
- Flooring: Laminate; Vinyl; Carpet
- Bathrooms: 1 full bath; 1 half bath; 1 bathtub; 1 shower; Main level has 1 half bath
- Heating & cooling: Baseboard heating; No central air
- Interior features: Dining room; Water heater
- Laundry & utility: Electric water heater
Neighborhood map
What this means for you Summary
Snapshot
- This is a 1-bed/1.0-bath townhouse listed at $140k.
Deal economics
- At list price, monthly cash flow is $334 ($4k/yr) — positive.
- The deal already cash-flows at list — no discount required.
- Meets the 1% rule at list price ($2k rent vs $140k).
- Cap rate 9.2% vs local median 3.1% in Shelton — top-decile yield for the area; either an underpriced asset or a hidden risk that comps aren't pricing in. Stress-test before assuming the spread holds.
Location & tenants
- Location reads 73/100 on livability (#203 in WA) — a middle-class / working-renter tenant base. Strengths: housing A+, health & safety A+, amenities A-; Watch: employment D+, crime F, commute F.
- Shelton School District (town): math 31% / reading 43% proficiency, ranked #237 of 291 in WA (top 81%) — families likely to look elsewhere, expect single-tenant / working-renter base with shorter leases.
- Zoned schools: Bordeaux Elementary School (504 students, 68% FRL); Shelton High School (1,473 students, 62% FRL).
- Market conditions: 439 active listings in the ZIP; 3 comparable units currently listed for rent nearby; rentals lingering (median 45d on market — plan ~5-8 weeks vacancy on turnover, expect pricing pressure); 67% of comp listings sitting > 30 days — soft ceiling on asking rent; solid renter incomes; 299 units permitted in Mason County in 2024 (0 in 5+ unit buildings).
Forward outlook
- Local home prices are declining (-3.0%/yr); year-one equity from $968 of loan paydown is wiped out by about $4k of value loss. Plan a longer hold.
- Mason County population projected at -14% by 2050 — secular population decline; favor cash flow + early exit over multi-decade hold.
Negotiation context
- Only 5 days on market — expect competitive offers; lowballing is unlikely to land.
- 2 sale attempts since 15y ago with the ask held roughly flat each time — persistent listings suggest the price (not the market) is what's stuck; bring a comps-based counter.
- Current owner paid $30k; list at $140k implies a 367% gain — meaningful room to come down on a strong offer.
Questions for the listing agent
- Is there a deadline driving the sale (1031 exchange, divorce, estate, relocation)? That informs how much negotiation room exists.
- Schools are D-rated, which usually means shorter tenancies and higher turnover. Who's the typical renter profile here, and what's been the actual vacancy rate?
- Crime grade is F in this area — have there been break-ins, vandalism, or insurance claims at this property in the last 3 years? What carrier currently insures it and at what premium?
- What's the average days-on-market for RENTAL listings here right now (not sales)? A rising rental-DOM trend means longer vacancies and softer asking-rent achievability than the comps imply.
- What's the recent tenant-quality profile in this submarket — average credit score on applications, eviction rate, late-payment / NSF rate, and stable-employment percentage? A property-management company in the area should have these aggregated.
- How much new for-sale + rental construction is in the pipeline within 1–3 miles? Heavy new supply typically softens prices + rents 12–24 months out; constrained supply supports both.
Investment metrics
- 1% rule
- 1.15% ✓
- Cap rate
- 9.15%
- Cash-on-cash
- 10.21%
- DSCR
- 1.45
- GRM
- 7.2
CMA / ARV
No comps found within radius.
Projected returns pro-forma
-3.0% appreciation · 3.0% rent growth · sell at horizon
- IRR
- -1.0%
- Equity multiple
- 0.96×
- Total profit
- $-1,427
- Equity at exit
- $20,874
- IRR
- 8.7%
- Equity multiple
- 1.67×
- Total profit
- $26,148
- Equity at exit
- $12,105
Cash invested: $39,200 (down + closing). Projections, not guarantees.
Landlord ↔ Tenant lean methodology
- Overall (STATE)
- 28 Tenant-Leaning
- State Washington
- 28 Tenant-Leaning · D+8
- County
- — inherits STATE
- City
- — inherits STATE
ZIP-level market 98584
- Active inventory
- 439
- Price-to-rent
- 7.2×
Monthly cashflow live
- Estimated rent
- $1,610 medium interval (Pro) →
- Mortgage (P&I)
- −$734
- Tax from tax record
- −$145 /mo · $1,744/yr
- Insurance
- −$58
- HOA
- −$0
- Vacancy / Maint / Mgmt
- −$338
- Net cashflow
- $334
Break-even live
Sensitivity live
| Price | -10% $413 | -5% $373 | +0% $334 | +5% $294 | +10% $254 |
|---|---|---|---|---|---|
| Rent | -10% $207 | -5% $270 | +0% $334 | +5% $397 | +10% $461 |
| Rate | -1.0pp $404 | -0.5pp $369 | base $334 | +0.5pp $297 | +1.0pp $261 |
UW: 25.0% down · 7.5% · 30yr · 1.5% tax · 5.0% vac · 8.0% maint · 8.0% mgmt
Financing live
Cash to close
- Down payment
- $35,000
- Closing costs
- $4,200
- Reserves months
- —
- Total cash needed
- —
Loan-product check · same deal, 3 products live
Conventional
25% down · 7.5% · 30yr
- Down + closing
- —
- Monthly P&I
- —
- Monthly cashflow
- —
- DSCR
- —
- Eligible?
- —
Personal DTI + credit; lowest rate.
DSCR
20% down · 8.5% · 30yr
- Down + closing
- —
- Monthly P&I
- —
- Monthly cashflow
- —
- DSCR
- —
- Eligible?
- —
No personal income docs; deal must DSCR.
Hard money
10% down · 12.0% · 12mo
- Down + closing
- —
- Monthly P&I
- —
- Monthly cashflow
- —
- DSCR
- —
- Eligible?
- —
Short-term bridge; refi at stabilization.
Rent comps 3 comps
| Address | Beds | Baths | Sqft | Rent | $/sqft | DOM | Units | Dist |
|---|---|---|---|---|---|---|---|---|
| 650 E Dearborn Ave Unit 2 Shelton, WA | 2.0 | 1.0 | 800 | $1,200 | $1.50 | 45d | 1 | 0.68mi |
| 101 W Railroad Ave Shelton, WA | — | 1.0 | 1450 | $2,838 | $1.96 | 45d | 5 | 0.93mi |
| 711 W Pine St Shelton, WA | 1.0 | 1.0 | 500 | $1,425 | $2.85 | 15d | 2 | 1.08mi |
Listing history 6 events
-
2026-06-17status $140,000 Pending 5 DOM
-
2026-06-17days on market $140,000 Active 5 DOM
-
2026-06-16days on market $140,000 Active 4 DOM
-
2026-06-15days on market $140,000 Active 3 DOM
-
2026-06-13remarks 355-char remark
-
2026-06-13$140,000 Active 1 DOM
ⓘ Source: listings_history table (triggers on properties + properties_extension) + one-shot
backfill from property_details.listing_events for pre-trigger history.
Tax reassessment forecast WA · Resets to sale price
- Current annual tax
- $1,744 · $145/mo
- Projected year-2 tax
- $1,744 · $145/mo
- Expected delta
- $0/yr ($0/mo · 0.0%)
ⓘ Screening estimate from a state-policy table — verify with the county assessor before closing.
Climate risk First Street
- Flood 1/10 Low FEMA zone X (unshaded) · 0% chance over 30 yrs
- Wildfire 3/10 Moderate
- Heat 3/10 Moderate 7 d/yr ≥88°F today · 14 d/yr by 30 yrs out
- Wind 1/10 Low
- Air quality 7/10 Severe 9 unhealthy d/yr today · 10 by 30 yrs out
Nearby sold comps map
Loading sold comps map…
Walkable amenities ~0.75 mi
Loading nearby amenities…
Taxation est. · year 1
- Rental income
- $19,314
- − Mortgage interest
- −$7,842
- − Property taxes
- −$1,744
- − Insurance
- −$700
- − Repairs & maintenance
- −$1,545
- − Management
- −$1,545
- − Depreciation
- −$4,073
- Taxable income
- $1,865
- Est. tax owed @ 24.0%
- −$448
- After-tax cash flow
- $3,557/yr
For passive investors: Depreciation is non-cash, so a rental often shows a tax loss while cash-flowing — sheltering income. Rental losses are passive: they offset passive income freely, and up to $25,000/yr can offset ordinary (W-2) income if you actively participate and your MAGI is under $100k (phasing out to $0 by $150k); unused losses carry forward. On sale, claimed depreciation is recaptured at up to 25%, and gains may owe capital-gains tax (a 1031 exchange can defer both). Figures are a year-1 estimate at your 24.0% rate — not tax advice; consult a CPA.
Schools (NCES district)
- District
- Shelton School District
- NCES district ID
- 5307900
- Math proficiency
- 31% ▼ -1.00%
- Reading proficiency
- 43% ▼ -3.00%
- Median HH income
- $45,467
- Composite
- 34.1/100
- National rank
- #10288
- State rank
- #237 of 291 in WA
Livability — Shelton
- Score
- 73/100
- State rank
- #203
- US rank
- #5586
Category grades
Schools grade is shown separately in the Schools card above.
Census & demographics
- Census place
- Shelton, WA
- County
- Mason County · 40,606 people
- City population
- 40,606
- Metro
- Shelton, WA
- Population (ZIP)
- 40,606
- Household income
- $78,610
- Rent vs Own
- Severe rent burden
- 687.0
Population outlook (Mason County) Hauer SSP2
- Today (2025)
- 60,005 people
- By 2030
- 58,567 · -2.4%
- By 2040
- 54,735 · -8.8%
- By 2050
- 51,470 · -14.2%
- By 2075
- 46,276 · -22.9%
- By 2100
- 39,883 · -33.5%
Race, ethnicity, and origin ACS 2023
- Neighborhood character
- Predominantly White (72%)
- Race & ethnicity
- White 72% Hispanic / Latino 15% Two or more races 11% Native American 3%
- Hispanic origin (detail)
- Mexican 8%
- Common ancestry
- Portuguese 4% Slovak 3% Italian 2%
- Foreign-born
- 8% · Canada
- Languages at home
- 88% English-only · Spanish 10%
Political lean MEDSL · Mason
- 2024 margin
- Toss-up / Even · D 47.2% · R 49.7% · Other 3.2%
- 2008→2024 swing
- -11.2pp toward R · 2008: 8.7pp · 2024: -2.5pp
- All cycles
- 2024: R+2.5 2020: R+3.9 2016: R+6.0 2012: D+6.9 2008: D+8.7
Not yet ingested
- Civics
- —
Market trends
- HPI YoY
- ▼ -232.42%
- Current HPI
- 199.0698
- Rent YoY
- —
- Metro
- Shelton, WA
- State GDP YoY
- ▲ 4.65%
- F500 in state
- 22
Industry mix (Fortune 500 HQ in WA)
| Industry | F500 HQs | Revenue |
|---|---|---|
| Retail | 2 | $269B |
|
||
| Technology / Retail | 1 | $638B |
|
||
| Technology | 1 | $245B |
|
||
| Telecommunications | 1 | $38B |
|
||
| Food / Beverage | 1 | $36B |
|
||
| Automotive / Trucks | 1 | $34B |
|
||
Price history
-85.8% since first listed8 events — show timeline
- 2026-06-12 Listed $140,000 NWMLS as Distributed by MLS Grid
- 2012-02-02 Sold (MLS) $30,000 NWMLS as Distributed by MLS Grid
- 2011-12-20 Pending — NWMLS as Distributed by MLS Grid
- 2011-12-01 Price Changed $34,900 NWMLS as Distributed by MLS Grid
- 2011-11-18 Price Changed $39,900 NWMLS as Distributed by MLS Grid
- 2011-11-12 Listed $45,000 NWMLS as Distributed by MLS Grid
- 2011-08-22 Sold (Public Records) $126,300 Public Records
- 2006-03-20 Sold (Public Records) $985,000 Public Records
Property tax history
+4.5%/yrLatest (2026): $1,744 · +3.1% YoY. Source: county tax records.
Cash-flow waterfall
monthlySold comps — $/sqft
last 12 mo · ≤1 miLoading sold comps…