84961 Old Hwy #7 · Islamorada, Village of Islands, FL
Flood risk No data
- FEMA flood zone
- —
- Chance of flooding over 30 yrs
- —
- Est. flood insurance / yr
- —
Fire risk No data
- Est. fire insurance / yr
- —
Heat risk No data
- Hot days now (above threshold)
- —
- Hot days in 30 yrs
- —
Wind risk No data
- Chance of severe wind over 30 yrs
- —
Air-quality risk No data
- Unhealthy air days now
- —
- Unhealthy air days in 30 yrs
- —
Risk factors via First Street. Map © Google.
Why this score? — see what drove the D grade
The composite is a weighted blend of 9 inputs, each scored 0–100. Each bar is that input's sub-score; the figure is the points it added to the 100-point composite (weight × sub-score).
- Appreciation +10.0/10.0
- Cash flow +7.7/30.0
- ARV discount +7.5/15.0
- Schools +4.6/10.0
- Rent growth +2.5/5.0
- Livability +2.5/5.0
- Condition / age +2.5/5.0
- 1% rule +1.8/10.0
- DSCR +1.8/10.0
$365,000
🖨 Deal sheet (PDF) 📄 Offer letter ✓ Due diligence
Listing remarks
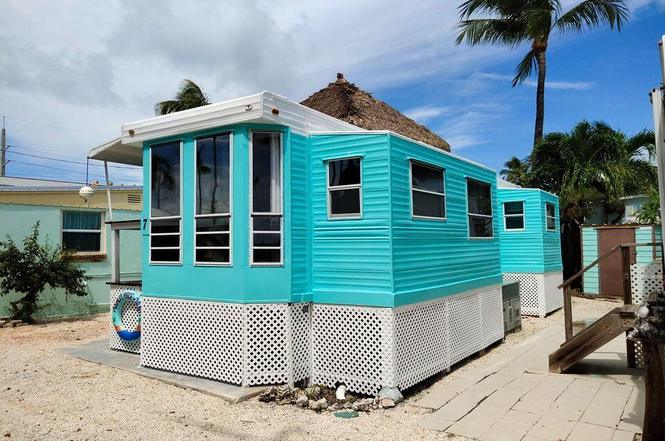
Bring your toothbrush, everything else you need is included in this move-in ready property where you OWN THE LAND. Rent it, vacation or live here in the heart of Islamorada. This fully renovated unit has TWO PARKING SPOTS, patio and spacious storage shed. The top to bottom renovation includes a liquid silicone coating on the roof, new paint in and out, all new plumbing from the water meter to all new faucets. New drain pipes throughout direct to the street. Electric includes all new switches and receptacles, new 220v service for the dryer and AC. New manufactured floor coverings over new sub-floors throughout, and new joists in the slide outs. The entire unit has 4' of spray foam insulation
Key facts
- New plumbing
- New drain pipes
- Storage shed
Tags
Property features AI
Finance
- Other: 48 total units in the community; Pets allowed with restrictions (2 pets); Rentals allowed with restrictions; Property in flood zone AE; Zoned MH - Mobile Home Park; Lot size less than 1/4 acre (approximately 0.03 acres)
- HOA & community: Mandatory homeowners association; Monthly association fee of $149; Fee includes common area maintenance; Association does not have first right of refusal
Exterior
- Parking: Open parking for 2 vehicles
- Security: No security
- Utilities: FKAA water; Municipal sewer; Public sewer hookup
- Home design: Manufactured property; Ocean side; Located near Mile Marker 85
- Construction: Manufactured construction; Other roof
- Exterior features: Shed; Storage; Community boat ramp; Other area features
Interior
- Kitchen: Microwave; Refrigerator
- Bathrooms: 1 full bathroom
- Heating & cooling: Central A/C
- Interior features: Central A/C; Furnished
- Laundry & utility: Washer; Dryer
Neighborhood map
What this means for you Summary
Snapshot
- This is a 1-bed/1.0-bath manufactured listed at $365k.
Deal economics
- At list price, monthly cash flow is $-419 ($-5k/yr) — negative.
- To cash-flow at today's rent, offer at most $291k (20.3% below list).
- To meet the 1% rule (rent ≥ 1% of price), the offer needs to be $250k (31.5% below list).
- Recommended offer: $250k (31.5% below list) — sets the bar for 1% rule.
- Cap rate 4.9% vs local median 0.3% in Islamorada, Village of Islands — top-decile yield for the area; either an underpriced asset or a hidden risk that comps aren't pricing in. Stress-test before assuming the spread holds.
Location & tenants
- Location reads: area grade D — affects rentability + tenant quality, not the cash-flow math above.
- Monroe (town): math 50% / reading 55% proficiency, ranked #23 of 73 in FL (top 32%) — acceptable for families but not a draw, mixed tenant base, ~2y average lease.
- Market conditions: 153 active listings in the ZIP; solid renter incomes; 332 units permitted in Monroe County in 2024 (42 in 5+ unit buildings).
- This rent runs 35% of the median local income ($86k/yr) — at the standard rent-burdened threshold; future hikes will face affordability resistance.
Forward outlook
- In year one you build about $39k of equity ($3k loan paydown + $36k appreciation (10.0% local appreciation)).
- Monroe County population projected at +28% by 2050 — long-run rental-demand tailwind backs the buy-and-hold thesis.
- By year 2, paydown + projected appreciation supports a ~$63k cash-out refi (75% LTV) — recoverable capital for the next deal without selling this one.
Negotiation context
- It's been on market 126 days — a 12% lower offer ($321k) is reasonable based on typical stale-listing flexibility.
- Current owner paid $154k; list at $365k implies a 137% gain — meaningful room to come down on a strong offer.
Questions for the listing agent
- What do current leases actually rent for vs. the listed asking? Can we see a recent rent roll and the last 12 months of T-12 income?
- It's been on market 126 days. Have you received any prior offers? Is the seller open to a 32% concession, seller financing, or rate buy-down credit?
- What does the HOA fee cover, when was the last increase, and are there any pending special assessments or reserve-fund shortfalls?
- Why hasn't it sold? Are there any deal-killer items the seller is aware of (foundation, flood, title, zoning, code violations)?
- Is there a deadline driving the sale (1031 exchange, divorce, estate, relocation)? That informs how much negotiation room exists.
- The area grade is low — what's the realistic commute time and amenity access for the typical tenant pool here? Any planned neighborhood developments (good or bad) we should know about?
- What's the average days-on-market for RENTAL listings here right now (not sales)? A rising rental-DOM trend means longer vacancies and softer asking-rent achievability than the comps imply.
- What's the recent tenant-quality profile in this submarket — average credit score on applications, eviction rate, late-payment / NSF rate, and stable-employment percentage? A property-management company in the area should have these aggregated.
- How much new for-sale + rental construction is in the pipeline within 1–3 miles? Heavy new supply typically softens prices + rents 12–24 months out; constrained supply supports both.
Investment metrics
- 1% rule
- 0.68% ✗
- Cap rate
- 4.91%
- Cash-on-cash
- -4.92%
- DSCR
- 0.78
- GRM
- 12.2
CMA / ARV
- ARV (on-the-fly)
- $365,200
- Comps found
- 1
Show comp detail 1 sale within ~0.75 mi
| Address | Dist | Beds/Ba | Sqft | Sold | Price | $/sf | Match |
|---|---|---|---|---|---|---|---|
| 84961 Old Hwy #9 | 0.00mi | 2/2.0 (+1) | 400 (0%) | 16mo | $365,000 | $913 | 77 |
Match score weights: distance 35% · size 25% · config 20% · recency 20%. Top-matched comps best support the ARV.
Projected returns pro-forma
10.0% appreciation · 3.0% rent growth · sell at horizon
- IRR
- 20.8%
- Equity multiple
- 2.68×
- Total profit
- $172,049
- Equity at exit
- $328,821
- IRR
- 18.9%
- Equity multiple
- 6.16×
- Total profit
- $527,567
- Equity at exit
- $709,115
Cash invested: $102,200 (down + closing). Projections, not guarantees.
Landlord ↔ Tenant lean methodology
- Overall (STATE)
- 87 Strongly Landlord-Friendly
- State Florida
- 87 Strongly Landlord-Friendly · R+3
- County
- — inherits STATE
- City
- — inherits STATE
ZIP-level market 33036
- Home prices YoY
- 34.3%
- Active inventory
- 153
- Price-to-rent
- 12.2×
Monthly cashflow live
- Estimated rent
- $2,499 medium interval (Pro) →
- Mortgage (P&I)
- −$1,914
- Tax from tax record
- −$178 /mo · $2,136/yr
- Insurance
- −$152
- HOA
- −$149
- Vacancy / Maint / Mgmt
- −$525
- Net cashflow
- $-419
Break-even live
Sensitivity live
| Price | -10% $-213 | -5% $-316 | +0% $-419 | +5% $-522 | +10% $-626 |
|---|---|---|---|---|---|
| Rent | -10% $-617 | -5% $-518 | +0% $-419 | +5% $-320 | +10% $-222 |
| Rate | -1.0pp $-235 | -0.5pp $-326 | base $-419 | +0.5pp $-514 | +1.0pp $-610 |
UW: 25.0% down · 7.5% · 30yr · 1.5% tax · 5.0% vac · 8.0% maint · 8.0% mgmt
Financing live
Cash to close
- Down payment
- $91,250
- Closing costs
- $10,950
- Reserves months
- —
- Total cash needed
- —
Loan-product check · same deal, 3 products live
Conventional
25% down · 7.5% · 30yr
- Down + closing
- —
- Monthly P&I
- —
- Monthly cashflow
- —
- DSCR
- —
- Eligible?
- —
Personal DTI + credit; lowest rate.
DSCR
20% down · 8.5% · 30yr
- Down + closing
- —
- Monthly P&I
- —
- Monthly cashflow
- —
- DSCR
- —
- Eligible?
- —
No personal income docs; deal must DSCR.
Hard money
10% down · 12.0% · 12mo
- Down + closing
- —
- Monthly P&I
- —
- Monthly cashflow
- —
- DSCR
- —
- Eligible?
- —
Short-term bridge; refi at stabilization.
HOA detail
- Monthly dues
- $149 · $1,788/yr
- Likely covers
- waterelectric
Listing history 19 events
-
2026-06-19days on market $365,000 Active 126 DOM
-
2026-06-18days on market $365,000 Active 125 DOM
-
2026-06-17days on market $365,000 Active 124 DOM
-
2026-06-16days on market $365,000 Active 123 DOM
-
2026-06-15days on market $365,000 Active 122 DOM
-
2026-06-14days on market $365,000 Active 120 DOM
-
2026-06-13days on market $365,000 Active 119 DOM
-
2026-06-10days on market $365,000 Active 117 DOM
-
2026-06-09days on market $365,000 Active 116 DOM
-
2026-06-08days on market $365,000 Active 115 DOM
-
2026-06-07days on market $365,000 Active 114 DOM
-
2026-06-05days on market $365,000 Active 111 DOM
-
2026-06-03days on market $365,000 Active 110 DOM
-
2026-06-02days on market $365,000 Active 109 DOM
-
2026-06-01days on market $365,000 Active 108 DOM
-
2026-05-31days on market $365,000 Active 107 DOM
-
2026-05-30days on market $365,000 Active 106 DOM
-
2026-02-13$365,000 Active
-
2007-09-18soldstatus $154,000
ⓘ Source: listings_history table (triggers on properties + properties_extension) + one-shot
backfill from property_details.listing_events for pre-trigger history.
Tax reassessment forecast FL · Resets to sale price
- Current annual tax
- $2,136 · $178/mo
- Projected year-2 tax
- $3,030 · $252/mo
- Expected delta
- +$894/yr (+$74/mo · 41.8%)
ⓘ Screening estimate from a state-policy table — verify with the county assessor before closing.
Nearby sold comps map
Loading sold comps map…
Walkable amenities ~0.75 mi
Loading nearby amenities…
Taxation est. · year 1
- Rental income
- $29,985
- − Mortgage interest
- −$20,446
- − Property taxes
- −$2,136
- − Insurance
- −$1,825
- − Repairs & maintenance
- −$2,399
- − Management
- −$2,399
- − HOA
- −$1,788
- − Depreciation
- −$10,618
- Taxable loss
- −$11,626
- Est. tax savings @ 24.0%
- +$2,790
- After-tax cash flow
- $-2,240/yr
For passive investors: Depreciation is non-cash, so a rental often shows a tax loss while cash-flowing — sheltering income. Rental losses are passive: they offset passive income freely, and up to $25,000/yr can offset ordinary (W-2) income if you actively participate and your MAGI is under $100k (phasing out to $0 by $150k); unused losses carry forward. On sale, claimed depreciation is recaptured at up to 25%, and gains may owe capital-gains tax (a 1031 exchange can defer both). Figures are a year-1 estimate at your 24.0% rate — not tax advice; consult a CPA.
Schools (NCES district)
- District
- Monroe
- NCES district ID
- 1201320
- Math proficiency
- 50% ▼ -14.00%
- Reading proficiency
- 55% ▼ -6.00%
- Median HH income
- $56,955
- Composite
- 45.51/100
- National rank
- #2608
- State rank
- #23 of 73 in FL
Livability — Islamorada, Village of Islands
No livability data for this city. (Only ~50 U.S. cities are tracked.)
Census & demographics
- Census place
- Islamorada, Village of Islands, FL
- County
- Monroe County · 66,185 people
- Metro
- Key West, FL
- Population (ZIP)
- 3,777
- Household income
- $86,032
- Rent vs Own
- Severe rent burden
- 68.0
Population outlook (Monroe County) Hauer SSP2
- Today (2025)
- 90,706 people
- By 2030
- 96,308 · +6.2%
- By 2040
- 106,565 · +17.5%
- By 2050
- 116,500 · +28.4%
- By 2075
- 141,423 · +55.9%
- By 2100
- 151,947 · +67.5%
Race, ethnicity, and origin ACS 2023
- Neighborhood character
- Predominantly White (77%)
- Race & ethnicity
- White 77% Hispanic / Latino 17% Two or more races 9% Asian 1%
- Hispanic origin (detail)
- Mexican 1% Puerto Rican 2% Cuban 10%
- Common ancestry
- Lithuanian 2% Subsaharan African 2% Slovak 1%
- Foreign-born
- 17% · Canada
- Languages at home
- 77% English-only · Spanish 16% Russian/Polish/Slavic 4% Other Indo-European 3%
Political lean MEDSL · Monroe
- 2024 margin
- R (+18.3) · D 40.5% · R 58.8%
- 2008→2024 swing
- -23.2pp toward R · 2008: 4.9pp · 2024: -18.3pp
- All cycles
- 2024: R+18.3 2020: R+7.9 2016: R+6.9 2012: D+0.4 2008: D+4.9
Not yet ingested
- Civics
- —
Market trends
- HPI YoY
- ▲ 161.75%
- Current HPI
- 632.97
- Rent YoY
- —
- Metro
- Key West, FL
- State GDP YoY
- ▲ 3.28%
- F500 in state
- 36
Industry mix (Fortune 500 HQ in FL)
| Industry | F500 HQs | Revenue |
|---|---|---|
| Industrial Technology | 2 | $29B |
|
||
| Insurance | 2 | $17B |
|
||
| Retail | 1 | $60B |
|
||
| Technology Distribution | 1 | $58B |
|
||
| Homebuilding | 1 | $35B |
|
||
| Technology Manufacturing | 1 | $35B |
|
||
Price history
+137.0% since first listed2 events — show timeline
- 2026-02-13 Listed $365,000 FLKMLS
- 2007-09-18 Sold (Public Records) $154,000 Public Records
Property tax history
+5.6%/yrLatest (2025): $2,136 · +6.8% YoY. Source: county tax records.
Cash-flow waterfall
monthlySold comps — $/sqft
last 12 mo · ≤1 miLoading sold comps…