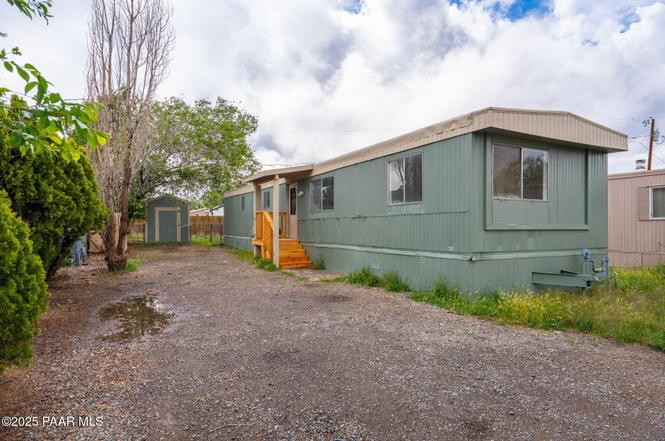
4420 E Katie Cir · Prescott Valley, AZ
Flood risk 1/10 · Minimal
- FEMA flood zone
- X (unshaded)
- Chance of flooding over 30 yrs
- 0.0%
- Est. flood insurance / yr
- $507 – $1,088
Fire risk 5/10 · Moderate
- Est. fire insurance / yr
- $610 – $1,132
Heat risk 4/10 · Minor
- Hot days now (above 94°F)
- 5 days/yr
- Hot days in 30 yrs
- 13 days/yr
Wind risk 1/10 · Minimal
- Chance of severe wind over 30 yrs
- —
Air-quality risk 1/10 · Minimal
- Unhealthy air days now
- 0 days/yr
- Unhealthy air days in 30 yrs
- 0 days/yr
Risk factors via First Street. Map © Google.
Why this score? — see what drove the C grade
The composite is a weighted blend of 9 inputs, each scored 0–100. Each bar is that input's sub-score; the figure is the points it added to the 100-point composite (weight × sub-score).
- Cash flow +20.8/30.0
- ARV discount +15.0/15.0
- DSCR +6.6/10.0
- 1% rule +5.5/10.0
- Livability +3.1/5.0
- Schools +2.9/10.0
- Rent growth +2.7/5.0
- Condition / age +2.5/5.0
- Appreciation +0.0/10.0
$150,000
🖨 Deal sheet (PDF) 📄 Offer letter ✓ Due diligence
Listing remarks
Charming and cozy manufactured home in Prescott Valley! Schedule your viewing today for this beautifully updated home that offers a fresh start with all new features such as a brand new roof, fresh paint, new flooring throughout, upgraded appliances, and stunning quartz countertops. With a blank slate interior, this home is ready for you to make it your own! Whether you're a first time buyer, downsizing, or looking for a great investment, this property is a fantastic opportunity in a desirable location.
Key facts
- Quartz countertops
- Fresh paint
- New flooring
Tags
Neighborhood map
What this means for you Summary
Snapshot
- This is a 2-bed/2.0-bath manufactured listed at $150k.
Deal economics
- At list price, monthly cash flow is $207 ($2k/yr) — positive.
- The deal already cash-flows at list — no discount required.
- Meets the 1% rule at list price ($2k rent vs $150k).
- Recommended offer: $141k (6.0% below list) — sets the bar for market timing.
- Cap rate 7.9% vs local median 3.1% in Prescott Valley — top-decile yield for the area; either an underpriced asset or a hidden risk that comps aren't pricing in. Stress-test before assuming the spread holds.
Location & tenants
- Location reads 62/100 on livability (#126 in AZ) — a middle-class / working-renter tenant base. Strengths: housing A+, crime A-; Watch: amenities F, commute F, health & safety F.
- Humboldt Unified District (4469) (suburban): math 31% / reading 37% proficiency, ranked #94 of 249 in AZ (top 38%) — families likely to look elsewhere, expect single-tenant / working-renter base with shorter leases.
- Zoned schools: Liberty Traditional School (math 56% / reading 53%, grade C, #208 of 1,109 statewide, top 19%, 785 students, 39% FRL); Bradshaw Mountain Middle School (math 24% / reading 39%, grade F, #78 of 218 statewide, top 36%, 280 students, 55% FRL); Bradshaw Mountain High School (math 15% / reading 26%, grade F, #222 of 381 statewide, top 59%, 1,697 students, 43% FRL) — zoned schools at 45% FRL track the district average.
- Market conditions: Rents flat; 455 active listings in the ZIP; 32 comparable units currently listed for rent nearby; rentals at typical pace (median 23d on market — plan ~3-4 weeks tenant-placement turnaround); 2,062 units permitted in Yavapai County in 2024 (98 in 5+ unit buildings).
Forward outlook
- Local home prices are declining (-3.0%/yr); year-one equity from $1k of loan paydown is wiped out by about $4k of value loss. Plan a longer hold.
- Yavapai County population projected at +10% by 2050 — modest demand growth; plan on rents tracking national, not racing it.
Negotiation context
- It's been on market 70 days — a 6% lower offer ($141k) is reasonable based on typical stale-listing flexibility.
- 5 sale attempts; this cycle's ask has dropped $15k (9%) from the opening price — seller is motivated, your offer sets the floor, not the list.
Risks & watch-outs
- Climate carrying-cost: moderate wildfire risk — expect insurance premiums to compound above CPI over the hold.
Questions for the listing agent
- It's been on market 70 days. Have you received any prior offers? Is the seller open to a 6% concession, seller financing, or rate buy-down credit?
- Built in 1979 — when were the roof, HVAC, electrical panel, plumbing, and water heater last replaced?
- Why hasn't it sold? Are there any deal-killer items the seller is aware of (foundation, flood, title, zoning, code violations)?
- Is there a deadline driving the sale (1031 exchange, divorce, estate, relocation)? That informs how much negotiation room exists.
- What's the average days-on-market for RENTAL listings here right now (not sales)? A rising rental-DOM trend means longer vacancies and softer asking-rent achievability than the comps imply.
- What's the recent tenant-quality profile in this submarket — average credit score on applications, eviction rate, late-payment / NSF rate, and stable-employment percentage? A property-management company in the area should have these aggregated.
- How much new for-sale + rental construction is in the pipeline within 1–3 miles? Heavy new supply typically softens prices + rents 12–24 months out; constrained supply supports both.
Investment metrics
- 1% rule
- 1.05% ✓
- Cap rate
- 7.95%
- Cash-on-cash
- 5.92%
- DSCR
- 1.26
- GRM
- 7.9
CMA / ARV
- ARV (on-the-fly)
- $194,880
- Comps found
- 7
Show comp detail 7 sales within ~0.75 mi
| Address | Dist | Beds/Ba | Sqft | Sold | Price | $/sf | Match |
|---|---|---|---|---|---|---|---|
| 4361 N Mobile Cir E | 0.10mi | 3/1.0 (+1) | 897 (+7%) | 9mo | $106,500 | $119 | 68 |
| 4501 N Parent Rd | 0.12mi | 3/2.0 (+1) | 897 (+7%) | 16mo | $250,000 | $279 | 65 |
| 8875 E Cheryl Dr | 0.44mi | 2/1.5 | 799 (-5%) | 18mo | $185,000 | $232 | 54 |
| 4400 N Ranger Rd | 0.22mi | 2/2.0 | 721 (-14%) | 19mo | $135,100 | $187 | 50 |
| 8801 E Totem Cir | 0.64mi | 2/3.0 | 891 (+6%) | 13mo | $40,000 | $45 | 45 |
| 4886 N Meixner Rd | 0.48mi | 2/2.0 | 960 (+14%) | 20mo | $315,000 | $328 | 37 |
| 8835 Blackfoot Cir | 0.69mi | 3/2.0 (+1) | 960 (+14%) | 18mo | $255,000 | $266 | 23 |
Match score weights: distance 35% · size 25% · config 20% · recency 20%. Top-matched comps best support the ARV.
Projected returns pro-forma
-3.0% appreciation · 0.97% rent growth · sell at horizon
- IRR
- -9.5%
- Equity multiple
- 0.66×
- Total profit
- $-14,244
- Equity at exit
- $22,365
- IRR
- -3.0%
- Equity multiple
- 0.82×
- Total profit
- $-7,739
- Equity at exit
- $12,969
Cash invested: $42,000 (down + closing). Projections, not guarantees.
Landlord ↔ Tenant lean methodology
- Overall (STATE)
- 87 Strongly Landlord-Friendly
- State Arizona
- 87 Strongly Landlord-Friendly · R+3
- County
- — inherits STATE
- City
- — inherits STATE
ZIP-level market 86314
- Home prices YoY
- -32.3%
- Rents YoY
- 1.0%
- Active inventory
- 455
- Price-to-rent
- 7.9×
Monthly cashflow live
- Estimated rent
- $1,574 high interval (Pro) →
- Mortgage (P&I)
- −$787
- Tax est. 1.5%
- −$188 /mo · $2,250/yr
- Insurance
- −$62
- HOA
- −$0
- Vacancy / Maint / Mgmt
- −$331
- Net cashflow
- $207
Break-even live
Sensitivity live
| Price | -10% $311 | -5% $259 | +0% $207 | +5% $155 | +10% $103 |
|---|---|---|---|---|---|
| Rent | -10% $83 | -5% $145 | +0% $207 | +5% $269 | +10% $331 |
| Rate | -1.0pp $283 | -0.5pp $245 | base $207 | +0.5pp $168 | +1.0pp $129 |
UW: 25.0% down · 7.5% · 30yr · 1.5% tax · 5.0% vac · 8.0% maint · 8.0% mgmt
Financing live
Cash to close
- Down payment
- $37,500
- Closing costs
- $4,500
- Reserves months
- —
- Total cash needed
- —
Loan-product check · same deal, 3 products live
Conventional
25% down · 7.5% · 30yr
- Down + closing
- —
- Monthly P&I
- —
- Monthly cashflow
- —
- DSCR
- —
- Eligible?
- —
Personal DTI + credit; lowest rate.
DSCR
20% down · 8.5% · 30yr
- Down + closing
- —
- Monthly P&I
- —
- Monthly cashflow
- —
- DSCR
- —
- Eligible?
- —
No personal income docs; deal must DSCR.
Hard money
10% down · 12.0% · 12mo
- Down + closing
- —
- Monthly P&I
- —
- Monthly cashflow
- —
- DSCR
- —
- Eligible?
- —
Short-term bridge; refi at stabilization.
Rent comps 32 comps
| Address | Beds | Baths | Sqft | Rent | $/sqft | DOM | Units | Dist |
|---|---|---|---|---|---|---|---|---|
| 4340 N Romero Cir E Prescott Valley, AZ | 2.0 | 2.0 | 785 | $1,300 | $1.66 | 22d | 1 | 0.11mi |
| 4500 N Carla Vista Dr Prescott Valley, AZ | 3.0 | 1.0 | 1056 | $1,550 | $1.47 | 45d | 1 | 0.27mi |
| 4561 N Preston Dr Apt 3 Prescott Valley, AZ | 1.0 | 1.0 | 624 | $1,700 | $2.72 | 45d | 1 | 0.35mi |
| 4561 N Preston Dr Prescott Valley, AZ | 1.0 | 1.0 | 624 | $1,650 | $2.64 | 45d | 1 | 0.35mi |
| 4400 N Phillip Dr Unit B Prescott Valley, AZ | 2.0 | 2.0 | 999 | $1,550 | $1.55 | 45d | 1 | 0.48mi |
| 4713 N Harlequin Dr Prescott Valley, AZ | 2.0 | 1.0 | 911 | $1,375 | $1.51 | 22d | 1 | 0.51mi |
| 4621 N Ocotillo Dr Prescott Valley, AZ | 2.0 | 2.0 | 992 | $1,875 | $1.89 | 15d | 1 | 0.53mi |
| 4786 N Jean Ct Apt 01 Prescott Valley, AZ | 2.0 | 1.0 | 758 | $1,150 | $1.52 | 22d | 1 | 0.64mi |
| 3866 E Teri Ct Unit A Prescott Valley, AZ | 3.0 | 2.0 | 1050 | $1,675 | $1.60 | 15d | 1 | 0.65mi |
| 4357 N Miner Rd Prescott Valley, AZ | 2.0 | 2.0 | 960 | $1,600 | $1.67 | 45d | 1 | 0.68mi |
| 8396 E Stevens Dr Unit A Prescott Valley, AZ | 2.0 | 2.0 | 950 | $2,000 | $2.11 | 45d | 1 | 0.69mi |
| 8396 E Stevens Dr Unit B Prescott Valley, AZ | 2.0 | 2.0 | 978 | $2,000 | $2.04 | 45d | 1 | 0.69mi |
| 8135 E Ashley Dr Apt A Prescott Valley, AZ | 2.0 | 2.0 | 990 | $1,500 | $1.52 | 45d | 1 | 0.75mi |
| 7939 Spouse Dr Apt 1 Prescott Valley, AZ | 2.0 | 1.5 | 1100 | $1,500 | $1.36 | 22d | 1 | 0.81mi |
| 7781 Spouse Dr Unit A Prescott Valley, AZ | 2.0 | 1.0 | 912 | $1,350 | $1.48 | 22d | 1 | 0.92mi |
| 8132 E Lakeshore Dr Unit B Prescott Valley, AZ | 2.0 | 2.0 | 890 | $1,400 | $1.57 | 45d | 1 | 0.96mi |
| 7749 E Spouse Dr Prescott Valley, AZ | 2.0 | 1.0 | 860 | $1,550 | $1.80 | 22d | 1 | 0.96mi |
| 9665 E Magma Dr Unit A Prescott Valley, AZ | 2.0 | 2.0 | 1000 | $1,700 | $1.70 | 22d | 1 | 0.98mi |
| 3279 N Corrine Dr Unit A Prescott Valley, AZ | 2.0 | 1.0 | 738 | $1,400 | $1.90 | 45d | 1 | 1.15mi |
| 3290 N Bumblebee Dr Unit A Prescott Valley, AZ | 2.0 | 2.0 | 1050 | $1,550 | $1.48 | 15d | 1 | 1.16mi |
| 9800 E Lakeshore Dr Unit A Prescott Valley, AZ | 2.0 | 2.0 | 1116 | $1,595 | $1.43 | 15d | 1 | 1.16mi |
| 3830 N Windsong Dr Prescott Valley, AZ | 1.0–3.0 | 1.0–2.0 | 1097 | $2,034 | $1.85 | 15d | 22 | 1.18mi |
| 3231 N Corrine Dr Unit B Prescott Valley, AZ | 2.0 | 2.0 | 948 | $1,500 | $1.58 | 45d | 1 | 1.19mi |
| 3184 N Truwood Dr Unit D Prescott Valley, AZ | 2.0 | 1.0 | 600 | $1,100 | $1.83 | 22d | 1 | 1.23mi |
| 8683 E Commons Cir Prescott Valley, AZ | 1.0–2.0 | 1.0–2.0 | 834 | $1,785 | $2.14 | 15d | 5 | 1.27mi |
| 7431 E Lobo Way Unit A Prescott Valley, AZ | 2.0 | 1.0 | 785 | $1,650 | $2.10 | 15d | 1 | 1.28mi |
| 3148 N Navajo Dr Unit C Prescott Valley, AZ | 2.0 | 1.5 | 1024 | $1,425 | $1.39 | 22d | 1 | 1.30mi |
| 3123 N Corrine Dr Apt B Prescott Valley, AZ | 2.0 | 2.0 | 1111 | $1,595 | $1.44 | 45d | 1 | 1.30mi |
| 8113 E Long Mesa Dr Unit A Prescott Valley, AZ | 1.0 | 1.0 | 616 | $1,500 | $2.44 | 22d | 1 | 1.37mi |
| 3028 N Corrine Dr Unit A Prescott Valley, AZ | 2.0 | 1.0 | 889 | $1,600 | $1.80 | 22d | 1 | 1.39mi |
| 3230 N Victor Rd Unit C Prescott Valley, AZ | 2.0 | 1.0 | 850 | $1,350 | $1.59 | 15d | 1 | 1.40mi |
| 7267 Spouse Dr Unit C Prescott Valley, AZ | 2.0 | 1.0 | 864 | $1,295 | $1.50 | 15d | 1 | 1.46mi |
Listing history 19 events
-
2026-04-10status Pending
-
2026-03-10status Active
-
2026-03-03status Pending
-
2026-02-27price $150,000
-
2026-01-23$165,000 Active
-
2025-11-20price $150,000
-
2025-10-31price $160,000
-
2025-10-22status Active
-
2025-10-22price $199,000
-
2025-10-22historical
-
2025-10-10status Pending
-
2025-09-26status Active
-
2025-09-05status Pending
-
2025-08-16price $170,000
-
2025-06-18price $175,000
-
2025-05-15price $185,000
-
2025-05-08$199,000 Active
-
2022-02-22soldstatus $390,000
-
2005-08-05soldstatus $120,000
ⓘ Source: listings_history table (triggers on properties + properties_extension) + one-shot
backfill from property_details.listing_events for pre-trigger history.
Climate risk First Street
- Flood 1/10 Low FEMA zone X (unshaded) · 0% chance over 30 yrs
- Wildfire 5/10 Major
- Heat 4/10 Moderate 5 d/yr ≥94°F today · 13 d/yr by 30 yrs out
- Wind 1/10 Low
- Air quality 1/10 Low 0 unhealthy d/yr today · 0 by 30 yrs out
Nearby sold comps map
Loading sold comps map…
Walkable amenities ~0.75 mi
Loading nearby amenities…
Taxation est. · year 1
- Rental income
- $18,892
- − Mortgage interest
- −$8,402
- − Property taxes
- −$2,250
- − Insurance
- −$750
- − Repairs & maintenance
- −$1,511
- − Management
- −$1,511
- − Depreciation
- −$4,364
- Taxable income
- $103
- Est. tax owed @ 24.0%
- −$25
- After-tax cash flow
- $2,460/yr
For passive investors: Depreciation is non-cash, so a rental often shows a tax loss while cash-flowing — sheltering income. Rental losses are passive: they offset passive income freely, and up to $25,000/yr can offset ordinary (W-2) income if you actively participate and your MAGI is under $100k (phasing out to $0 by $150k); unused losses carry forward. On sale, claimed depreciation is recaptured at up to 25%, and gains may owe capital-gains tax (a 1031 exchange can defer both). Figures are a year-1 estimate at your 24.0% rate — not tax advice; consult a CPA.
Schools (NCES district)
- District
- Humboldt Unified District (4469)
- NCES district ID
- 0403870
- Math proficiency
- 31% ▼ -13.00%
- Reading proficiency
- 37% ▼ -14.00%
- Median HH income
- $45,326
- Composite
- 29.06/100
- National rank
- #6605
- State rank
- #94 of 249 in AZ
Livability — Prescott Valley
- Score
- 62/100
- State rank
- #126
- US rank
- #16160
Category grades
Schools grade is shown separately in the Schools card above.
Census & demographics
- Census place
- Prescott Valley, AZ
- County
- Yavapai County · 190,406 people
- City population
- 63,155
- Metro
- Prescott Valley-Prescott, AZ
- Population (ZIP)
- 40,317
- Household income
- $69,208
- Rent vs Own
- Severe rent burden
- 1236.0
Population outlook (Yavapai County) Hauer SSP2
- Today (2025)
- 241,389 people
- By 2030
- 249,523 · +3.4%
- By 2040
- 259,966 · +7.7%
- By 2050
- 264,736 · +9.7%
- By 2075
- 269,334 · +11.6%
- By 2100
- 256,505 · +6.3%
Race, ethnicity, and origin ACS 2023
- Neighborhood character
- Predominantly White (71%)
- Race & ethnicity
- White 71% Hispanic / Latino 22% Two or more races 15% Asian 1% Native American 1%
- Hispanic origin (detail)
- Mexican 20%
- Common ancestry
- Slovak 4% Lithuanian 3% Romanian 3%
- Foreign-born
- 8% · Canada
- Languages at home
- 83% English-only · Spanish 15%
Political lean MEDSL · Yavapai
- 2024 margin
- Solid R (+33.9) · D 32.6% · R 66.5%
- 2008→2024 swing
- -9.5pp toward R · 2008: -24.4pp · 2024: -33.9pp
- All cycles
- 2024: R+33.9 2020: R+29.3 2016: R+31.4 2012: R+30.7 2008: R+24.4
Not yet ingested
- Civics
- —
Market trends
- HPI YoY
- ▼ -176.27%
- Current HPI
- 370.04
- Rent YoY
- ▲ 0.97%
- Metro
- Prescott Valley-Prescott, AZ
- State GDP YoY
- ▲ 4.54%
- F500 in state
- 20
Industry mix (Fortune 500 HQ in AZ)
| Industry | F500 HQs | Revenue |
|---|---|---|
| Technology | 2 | $13B |
|
||
| Mining / Metals | 1 | $23B |
|
||
| Environmental Services | 1 | $16B |
|
||
| Metals / Steel | 1 | $14B |
|
||
| Technology Distribution | 1 | $9B |
|
||
| Homebuilding | 1 | $8B |
|
||
Price history
+25.0% since first listed19 events — show timeline
- 2026-04-10 Pending — PAARMLS as Distributed by MLS Grid
- 2026-03-10 Relisted — PAARMLS as Distributed by MLS Grid
- 2026-03-03 Pending — PAARMLS as Distributed by MLS Grid
- 2026-02-27 Price Changed $150,000 PAARMLS as Distributed by MLS Grid
- 2026-01-23 Listed $165,000 PAARMLS as Distributed by MLS Grid
- 2025-11-20 Price Changed $150,000 PAARMLS as Distributed by MLS Grid
- 2025-10-31 Price Changed $160,000 PAARMLS as Distributed by MLS Grid
- 2025-10-22 Relisted — PAARMLS as Distributed by MLS Grid
- 2025-10-22 Listing Removed — PAARMLS as Distributed by MLS Grid
- 2025-10-22 Price Changed $199,000 PAARMLS as Distributed by MLS Grid
- 2025-10-10 Pending — PAARMLS as Distributed by MLS Grid
- 2025-09-26 Relisted — PAARMLS as Distributed by MLS Grid
- 2025-09-05 Pending — PAARMLS as Distributed by MLS Grid
- 2025-08-16 Price Changed $170,000 PAARMLS as Distributed by MLS Grid
- 2025-06-18 Price Changed $175,000 PAARMLS as Distributed by MLS Grid
- 2025-05-15 Price Changed $185,000 PAARMLS as Distributed by MLS Grid
- 2025-05-08 Listed $199,000 PAARMLS as Distributed by MLS Grid
- 2022-02-22 Sold (Public Records) $390,000 Public Records
- 2005-08-05 Sold (Public Records) $120,000 Public Records
Property tax history
+2.8%/yrLatest (2025): $283 · +1.1% YoY. Source: county tax records.
Cash-flow waterfall
monthlySold comps — $/sqft
last 12 mo · ≤1 miLoading sold comps…