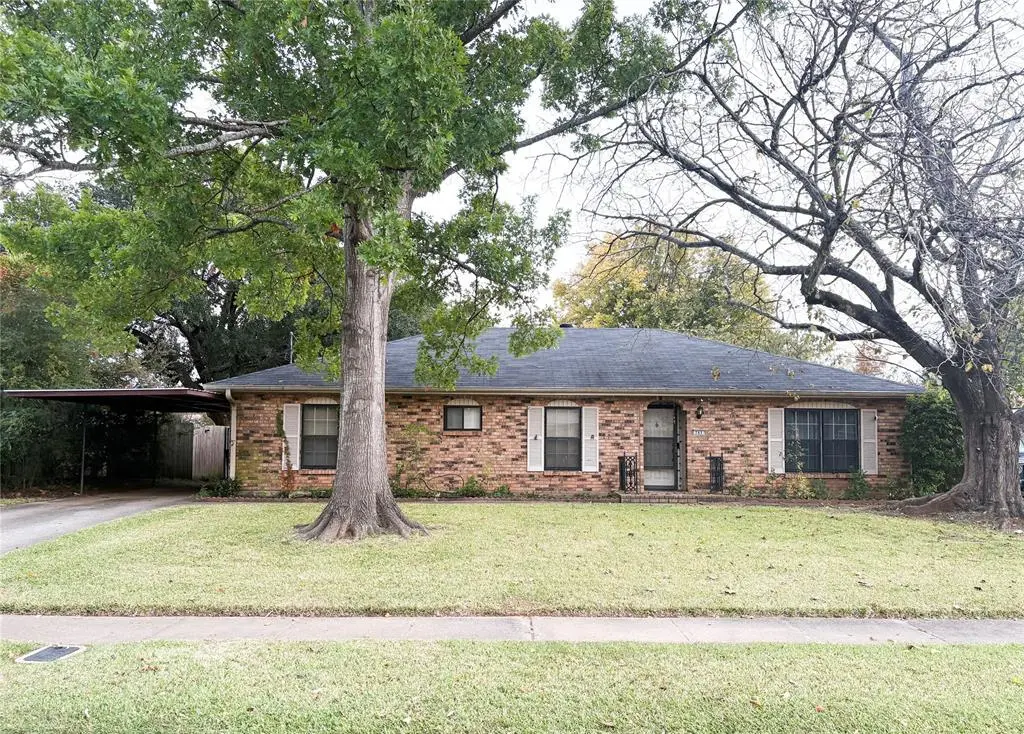
265 Suzanne Dr · Shreveport, LA
Flood risk 1/10 · Minimal
- FEMA flood zone
- X
- Chance of flooding over 30 yrs
- 0.0%
- Est. flood insurance / yr
- $507 – $1,088
Fire risk 1/10 · Minimal
- Est. fire insurance / yr
- $1,269 – $2,357
Heat risk 7/10 · Major
- Hot days now (above 110°F)
- 7 days/yr
- Hot days in 30 yrs
- 22 days/yr
Wind risk 6/10 · Moderate
- Chance of severe wind over 30 yrs
- 68.0%
Air-quality risk 2/10 · Minimal
- Unhealthy air days now
- 0 days/yr
- Unhealthy air days in 30 yrs
- 1 days/yr
Risk factors via First Street. Map © Google.
Why this score? — see what drove the C- grade
The composite is a weighted blend of 9 inputs, each scored 0–100. Each bar is that input's sub-score; the figure is the points it added to the 100-point composite (weight × sub-score).
- Cash flow +18.8/30.0
- ARV discount +13.2/15.0
- DSCR +5.9/10.0
- 1% rule +5.0/10.0
- Livability +3.0/5.0
- Rent growth +2.5/5.0
- Condition / age +2.5/5.0
- Schools +2.2/10.0
- Appreciation +0.0/10.0
$195,000
🖨 Deal sheet 📄 Offer letter ✓ Due diligence
Listing remarks MLS
Welcome to this spacious 4-bed, 2-bath home boasting 1,970 sq. ft. of opportunity! This gem could truly shine. Imagine customizing each room to fit your style—open up the living spaces, refresh the kitchen, or create the perfect backyard retreat. Whether you’re an investor, first-time buyer, or someone ready for a project, this home offers great bones and endless potential. Bring your vision and make it your own! Photos coming soon!!
Key facts
- 8,581 sq ft lot
- Garage
- Built 1970
Neighborhood map
What this means for you Summary
Snapshot
- This is a 4-bed/2.0-bath single-family listed at $195k.
Deal economics
- At list price, monthly cash flow is $198 ($2k/yr) — positive.
- The deal already cash-flows at list — no discount required.
- Meets the 1% rule at list price ($2k rent vs $195k).
- Recommended offer: $172k (12.0% below list) — sets the bar for market timing.
- Cap rate 7.5% vs local median 5.7% in Shreveport — top-decile yield for the area; either an underpriced asset or a hidden risk that comps aren't pricing in. Stress-test before assuming the spread holds.
Location & tenants
- Location reads 59/100 on livability (#270 in LA) — a working-class tenant base; expect higher turnover. Strengths: cost of living A+, housing A; Watch: schools D+, crime F, amenities F.
- Caddo Parish (urban): math 21% / reading 32% proficiency, ranked #53 of 98 in LA (top 54%) — low school quality limits family demand, transient renter base, plan for 1-2y turnover; 64% free/reduced lunch — lower-income household profile, screen leases tightly.
- Market conditions: Rents flat; 105 active listings in the ZIP; 15 comparable units currently listed for rent nearby; rentals at typical pace (median 21d on market — plan ~3-4 weeks tenant-placement turnaround); 221 units permitted in Caddo Parish in 2024 (0 in 5+ unit buildings).
- This rent runs 36% of the median local income ($66k/yr) — at the standard rent-burdened threshold; future hikes will face affordability resistance.
Forward outlook
- Local home prices are declining (-3.0%/yr); year-one equity from $1k of loan paydown is wiped out by about $6k of value loss. Plan a longer hold.
- Caddo County population projected at -15% by 2050 — secular population decline; favor cash flow + early exit over multi-decade hold.
Negotiation context
- It's been on market 121 days — a 12% lower offer ($172k) is reasonable based on typical stale-listing flexibility.
- 3 sale attempts since 4y ago with the ask held roughly flat each time — persistent listings suggest the price (not the market) is what's stuck; bring a comps-based counter.
Risks & watch-outs
- Climate carrying-cost: major wind risk, 68% chance of damaging wind over 30y; extreme-heat days projected 7→22/yr by 2055 (HVAC capex compounding) — expect insurance premiums to compound above CPI over the hold.
Questions for the listing agent
- It's been on market 121 days. Have you received any prior offers? Is the seller open to a 12% concession, seller financing, or rate buy-down credit?
- Built in 1970 — when were the roof, HVAC, electrical panel, plumbing, and water heater last replaced?
- Why hasn't it sold? Are there any deal-killer items the seller is aware of (foundation, flood, title, zoning, code violations)?
- Is there a deadline driving the sale (1031 exchange, divorce, estate, relocation)? That informs how much negotiation room exists.
- Schools are D-rated, which usually means shorter tenancies and higher turnover. Who's the typical renter profile here, and what's been the actual vacancy rate?
- Crime grade is F in this area — have there been break-ins, vandalism, or insurance claims at this property in the last 3 years? What carrier currently insures it and at what premium?
- What's the average days-on-market for RENTAL listings here right now (not sales)? A rising rental-DOM trend means longer vacancies and softer asking-rent achievability than the comps imply.
- What's the recent tenant-quality profile in this submarket — average credit score on applications, eviction rate, late-payment / NSF rate, and stable-employment percentage? A property-management company in the area should have these aggregated.
- How much new for-sale + rental construction is in the pipeline within 1–3 miles? Heavy new supply typically softens prices + rents 12–24 months out; constrained supply supports both.
Investment metrics
- 1% rule
- 1.00% ✓
- Cap rate
- 7.51%
- Cash-on-cash
- 4.35%
- DSCR
- 1.19
- GRM
- 8.3
CMA / ARV
- ARV (median comp)
- $223,198
- List price
- $195,000
- Delta
- -12.63%
- Verdict
- UNDERPRICED
- Comps
- 20 within 1.0 mi
Show comp detail 12 sales within ~0.75 mi
| Address | Dist | Beds/Ba | Sqft | Sold | Price | $/sf | Match |
|---|---|---|---|---|---|---|---|
| 9322 Wiscassett Dr | 0.28mi | 4/2.5 | 2,301 (+5%) | 1mo | $167,500 | $73 | 76 |
| 617 Turtle Creek Dr | 0.50mi | 4/2.0 | 2,160 (-1%) | 4mo | $268,000 | $124 | 71 |
| 519 Rock Hollow Dr | 0.36mi | 3/2.0 (-1) | 2,323 (+6%) | 1mo | $257,000 | $111 | 67 |
| 521 Rock Hollow Dr | 0.37mi | 3/2.0 (-1) | 2,266 (+4%) | 7mo | $263,000 | $116 | 66 |
| 511 Turtle Creek Dr | 0.25mi | 4/2.0 | 1,915 (-13%) | 2mo | $259,900 | $136 | 66 |
| 507 Rock Hollow Dr | 0.29mi | 3/2.0 (-1) | 2,328 (+6%) | 7mo | $285,000 | $122 | 65 |
| 9312 Melissa Way | 0.32mi | 4/3.0 | 2,417 (+10%) | 1mo | $272,000 | $113 | 63 |
| 110 Marrero | 0.50mi | 4/3.0 | 2,107 (-4%) | 11mo | $257,500 | $122 | 58 |
| 189 India Dr | 0.48mi | 3/2.0 (-1) | 2,012 (-8%) | 2mo | $214,000 | $106 | 57 |
| 522 Demery Blvd | 0.38mi | 3/2.0 (-1) | 2,019 (-8%) | 10mo | $315,000 | $156 | 56 |
| 505 Forsythe Ct | 0.48mi | 4/2.5 | 2,439 (+11%) | 2mo | $399,000 | $164 | 55 |
| 414 N Dresden Cir | 0.71mi | 3/2.0 (-1) | 1,940 (-11%) | 0mo | $208,000 | $107 | 42 |
Match score weights: distance 35% · size 25% · config 20% · recency 20%. Top-matched comps best support the ARV.
Projected returns pro-forma
-3.0% appreciation · 0.07% rent growth · sell at horizon
- IRR
- -12.9%
- Equity multiple
- 0.55×
- Total profit
- $-24,576
- Equity at exit
- $29,075
- IRR
- -9.1%
- Equity multiple
- 0.51×
- Total profit
- $-26,758
- Equity at exit
- $16,860
Cash invested: $54,600 (down + closing). Projections, not guarantees.
Landlord ↔ Tenant lean methodology
- Overall (STATE)
- 90 Strongly Landlord-Friendly
- State Louisiana
- 90 Strongly Landlord-Friendly · R+12
- County
- — inherits STATE
- City
- — inherits STATE
ZIP-level market 71115
- Home prices YoY
- -26.5%
- Rents YoY
- 0.1%
- Active inventory
- 105
- Price-to-rent
- 8.3×
Monthly cashflow live
- Estimated rent
- $1,958 high interval (Pro) →
- Mortgage (P&I)
- −$1,023
- Tax from tax record
- −$245 /mo · $2,945/yr
- Insurance
- −$81
- HOA
- −$0
- Vacancy / Maint / Mgmt
- −$411
- Net cashflow
- $198
Break-even live
UW: 25.0% down · 7.5% · 30yr · 1.5% tax · 5.0% vac · 8.0% maint · 8.0% mgmt
Financing live
Cash to close
- Down payment
- $48,750
- Closing costs
- $5,850
- Reserves months
- —
- Total cash needed
- —
Loan-product check · same deal, 3 products live
Conventional
25% down · 7.5% · 30yr
- Down + closing
- —
- Monthly P&I
- —
- Monthly cashflow
- —
- DSCR
- —
- Eligible?
- —
Personal DTI + credit; lowest rate.
DSCR
20% down · 8.5% · 30yr
- Down + closing
- —
- Monthly P&I
- —
- Monthly cashflow
- —
- DSCR
- —
- Eligible?
- —
No personal income docs; deal must DSCR.
Hard money
10% down · 12.0% · 12mo
- Down + closing
- —
- Monthly P&I
- —
- Monthly cashflow
- —
- DSCR
- —
- Eligible?
- —
Short-term bridge; refi at stabilization.
Rent comps 15 comps
| Address | Beds | Baths | Sqft | Rent | $/sqft | DOM | Units | Dist |
|---|---|---|---|---|---|---|---|---|
| 9505 Balsa Dr Shreveport, LA | 3.0 | 2.5 | 1744 | $1,900 | $1.09 | 13d | 1 | 0.54mi |
| 8820 Beau Chene Dr Shreveport, LA | 4.0 | 2.0 | 1932 | $2,500 | $1.29 | 43d | 1 | 0.69mi |
| 409 Persimmon Dr Shreveport, LA | 3.0 | 2.0 | 1800 | $1,900 | $1.06 | 20d | 1 | 0.73mi |
| 522 S Dresden Ct Shreveport, LA | 4.0 | 3.0 | 1975 | $1,930 | $0.98 | 13d | 1 | 0.82mi |
| 10014 Stratmore Cir Unit 10014 Shreveport, LA | 3.0 | 2.5 | 1824 | $1,600 | $0.88 | 13d | 1 | 0.87mi |
| 10018 Artesia Dr Shreveport, LA | 3.0 | 2.5 | 1875 | $1,500 | $0.80 | 43d | 1 | 0.91mi |
| 119 Stratmore Dr Shreveport, LA | 4.0 | 3.0 | 2019 | $2,200 | $1.09 | 20d | 1 | 0.92mi |
| 10142 Carlsbad Dr Shreveport, LA | 3.0 | 2.5 | 1500 | $1,400 | $0.93 | 20d | 1 | 1.10mi |
| 10139 Carlsbad Dr Shreveport, LA | 3.0 | 2.0 | 1464 | $1,800 | $1.23 | 43d | 1 | 1.10mi |
| 10305 Monet Dr Shreveport, LA | 3.0 | 2.5 | 1533 | $1,600 | $1.04 | 20d | 1 | 1.12mi |
| 8117 Captain Mary Miller Dr Shreveport, LA | 3.0 | 2.0 | 1780 | $2,200 | $1.24 | 43d | 1 | 1.16mi |
| 10327 Loma Vista Dr Unit 10327 Shreveport, LA | 3.0 | 2.5 | 1474 | $1,590 | $1.08 | 20d | 1 | 1.17mi |
| 184 Riverbrooke Dr Shreveport, LA | 3.0 | 2.0 | 1620 | $2,000 | $1.23 | 20d | 1 | 1.22mi |
| 293 Eagle Bend Way Shreveport, LA | 3.0 | 2.0 | 1800 | $2,025 | $1.12 | 43d | 1 | 1.41mi |
| 7416 Camelback Dr Shreveport, LA | 4.0 | 2.5 | 2377 | $2,000 | $0.84 | 20d | 1 | 1.48mi |
Listing history 28 events
-
2026-06-18days on market $195,000 Active 121 DOM
-
2026-06-17days on market $195,000 Active 120 DOM
-
2026-06-16days on market $195,000 Active 119 DOM
-
2026-06-15days on market $195,000 Active 118 DOM
-
2026-06-14days on market $195,000 Active 116 DOM
-
2026-06-13days on market $195,000 Active 115 DOM
-
2026-06-10days on market $195,000 Active 113 DOM
-
2026-06-09days on market $195,000 Active 112 DOM
-
2026-06-08days on market $195,000 Active 111 DOM
-
2026-06-07days on market $195,000 Active 110 DOM
-
2026-06-05days on market $195,000 Active 107 DOM
-
2026-06-03days on market $195,000 Active 106 DOM
-
2026-06-02days on market $195,000 Active 105 DOM
-
2026-06-01days on market $195,000 Active 104 DOM
-
2026-05-31days on market $195,000 Active 103 DOM
-
2026-05-30days on market $195,000 Active 102 DOM
-
2026-05-08price $195,000 455-char remark
Show marketing remark (455 chars)
Welcome to this spacious 4-bed, 2-bath home boasting 1,970 sq. ft. of opportunity! This gem could truly shine. Imagine customizing each room to fit your style—open up the living spaces, refresh the kitchen, or create the perfect backyard retreat. Whether you’re an investor, first-time buyer, or someone ready for a project, this home offers great bones and endless potential. Bring your vision and make it your own! Photos coming soon!!
-
2026-02-17$205,000 Active 455-char remark
Show marketing remark (455 chars)
Welcome to this spacious 4-bed, 2-bath home boasting 1,970 sq. ft. of opportunity! This gem could truly shine. Imagine customizing each room to fit your style—open up the living spaces, refresh the kitchen, or create the perfect backyard retreat. Whether you’re an investor, first-time buyer, or someone ready for a project, this home offers great bones and endless potential. Bring your vision and make it your own! Photos coming soon!!
-
2026-02-17historical
Show marketing remark (455 chars)
Welcome to this spacious 4-bed, 2-bath home boasting 1,970 sq. ft. of opportunity! This gem could truly shine. Imagine customizing each room to fit your style—open up the living spaces, refresh the kitchen, or create the perfect backyard retreat. Whether you’re an investor, first-time buyer, or someone ready for a project, this home offers great bones and endless potential. Bring your vision and make it your own! Photos coming soon!!
-
2026-01-09price $205,000
-
2025-11-07$210,000 Active
-
2022-09-08soldstatus Closed
-
2022-09-08soldstatus $198,500
-
2022-06-07historical Active Contingent
-
2022-05-19status Pending
-
2022-05-13price $198,500
-
2022-04-28$250,000 Active
-
1992-11-30soldstatus
ⓘ Source: listings_history table (triggers on properties + properties_extension) + one-shot
backfill from property_details.listing_events for pre-trigger history.
Tax reassessment forecast LA · Resets to sale price
- Current annual tax
- $2,945 · $245/mo
- Projected year-2 tax
- $2,945 · $245/mo
- Expected delta
- $0/yr ($0/mo · 0.0%)
ⓘ Screening estimate from a state-policy table — verify with the county assessor before closing.
Climate risk First Street
- Flood 1/10 Low FEMA zone X · 0% chance over 30 yrs
- Wildfire 1/10 Low
- Heat 7/10 Severe 7 d/yr ≥110°F today · 22 d/yr by 30 yrs out
- Wind 6/10 Major 68% chance of damaging wind over 30 yrs
- Air quality 2/10 Low 0 unhealthy d/yr today · 1 by 30 yrs out
Nearby sold comps map
Loading sold comps map…
Walkable amenities ~0.75 mi
Loading nearby amenities…
Taxation est. · year 1
- Rental income
- $23,501
- − Mortgage interest
- −$10,923
- − Property taxes
- −$2,945
- − Insurance
- −$975
- − Repairs & maintenance
- −$1,880
- − Management
- −$1,880
- − Depreciation
- −$5,673
- Taxable loss
- −$775
- Est. tax savings @ 24.0%
- +$186
- After-tax cash flow
- $2,560/yr
For passive investors: Depreciation is non-cash, so a rental often shows a tax loss while cash-flowing — sheltering income. Rental losses are passive: they offset passive income freely, and up to $25,000/yr can offset ordinary (W-2) income if you actively participate and your MAGI is under $100k (phasing out to $0 by $150k); unused losses carry forward. On sale, claimed depreciation is recaptured at up to 25%, and gains may owe capital-gains tax (a 1031 exchange can defer both). Figures are a year-1 estimate at your 24.0% rate — not tax advice; consult a CPA.
Schools (NCES district)
- District
- Caddo Parish
- NCES district ID
- 2200300
- Math proficiency
- 21% ▼ -33.00%
- Reading proficiency
- 32% ▼ -30.00%
- Median HH income
- $39,227
- Composite
- 22.23/100
- National rank
- #8148
- State rank
- #53 of 98 in LA
Livability — Shreveport
- Score
- 59/100
- State rank
- #270
- US rank
- #19730
Category grades
Schools grade is shown separately in the Schools card above.
Census & demographics
- Census place
- Shreveport, LA
- County
- Caddo Parish · 178,536 people
- City population
- 164,123
- Metro
- Shreveport-Bossier City, LA
- Population (ZIP)
- 14,413
- Household income
- $65,509
- Rent vs Own
- Severe rent burden
- 582.0
Population outlook (Caddo County) Hauer SSP2
- Today (2025)
- 243,190 people
- By 2030
- 237,231 · -2.5%
- By 2040
- 222,502 · -8.5%
- By 2050
- 206,516 · -15.1%
- By 2075
- 165,706 · -31.9%
- By 2100
- 122,262 · -49.7%
Race, ethnicity, and origin ACS 2023
- Neighborhood character
- Predominantly White (66%)
- Race & ethnicity
- White 66% Black 21% Two or more races 5% Asian 5% Hispanic / Latino 3%
- Common ancestry
- Lithuanian 5% Italian 2% Slovak 1%
- Foreign-born
- 6% · China, Canada, Vietnam
- Languages at home
- 91% English-only · Spanish 4% Chinese 2% Other Indo-European 2%
Political lean MEDSL · Caddo
- 2024 margin
- Toss-up / Even · D 51.6% · R 47.0% · Other 1.4%
- 2008→2024 swing
- +1.6pp toward D · 2008: 3.0pp · 2024: 4.6pp
- All cycles
- 2024: D+4.6 2020: D+6.8 2016: D+4.2 2012: D+4.9 2008: D+3.0
Not yet ingested
- Civics
- —
Market trends
- HPI YoY
- ▼ -45.95%
- Current HPI
- 127.4874
- Rent YoY
- ▲ 0.07%
- Metro
- Shreveport-Bossier City, LA
- State GDP YoY
- ▲ 3.29%
- F500 in state
- 10
Industry mix (Fortune 500 HQ in LA)
| Industry | F500 HQs | Revenue |
|---|---|---|
| Telecommunications | 2 | $23B |
|
||
| Utilities | 1 | $12B |
|
||
| Wholesale / Distribution | 1 | $5B |
|
||
| Advertising | 1 | $2B |
|
||
Price history
-22.0% since first listed12 events — show timeline
- 2026-05-08 Price Changed $195,000 NTREIS
- 2026-02-17 Listing Removed — NTREIS
- 2026-02-17 Listed $205,000 NTREIS
- 2026-01-09 Price Changed $205,000 NTREIS
- 2025-11-07 Listed $210,000 NTREIS
- 2022-09-08 Sold (Public Records) $198,500 Public Records
- 2022-09-08 Sold (MLS) — NTREIS
- 2022-06-07 Contingent — NTREIS
- 2022-05-19 Pending — NTREIS
- 2022-05-13 Price Changed $198,500 NTREIS
- 2022-04-28 Listed $250,000 NTREIS
- 1992-11-30 Sold (Public Records) — Public Records
Property tax history
+13.3%/yrLatest (2025): $2,945 · +0.4% YoY. Source: county tax records.
Cash-flow waterfall
monthlySold comps — $/sqft
last 12 mo · ≤1 miLoading sold comps…