210 Loblolly Ln · Kilgore, TX
Flood risk No data
- FEMA flood zone
- —
- Chance of flooding over 30 yrs
- —
- Est. flood insurance / yr
- —
Fire risk No data
- Est. fire insurance / yr
- —
Heat risk No data
- Hot days now (above threshold)
- —
- Hot days in 30 yrs
- —
Wind risk No data
- Chance of severe wind over 30 yrs
- —
Air-quality risk No data
- Unhealthy air days now
- —
- Unhealthy air days in 30 yrs
- —
Risk factors via First Street. Map © Google.
Why this score? — see what drove the B grade
The composite is a weighted blend of 9 inputs, each scored 0–100. Each bar is that input's sub-score; the figure is the points it added to the 100-point composite (weight × sub-score).
- Cash flow +30.0/30.0
- 1% rule +10.0/10.0
- DSCR +10.0/10.0
- ARV discount +7.5/15.0
- Condition / age +5.0/5.0
- Rent growth +4.7/5.0
- Livability +3.6/5.0
- Schools +3.1/10.0
- Appreciation +0.0/10.0
$79,999
🖨 Deal sheet 📄 Offer letter ✓ Due diligence
Listing remarks
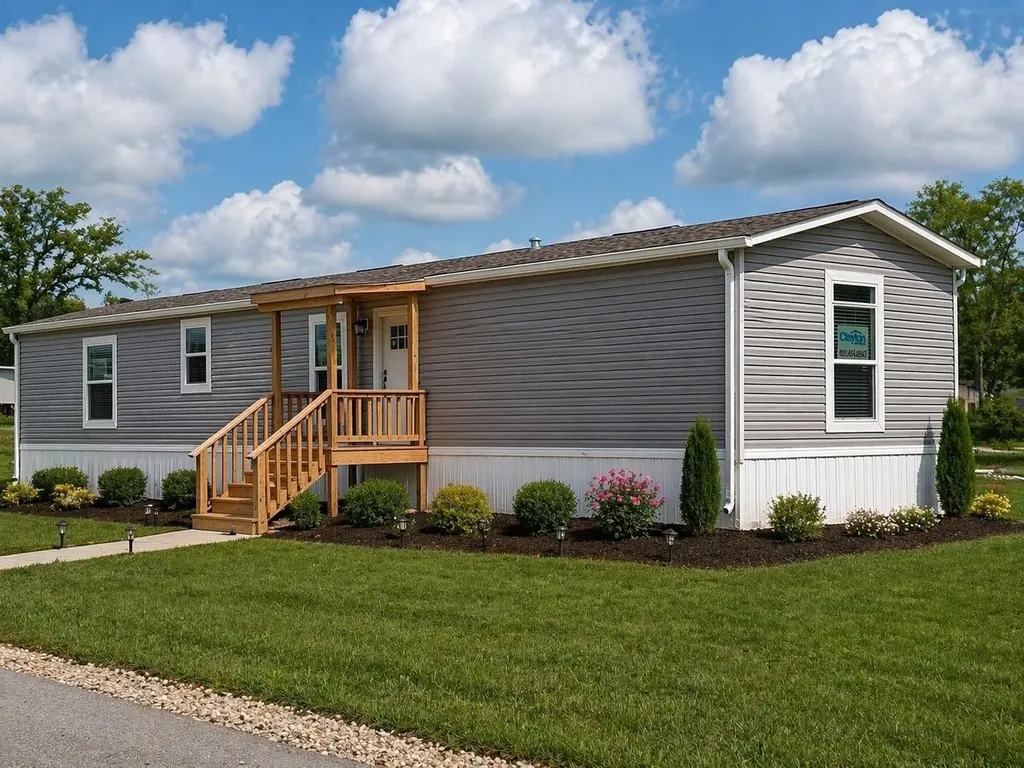
HOME ONLY Brand new 3 bedroom, 2 bathroom home located in Kilgore ISD on a desirable corner lot. This home has never been lived in and offers a fresh, modern feel throughout. It includes a 5-year home warranty for added peace of mind. Buyers have the option to purchase the home and move it to a new location, or lease the current lot for $375 per month, which includes water, sewer, and trash services. Please note, all photos have been enhanced due to no power at the time they were taken, and some images have been virtually staged to showcase the home’s potential. Schedule your private tour today!
Key facts
- Built 2026
- Listed 31 days
Property features AI
Exterior
- Home design: Manufactured home; Single-story; New construction; Residential property
- Construction: New construction; Manufactured construction
- Exterior features: Composition roof; Corner lot
Interior
- Kitchen: Dishwasher; Microwave; Refrigerator
- Flooring: Vinyl
- Bathrooms: 2 full bathrooms
- Heating & cooling: Central heating (electric); Central air; Ceiling fan(s)
- Interior features: Breakfast bar
- Laundry & utility: Electric water heater
Neighborhood map
What this means for you Summary
Snapshot
- This is a 3-bed/2.0-bath manufactured listed at $80k. Condition is rated excellent.
Deal economics
- At list price, monthly cash flow is $580 ($7k/yr) — positive.
- The deal already cash-flows at list — no discount required.
- Meets the 1% rule at list price ($1k rent vs $80k).
- Recommended offer: $78k (3.0% below list) — sets the bar for market timing.
Location & tenants
- Location reads 72/100 on livability (#257 in TX) — a middle-class / working-renter tenant base. Strengths: cost of living A+, housing A+, health & safety A+; Watch: crime D+, employment D+, schools D-.
- Kilgore ISD (town): math 33% / reading 38% proficiency, ranked #498 of 826 in TX (top 60%) — families likely to look elsewhere, expect single-tenant / working-renter base with shorter leases.
- Market conditions: Rents rising fast (+8.9%/yr); 283 active listings in the ZIP; 2 comparable units currently listed for rent nearby; 193 units permitted in Gregg County in 2024 (0 in 5+ unit buildings).
Forward outlook
- Local home prices are declining (-3.0%/yr); year-one equity from $553 of loan paydown is wiped out by about $2k of value loss. Plan a longer hold.
- At projected returns (-3.0% appreciation + 8.0% rent growth), your $22k cash investment doubles in ~4 years — after that, you're playing with house money.
Negotiation context
- It's been on market 32 days — a 3% lower offer ($78k) is reasonable based on typical stale-listing flexibility.
Questions for the listing agent
- It's been on market 32 days. Have you received any prior offers? Is the seller open to a 3% concession, seller financing, or rate buy-down credit?
- Is there a deadline driving the sale (1031 exchange, divorce, estate, relocation)? That informs how much negotiation room exists.
- Schools are D-rated, which usually means shorter tenancies and higher turnover. Who's the typical renter profile here, and what's been the actual vacancy rate?
- Crime grade is D in this area — have there been break-ins, vandalism, or insurance claims at this property in the last 3 years? What carrier currently insures it and at what premium?
- What's the average days-on-market for RENTAL listings here right now (not sales)? A rising rental-DOM trend means longer vacancies and softer asking-rent achievability than the comps imply.
- What's the recent tenant-quality profile in this submarket — average credit score on applications, eviction rate, late-payment / NSF rate, and stable-employment percentage? A property-management company in the area should have these aggregated.
- How much new for-sale + rental construction is in the pipeline within 1–3 miles? Heavy new supply typically softens prices + rents 12–24 months out; constrained supply supports both.
Investment metrics
- 1% rule
- 1.79% ✓
- Cap rate
- 14.99%
- Cash-on-cash
- 31.06%
- DSCR
- 2.38
- GRM
- 4.6
CMA / ARV
No comps found within radius.
Projected returns pro-forma
-3.0% appreciation · 8.0% rent growth · sell at horizon
- IRR
- 31.4%
- Equity multiple
- 2.41×
- Total profit
- $31,567
- Equity at exit
- $11,928
- IRR
- 41.3%
- Equity multiple
- 5.89×
- Total profit
- $109,618
- Equity at exit
- $6,917
Cash invested: $22,400 (down + closing). Projections, not guarantees.
Landlord ↔ Tenant lean methodology
- Overall (STATE)
- 87 Strongly Landlord-Friendly
- State Texas
- 87 Strongly Landlord-Friendly · R+5
- County
- — inherits STATE
- City
- — inherits STATE
ZIP-level market 75662
- Home prices YoY
- -16.9%
- Rents YoY
- 8.9%
- Active inventory
- 283
- Price-to-rent
- 4.6×
Monthly cashflow live
- Estimated rent
- $1,434 medium interval (Pro) →
- Mortgage (P&I)
- −$420
- Tax est. 1.5%
- −$100 /mo · $1,200/yr
- Insurance
- −$33
- HOA
- −$0
- Vacancy / Maint / Mgmt
- −$301
- Net cashflow
- $580
Break-even live
UW: 25.0% down · 7.5% · 30yr · 1.5% tax · 5.0% vac · 8.0% maint · 8.0% mgmt
Financing live
Cash to close
- Down payment
- $20,000
- Closing costs
- $2,400
- Reserves months
- —
- Total cash needed
- —
Loan-product check · same deal, 3 products live
Conventional
25% down · 7.5% · 30yr
- Down + closing
- —
- Monthly P&I
- —
- Monthly cashflow
- —
- DSCR
- —
- Eligible?
- —
Personal DTI + credit; lowest rate.
DSCR
20% down · 8.5% · 30yr
- Down + closing
- —
- Monthly P&I
- —
- Monthly cashflow
- —
- DSCR
- —
- Eligible?
- —
No personal income docs; deal must DSCR.
Hard money
10% down · 12.0% · 12mo
- Down + closing
- —
- Monthly P&I
- —
- Monthly cashflow
- —
- DSCR
- —
- Eligible?
- —
Short-term bridge; refi at stabilization.
Rent comps 2 comps
| Address | Beds | Baths | Sqft | Rent | $/sqft | DOM | Units | Dist |
|---|---|---|---|---|---|---|---|---|
| 203 Sugar Maple Ln Kilgore, TX | 3.0 | 2.0 | 964 | $1,400 | $1.45 | 44d | 1 | 0.08mi |
| 159 Sugar Maple Ln Kilgore, TX | 3.0 | 2.0 | 964 | $1,350 | $1.40 | 13d | 1 | 0.08mi |
Listing history 1 events
-
2026-04-24$79,999 Active 608-char remark
ⓘ Source: listings_history table (triggers on properties + properties_extension) + one-shot
backfill from property_details.listing_events for pre-trigger history.
Nearby sold comps map
Loading sold comps map…
Walkable amenities ~0.75 mi
Loading nearby amenities…
Taxation est. · year 1
- Rental income
- $17,206
- − Mortgage interest
- −$4,481
- − Property taxes
- −$1,200
- − Insurance
- −$400
- − Repairs & maintenance
- −$1,376
- − Management
- −$1,376
- − Depreciation
- −$2,327
- Taxable income
- $6,044
- Est. tax owed @ 24.0%
- −$1,451
- After-tax cash flow
- $5,508/yr
For passive investors: Depreciation is non-cash, so a rental often shows a tax loss while cash-flowing — sheltering income. Rental losses are passive: they offset passive income freely, and up to $25,000/yr can offset ordinary (W-2) income if you actively participate and your MAGI is under $100k (phasing out to $0 by $150k); unused losses carry forward. On sale, claimed depreciation is recaptured at up to 25%, and gains may owe capital-gains tax (a 1031 exchange can defer both). Figures are a year-1 estimate at your 24.0% rate — not tax advice; consult a CPA.
Condition & rehab AI · 6 photos
This brand new, move-in-ready manufactured home offers a modern and well-maintained interior with a fresh exterior and landscaping. It is in excellent condition with no visible repairs or maintenance needed.
Value-add opportunities
- Both Painting the exterior and interior walls — Fresh paint enhances curb appeal and interior aesthetics.
- Both Landscaping improvements — Enhances curb appeal and adds value to the property.
- Both Adding a small outdoor patio or seating area — Increases outdoor living space and adds value to the property.
Renovation cost estimate screening
Value-add ROI direction
- Both Painting the exterior and interior walls — Fresh paint enhances curb appeal and interior aesthetics. ↑
- Both Landscaping improvements — Enhances curb appeal and adds value to the property. ↑
- Both Adding a small outdoor patio or seating area — Increases outdoor living space and adds value to the property. ↑
ⓘ Cost ranges are severity-bucket heuristics (US national rule-of-thumb). Get contractor quotes + a written scope before underwriting a rehab budget.
Schools (NCES district)
- District
- Kilgore ISD
- NCES district ID
- 4825620
- Math proficiency
- 33% ▼ -6.00%
- Reading proficiency
- 38% ▲ 2.00%
- Median HH income
- $49,682
- Composite
- 30.72/100
- National rank
- #6168
- State rank
- #498 of 826 in TX
Livability — Kilgore
- Score
- 72/100
- State rank
- #257
- US rank
- #6044
Category grades
Schools grade is shown separately in the Schools card above.
Census & demographics
- County
- Gregg County · 128,826 people
- City population
- 25,034
- Metro
- Longview, TX
- Population (ZIP)
- 25,034
- Household income
- $70,096
- Rent vs Own
- Severe rent burden
- 486.0
Population outlook (Gregg County) Hauer SSP2
- Today (2025)
- 125,947 people
- By 2030
- 126,542 · +0.5%
- By 2040
- 127,311 · +1.1%
- By 2050
- 127,289 · +1.1%
- By 2075
- 124,954 · -0.8%
- By 2100
- 113,737 · -9.7%
Race, ethnicity, and origin ACS 2023
- Neighborhood character
- Diverse neighborhood (Simpson 0.58)
- Race & ethnicity
- White 59% Hispanic / Latino 23% Two or more races 22% Black 11%
- Hispanic origin (detail)
- Mexican 21%
- Common ancestry
- Lithuanian 2% Slovak 1% Serbian 1%
- Foreign-born
- 9% · Canada
- Languages at home
- 81% English-only · Spanish 18%
Political lean MEDSL · Gregg
- 2024 margin
- Solid R (+42.2) · D 28.5% · R 70.7%
- 2008→2024 swing
- -4.6pp toward R · 2008: -37.6pp · 2024: -42.2pp
- All cycles
- 2024: R+42.2 2020: R+36.9 2016: R+41.3 2012: R+39.5 2008: R+37.6
Not yet ingested
- Civics
- —
Market trends
- HPI YoY
- ▼ -50.09%
- Current HPI
- 247.1337
- Rent YoY
- ▲ 8.89%
- Metro
- Longview, TX
- State GDP YoY
- ▲ 3.95%
- F500 in state
- 110
Industry mix (Fortune 500 HQ in TX)
| Industry | F500 HQs | Revenue |
|---|---|---|
| Energy | 16 | $1,198B |
|
||
| Technology | 5 | $198B |
|
||
| Engineering / Construction | 4 | $72B |
|
||
| Energy Services | 3 | $60B |
|
||
| Utilities | 3 | $41B |
|
||
| Healthcare | 2 | $330B |
|
||
Price history
1 event — show timeline
- 2026-04-24 Listed $79,999 LAAR
Cash-flow waterfall
monthlySold comps — $/sqft
last 12 mo · ≤1 miLoading sold comps…