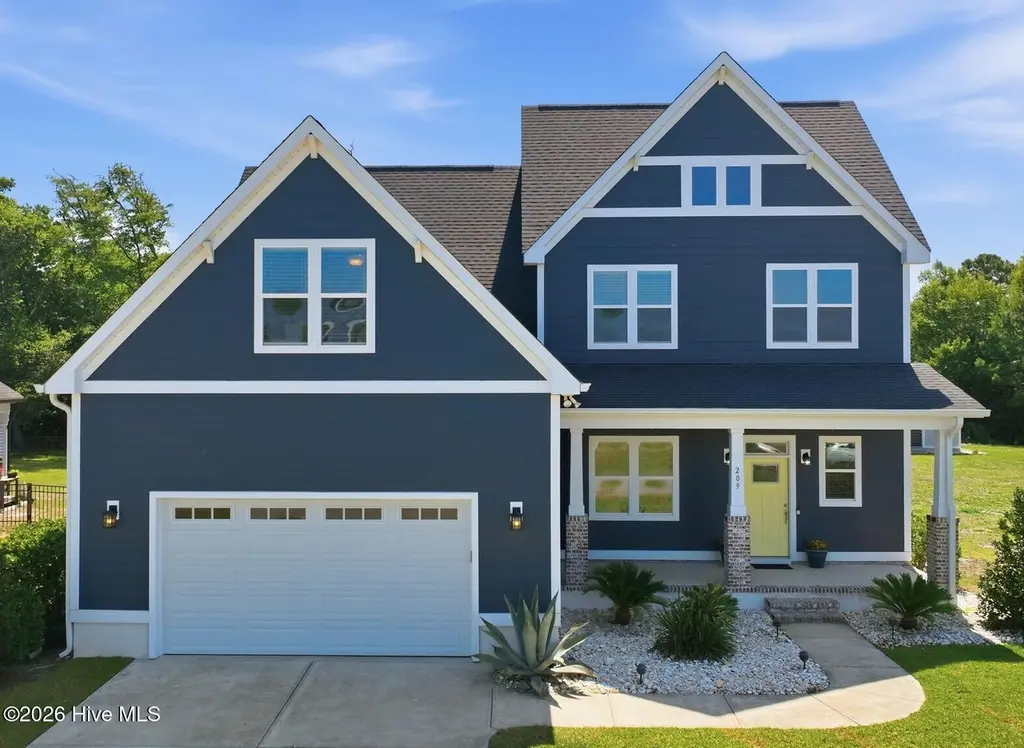
209 Bogue Carrier Ct · Broad Creek, NC
Flood risk 7/10 · Major
- FEMA flood zone
- X (shaded)
- Chance of flooding over 30 yrs
- 0.96%
- Est. flood insurance / yr
- $507 – $1,088
Fire risk 3/10 · Minor
- Est. fire insurance / yr
- $906 – $1,684
Heat risk 9/10 · Severe
- Hot days now (above 102°F)
- 7 days/yr
- Hot days in 30 yrs
- 20 days/yr
Wind risk 8/10 · Major
- Chance of severe wind over 30 yrs
- 99.0%
Air-quality risk 2/10 · Minimal
- Unhealthy air days now
- 2 days/yr
- Unhealthy air days in 30 yrs
- 2 days/yr
Risk factors via First Street. Map © Google.
Why this score? — see what drove the B grade
The composite is a weighted blend of 9 inputs, each scored 0–100. Each bar is that input's sub-score; the figure is the points it added to the 100-point composite (weight × sub-score).
- Cash flow +30.0/30.0
- 1% rule +10.0/10.0
- DSCR +10.0/10.0
- ARV discount +7.5/15.0
- Schools +5.1/10.0
- Livability +3.2/5.0
- Rent growth +2.5/5.0
- Condition / age +2.5/5.0
- Appreciation +0.0/10.0
$779,000
🖨 Deal sheet (PDF) 📄 Offer letter ✓ Due diligence
Listing remarks MLS
Lovely Sanford plan, by Streamline Developers features first floor owners' suite, large, open family room/kitchen/nook. Dining room or office space as you enter, of the front foyer. The second floor has a spacious 3 additional bedrooms, 2 full baths plus bonus. Neighborhood amenities include marina, observation pier, kayak launch, clubhouse, pool and playground.
Key facts
- Gated community
- Clubhouse
- Private marina
Tags
Property features AI
Finance
- Other: Community features: pool and street lights
- HOA & community: Homeowners association (annual fee); HOA amenities include barbecue, boat dock, clubhouse, game room, gated entry, grounds maintenance, management, marina, meeting room, park, picnic area, playground, RV parking and storage, and security; Association fee: $1,932 annually (approx. $161/month)
Exterior
- Parking: 2 parking spaces total; Attached 2-car garage with concrete floor and garage door opener; On-site parking
- Security: Community security (HOA)
- Utilities: Public water; Sewer connected; Natural gas available and connected; Underground utilities; Cable available; Water connected
- Home design: Single family residence; Two stories; Entry level: 1
- Construction: Fiber cement and frame construction; Shingle roof; Slab foundation; Built in (year not provided)
- Exterior features: Gas grill; Covered deck; Screened porch; Front porch; Level, wooded and landscaped lot; Waterfront access; Has view; Paved private road frontage
Interior
- Kitchen: Dishwasher; Gas range; Disposal; Vented exhaust fan; Kitchen island; Pantry; Eat-in kitchen
- Bedrooms: Master downstairs
- Bathrooms: 3 full bathrooms; 1 half bathroom; Accessible full bath
- Heating & cooling: Heat pump; Natural gas heating; Central air conditioning
- Interior features: Master suite on the main level; Walk-in closets; High ceilings; Entrance foyer; Kitchen island; Ceiling fans; Pantry; Built-in features; Eat-in kitchen; Wired for data; Window coverings; Gas log fireplace
- Laundry & utility: Laundry room; Gas water heater
Neighborhood map
What this means for you Summary
Snapshot
- This is a 4-bed/4.0-bath other listed at $779k.
Deal economics
- At list price, monthly cash flow is $7k ($83k/yr) — positive.
- The deal already cash-flows at list — no discount required.
- Meets the 1% rule at list price ($15k rent vs $779k).
- Cap rate 17.1% vs local median 22.6% in Broad Creek — below-typical yield; the buyer is paying a premium for something (appreciation thesis, condition, location) that the cap rate doesn't capture.
Location & tenants
- Location reads 64/100 on livability (#340 in NC) — a middle-class / working-renter tenant base. Strengths: crime A+, cost of living A+, housing A+; Watch: amenities F, commute F, health & safety D-.
- Carteret County Public Schools (rural): math 59% / reading 61% proficiency, ranked #31 of 178 in NC (top 17%) — acceptable for families but not a draw, mixed tenant base, ~2y average lease.
- Zoned schools: Bogue Sound Elementary (math 63% / reading 63%, grade B, #168 of 1,410 statewide, top 12%, 467 students, 99% FRL); Broad Creek Middle (math 63% / reading 68%, grade A-, #28 of 475 statewide, top 6%, 710 students, 100% FRL); Croatan High (math 82% / reading 78%, grade A, #73 of 535 statewide, top 13%, 974 students, 26% FRL) — zoned schools average 75% FRL vs 39% district-wide (36 pts higher); higher-poverty schools than district average — tighter screening recommended.
- Market conditions: 216 active listings in the ZIP; 935 units permitted in Carteret County in 2024 (360 in 5+ unit buildings).
- At $14,897/mo this rent would consume 255% of the median local household income ($70k/yr) (locally 461% of renters already pay >50% of income on rent) — very limited rent-growth headroom before tenants either downsize or default.
Forward outlook
- Local home prices are declining (-3.0%/yr); year-one equity from $5k of loan paydown is wiped out by about $23k of value loss. Plan a longer hold.
- Carteret County population projected at +9% by 2050 — modest demand growth; plan on rents tracking national, not racing it.
- At projected returns (-3.0% appreciation + 3.0% rent growth), your $218k cash investment doubles in ~4 years — after that, you're playing with house money.
Negotiation context
- Only 7 days on market — expect competitive offers; lowballing is unlikely to land.
- 3 sale attempts since 11y ago with the ask held roughly flat each time — persistent listings suggest the price (not the market) is what's stuck; bring a comps-based counter.
- Current owner paid $414k; list at $779k implies a 88% gain — meaningful room to come down on a strong offer.
Risks & watch-outs
- Watch-outs: flood insurance adds $66/mo.
- Climate carrying-cost: major flood risk; severe wind risk, 99% chance of damaging wind over 30y; extreme-heat days projected 7→20/yr by 2055 (HVAC capex compounding) — expect insurance premiums to compound above CPI over the hold.
Questions for the listing agent
- What's the actual annual flood-insurance premium (NFIP or private), and is the property in a SFHA with mandatory coverage?
- What does the HOA fee cover, when was the last increase, and are there any pending special assessments or reserve-fund shortfalls?
- Is there a deadline driving the sale (1031 exchange, divorce, estate, relocation)? That informs how much negotiation room exists.
- Schools are F-rated, which usually means shorter tenancies and higher turnover. Who's the typical renter profile here, and what's been the actual vacancy rate?
- What's the average days-on-market for RENTAL listings here right now (not sales)? A rising rental-DOM trend means longer vacancies and softer asking-rent achievability than the comps imply.
- What's the recent tenant-quality profile in this submarket — average credit score on applications, eviction rate, late-payment / NSF rate, and stable-employment percentage? A property-management company in the area should have these aggregated.
- How much new for-sale + rental construction is in the pipeline within 1–3 miles? Heavy new supply typically softens prices + rents 12–24 months out; constrained supply supports both.
Investment metrics
- 1% rule
- 1.91% ✓
- Cap rate
- 17.08%
- Cash-on-cash
- 38.52%
- DSCR
- 2.71
- GRM
- 4.4
CMA / ARV
No comps found within radius.
Projected returns pro-forma
-3.0% appreciation · 3.0% rent growth · sell at horizon
- IRR
- 34.2%
- Equity multiple
- 2.45×
- Total profit
- $315,320
- Equity at exit
- $116,151
- IRR
- 41.1%
- Equity multiple
- 4.86×
- Total profit
- $842,831
- Equity at exit
- $67,354
Cash invested: $218,120 (down + closing). Projections, not guarantees.
Landlord ↔ Tenant lean methodology
- Overall (STATE)
- 85 Strongly Landlord-Friendly
- State North Carolina
- 85 Strongly Landlord-Friendly · R+3
- County
- — inherits STATE
- City
- — inherits STATE
ZIP-level market 28570
- Home prices YoY
- -16.2%
- Active inventory
- 216
- Price-to-rent
- 4.4×
Monthly cashflow live
- Estimated rent
- $14,897 medium interval (Pro) →
- Mortgage (P&I)
- −$4,085
- Tax from tax record
- −$197 /mo · $2,364/yr
- Insurance
- −$325
- Flood insurance flood zone
- −$66 /mo · $798/yr
- HOA
- −$161
- Vacancy / Maint / Mgmt
- −$3,128
- Net cashflow
- $6,935
Break-even live
Sensitivity live
| Price | -10% $7,376 | -5% $7,155 | +0% $6,935 | +5% $6,714 | +10% $6,494 |
|---|---|---|---|---|---|
| Rent | -10% $5,758 | -5% $6,346 | +0% $6,935 | +5% $7,523 | +10% $8,111 |
| Rate | -1.0pp $7,327 | -0.5pp $7,133 | base $6,935 | +0.5pp $6,733 | +1.0pp $6,527 |
UW: 25.0% down · 7.5% · 30yr · 1.5% tax · 5.0% vac · 8.0% maint · 8.0% mgmt
Financing live
Cash to close
- Down payment
- $194,750
- Closing costs
- $23,370
- Reserves months
- —
- Total cash needed
- —
Loan-product check · same deal, 3 products live
Conventional
25% down · 7.5% · 30yr
- Down + closing
- —
- Monthly P&I
- —
- Monthly cashflow
- —
- DSCR
- —
- Eligible?
- —
Personal DTI + credit; lowest rate.
DSCR
20% down · 8.5% · 30yr
- Down + closing
- —
- Monthly P&I
- —
- Monthly cashflow
- —
- DSCR
- —
- Eligible?
- —
No personal income docs; deal must DSCR.
Hard money
10% down · 12.0% · 12mo
- Down + closing
- —
- Monthly P&I
- —
- Monthly cashflow
- —
- DSCR
- —
- Eligible?
- —
Short-term bridge; refi at stabilization.
HOA detail
- Monthly dues
- $161 · $1,932/yr
- Likely covers
- pool
Listing history 7 events
-
2026-06-19days on market $779,000 Active 7 DOM
-
2026-06-18days on market $779,000 Active 6 DOM
-
2026-06-17days on market $779,000 Active 5 DOM
-
2026-06-16days on market $779,000 Active 4 DOM
-
2026-06-15days on market $779,000 Active 3 DOM
-
2026-06-13remarks 695-char remark
-
2026-06-13$779,000 Active 1 DOM
ⓘ Source: listings_history table (triggers on properties + properties_extension) + one-shot
backfill from property_details.listing_events for pre-trigger history.
Tax reassessment forecast NC · Resets to sale price
- Current annual tax
- $2,364 · $197/mo
- Projected year-2 tax
- $6,388 · $532/mo
- Expected delta
- +$4,024/yr (+$335/mo · 170.3%)
ⓘ Screening estimate from a state-policy table — verify with the county assessor before closing.
Climate risk First Street
- Flood 7/10 Severe FEMA zone X (shaded) · 96% chance over 30 yrs
- Wildfire 3/10 Moderate
- Heat 9/10 Extreme 7 d/yr ≥102°F today · 20 d/yr by 30 yrs out
- Wind 8/10 Severe 99% chance of damaging wind over 30 yrs
- Air quality 2/10 Low 2 unhealthy d/yr today · 2 by 30 yrs out
Nearby sold comps map
Loading sold comps map…
Walkable amenities ~0.75 mi
Loading nearby amenities…
Taxation est. · year 1
- Rental income
- $178,765
- − Mortgage interest
- −$43,636
- − Property taxes
- −$2,364
- − Insurance
- −$4,692
- − Repairs & maintenance
- −$14,301
- − Management
- −$14,301
- − HOA
- −$1,932
- − Depreciation
- −$22,662
- Taxable income
- $74,877
- Est. tax owed @ 24.0%
- −$17,970
- After-tax cash flow
- $65,244/yr
For passive investors: Depreciation is non-cash, so a rental often shows a tax loss while cash-flowing — sheltering income. Rental losses are passive: they offset passive income freely, and up to $25,000/yr can offset ordinary (W-2) income if you actively participate and your MAGI is under $100k (phasing out to $0 by $150k); unused losses carry forward. On sale, claimed depreciation is recaptured at up to 25%, and gains may owe capital-gains tax (a 1031 exchange can defer both). Figures are a year-1 estimate at your 24.0% rate — not tax advice; consult a CPA.
Schools (NCES district)
- District
- Carteret County Public Schools
- NCES district ID
- 3700630
- Math proficiency
- 59% ▲ 5.00%
- Reading proficiency
- 61% ▲ 2.00%
- Median HH income
- $48,330
- Composite
- 50.92/100
- National rank
- #1786
- State rank
- #31 of 178 in NC
Livability — Broad Creek
- Score
- 64/100
- State rank
- #340
- US rank
- #13718
Category grades
Schools grade is shown separately in the Schools card above.
Census & demographics
- County
- Carteret County · 52,389 people
- Metro
- Morehead City, NC
- Population (ZIP)
- 22,197
- Household income
- $70,229
- Rent vs Own
- Severe rent burden
- 461.0
Population outlook (Carteret County) Hauer SSP2
- Today (2025)
- 73,443 people
- By 2030
- 75,344 · +2.6%
- By 2040
- 78,142 · +6.4%
- By 2050
- 80,091 · +9.1%
- By 2075
- 86,120 · +17.3%
- By 2100
- 89,408 · +21.7%
Race, ethnicity, and origin ACS 2023
- Neighborhood character
- Predominantly White (82%)
- Race & ethnicity
- White 82% Hispanic / Latino 7% Two or more races 6% Black 3% Asian 1%
- Hispanic origin (detail)
- Mexican 4%
- Common ancestry
- Slovak 3% Romanian 3% Lithuanian 2%
- Foreign-born
- 5% · Canada, Dominican Republic
- Languages at home
- 92% English-only · Spanish 6% German/W. Germanic 1%
Political lean MEDSL · Carteret
- 2024 margin
- Solid R (+43.1) · D 28.0% · R 71.1%
- 2008→2024 swing
- -8.4pp toward R · 2008: -34.7pp · 2024: -43.1pp
- All cycles
- 2024: R+43.1 2020: R+42.0 2016: R+44.5 2012: R+41.0 2008: R+34.7
Not yet ingested
- Civics
- —
Market trends
- HPI YoY
- ▼ -53.54%
- Current HPI
- 276.6589
- Rent YoY
- —
- Metro
- Morehead City, NC
- State GDP YoY
- ▲ 3.28%
- F500 in state
- 26
Industry mix (Fortune 500 HQ in NC)
| Industry | F500 HQs | Revenue |
|---|---|---|
| Financial Services | 2 | $213B |
|
||
| Retail | 2 | $95B |
|
||
| Industrial Conglomerate | 1 | $38B |
|
||
| Metals / Steel | 1 | $35B |
|
||
| Utilities | 1 | $30B |
|
||
| Industrial Machinery | 1 | $19B |
|
||
Price history
+697.7% since first listed5 events — show timeline
- 2026-06-12 Listed $779,000 Hive MLS
- 2018-07-23 Sold (MLS) $414,032 Hive MLS
- 2018-01-16 Listed $411,600 Hive MLS
- 2016-05-21 Listing Removed — Hive MLS
- 2015-10-02 Listed $97,650 Hive MLS
Property tax history
+42.4%/yrLatest (2025): $2,364 · +28.4% YoY. Source: county tax records.
Cash-flow waterfall
monthlySold comps — $/sqft
last 12 mo · ≤1 miLoading sold comps…