 🏗️ New Construction
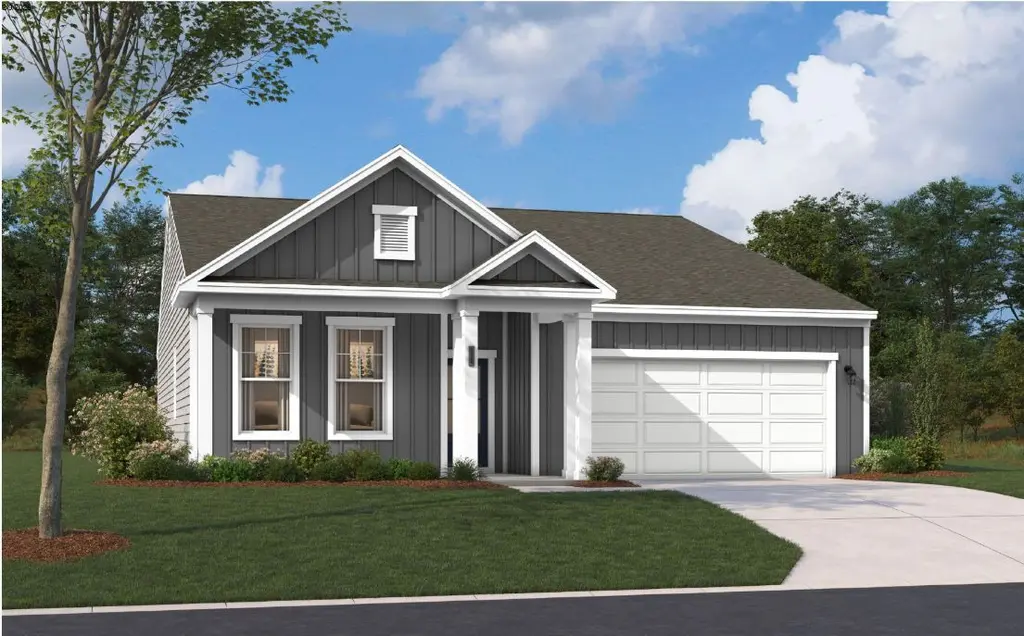
The Juniper II Plan · Edmund, SC
Flood risk No data
- FEMA flood zone
- —
- Chance of flooding over 30 yrs
- —
- Est. flood insurance / yr
- —
Fire risk No data
- Est. fire insurance / yr
- —
Heat risk No data
- Hot days now (above threshold)
- —
- Hot days in 30 yrs
- —
Wind risk No data
- Chance of severe wind over 30 yrs
- —
Air-quality risk No data
- Unhealthy air days now
- —
- Unhealthy air days in 30 yrs
- —
Risk factors via First Street. Map © Google.
Why this score? — see what drove the D+ grade
The composite is a weighted blend of 9 inputs, each scored 0–100. Each bar is that input's sub-score; the figure is the points it added to the 100-point composite (weight × sub-score).
- Cash flow +15.7/30.0
- ARV discount +7.5/15.0
- DSCR +4.8/10.0
- 1% rule +4.3/10.0
- Condition / age +4.0/5.0
- Rent growth +3.3/5.0
- Schools +2.9/10.0
- Livability +2.5/5.0
- Appreciation +0.0/10.0
$258,900
🖨 Deal sheet (PDF) 📄 Offer letter ✓ Due diligence
Listing remarks
Welcome to The Juniper II, a stunning single-family home that embodies the essence of modern living with a thoughtful layout designed for comfort and convenience. As you enter, you are greeted by a welcoming foyer that leads to a well-planned wing featuring two secondary bedrooms and a full bath, perfect for family members, guests, or even a quiet study area. Beyond the laundry room and the entry to the two-car garage, a versatile third bedroom awaits, ideal for use as a home office, hobby space, or a private guest retreat. This layout ensures that every member of the household enjoys their own space while maintaining a sense of togetherness. At the heart of The Juniper II lies an open-conc
Key facts
- Open concept kitchen
- Ensuite bath
- Covered patio
Tags
Property features AI
Finance
- Other: Inventory type: Plan (new construction inventory)
- Financial info: List price $258,900
Exterior
- Parking: 2 garage spaces; 2 total parking spaces
- Home design: Single-family plan (The Juniper II); Addressed in Lexington, SC (29073)
- Exterior features: Living area approximately 1,850
Interior
- Bedrooms: 4 bedrooms
- Bathrooms: 2 full bathrooms
- Interior features: Plan: The Juniper II
Neighborhood map
What this means for you Summary
Snapshot
- This is a 4-bed/2.0-bath single-family listed at $259k. Condition is rated good.
Deal economics
- At list price, monthly cash flow is $115 ($1k/yr) — positive.
- The deal already cash-flows at list — no discount required.
- To meet the 1% rule (rent ≥ 1% of price), the offer needs to be $241k (6.9% below list).
- Recommended offer: $241k (6.9% below list) — sets the bar for 1% rule.
Location & tenants
- Location reads: area grade D — affects rentability + tenant quality, not the cash-flow math above.
- Lexington 02 (suburban): math 30% / reading 38% proficiency, ranked #45 of 80 in SC (top 56%) — families likely to look elsewhere, expect single-tenant / working-renter base with shorter leases.
- Zoned schools: Congaree Elementary (math 27% / reading 24%, grade F, #444 of 597 statewide, top 75%, 368 students, 100% FRL); R. H. Fulmer Middle (math 30% / reading 39%, grade F, #107 of 229 statewide, top 47%, 568 students, 100% FRL); Airport High (math 40% / reading 79%, grade C+, #110 of 196 statewide, top 58%, 1,428 students, 84% FRL) — zoned schools average 95% FRL vs 59% district-wide (36 pts higher); higher-poverty schools than district average — tighter screening recommended.
- Market conditions: Rents rising (+3.2%/yr); 572 active listings in the ZIP; 2 comparable units currently listed for rent nearby; solid renter incomes; 1,712 units permitted in Lexington County in 2024 (0 in 5+ unit buildings).
- This rent runs 37% of the median local income ($77k/yr) — at the standard rent-burdened threshold; future hikes will face affordability resistance.
Forward outlook
- Local home prices are declining (-3.0%/yr); year-one equity from $2k of loan paydown is wiped out by about $8k of value loss. Plan a longer hold.
- Lexington County population projected at +26% by 2050 — long-run rental-demand tailwind backs the buy-and-hold thesis.
Negotiation context
- Only 13 days on market — expect competitive offers; lowballing is unlikely to land.
Questions for the listing agent
- Is there a deadline driving the sale (1031 exchange, divorce, estate, relocation)? That informs how much negotiation room exists.
- The area grade is low — what's the realistic commute time and amenity access for the typical tenant pool here? Any planned neighborhood developments (good or bad) we should know about?
- What's the average days-on-market for RENTAL listings here right now (not sales)? A rising rental-DOM trend means longer vacancies and softer asking-rent achievability than the comps imply.
- What's the recent tenant-quality profile in this submarket — average credit score on applications, eviction rate, late-payment / NSF rate, and stable-employment percentage? A property-management company in the area should have these aggregated.
- How much new for-sale + rental construction is in the pipeline within 1–3 miles? Heavy new supply typically softens prices + rents 12–24 months out; constrained supply supports both.
Investment metrics
- 1% rule
- 0.93% ✗
- Cap rate
- 6.83%
- Cash-on-cash
- 1.90%
- DSCR
- 1.08
- GRM
- 9.0
CMA / ARV
No comps found within radius.
Projected returns pro-forma
-3.0% appreciation · 3.24% rent growth · sell at horizon
- IRR
- -13.0%
- Equity multiple
- 0.53×
- Total profit
- $-34,006
- Equity at exit
- $38,603
- IRR
- -3.6%
- Equity multiple
- 0.76×
- Total profit
- $-17,623
- Equity at exit
- $22,385
Cash invested: $72,492 (down + closing). Projections, not guarantees.
Landlord ↔ Tenant lean methodology
- Overall (STATE)
- 90 Strongly Landlord-Friendly
- State South Carolina
- 90 Strongly Landlord-Friendly · R+6
- County
- — inherits STATE
- City
- — inherits STATE
ZIP-level market 29073
- Home prices YoY
- -19.1%
- Rents YoY
- 3.2%
- Active inventory
- 572
- Price-to-rent
- 9.0×
Monthly cashflow live
- Estimated rent
- $2,410 medium interval (Pro) →
- Mortgage (P&I)
- −$1,358
- Tax est. 1.5%
- −$324 /mo · $3,884/yr
- Insurance
- −$108
- HOA
- −$0
- Vacancy / Maint / Mgmt
- −$506
- Net cashflow
- $115
Break-even live
Sensitivity live
| Price | -10% $294 | -5% $205 | +0% $115 | +5% $26 | +10% $-64 |
|---|---|---|---|---|---|
| Rent | -10% $-75 | -5% $20 | +0% $115 | +5% $210 | +10% $305 |
| Rate | -1.0pp $245 | -0.5pp $181 | base $115 | +0.5pp $48 | +1.0pp $-20 |
UW: 25.0% down · 7.5% · 30yr · 1.5% tax · 5.0% vac · 8.0% maint · 8.0% mgmt
Financing live
Cash to close
- Down payment
- $64,725
- Closing costs
- $7,767
- Reserves months
- —
- Total cash needed
- —
Loan-product check · same deal, 3 products live
Conventional
25% down · 7.5% · 30yr
- Down + closing
- —
- Monthly P&I
- —
- Monthly cashflow
- —
- DSCR
- —
- Eligible?
- —
Personal DTI + credit; lowest rate.
DSCR
20% down · 8.5% · 30yr
- Down + closing
- —
- Monthly P&I
- —
- Monthly cashflow
- —
- DSCR
- —
- Eligible?
- —
No personal income docs; deal must DSCR.
Hard money
10% down · 12.0% · 12mo
- Down + closing
- —
- Monthly P&I
- —
- Monthly cashflow
- —
- DSCR
- —
- Eligible?
- —
Short-term bridge; refi at stabilization.
Rent comps 2 comps
| Address | Beds | Baths | Sqft | Rent | $/sqft | DOM | Units | Dist |
|---|---|---|---|---|---|---|---|---|
| 2237 Trakand Dr Lexington, SC | 3.0 | 2.5 | 1962 | $1,975 | $1.01 | 4d | 1 | 1.23mi |
| 307 Savannah Hills Dr Lexington, SC | 3.0 | 2.5 | 1612 | $1,985 | $1.23 | 25d | 1 | 1.28mi |
Listing history 10 events
-
2026-06-21days on market $258,900 Active 13 DOM
-
2026-06-18days on market $258,900 Active 10 DOM
-
2026-06-17days on market $258,900 Active 9 DOM
-
2026-06-16days on market $258,900 Active 8 DOM
-
2026-06-15days on market $258,900 Active 7 DOM
-
2026-06-14days on market $258,900 Active 5 DOM
-
2026-06-13days on market $258,900 Active 4 DOM
-
2026-06-10days on market $258,900 Active 2 DOM
-
2026-06-09remarks 699-char remark
-
2026-06-09$258,900 Active 1 DOM
ⓘ Source: listings_history table (triggers on properties + properties_extension) + one-shot
backfill from property_details.listing_events for pre-trigger history.
Nearby sold comps map
Loading sold comps map…
Walkable amenities ~0.75 mi
Loading nearby amenities…
Taxation est. · year 1
- Rental income
- $28,925
- − Mortgage interest
- −$14,502
- − Property taxes
- −$3,884
- − Insurance
- −$1,294
- − Repairs & maintenance
- −$2,314
- − Management
- −$2,314
- − Depreciation
- −$7,532
- Taxable loss
- −$2,915
- Est. tax savings @ 24.0%
- +$700
- After-tax cash flow
- $2,080/yr
For passive investors: Depreciation is non-cash, so a rental often shows a tax loss while cash-flowing — sheltering income. Rental losses are passive: they offset passive income freely, and up to $25,000/yr can offset ordinary (W-2) income if you actively participate and your MAGI is under $100k (phasing out to $0 by $150k); unused losses carry forward. On sale, claimed depreciation is recaptured at up to 25%, and gains may owe capital-gains tax (a 1031 exchange can defer both). Figures are a year-1 estimate at your 24.0% rate — not tax advice; consult a CPA.
Condition & rehab AI · 12 photos
This modern single-family home is in excellent condition with a good layout and high-end finishes. It is move-in ready and would benefit from some cosmetic updates to further enhance its value.
Value-add opportunities
- Both Painting the exterior and interior walls — Fresh paint can enhance curb appeal and interior aesthetics
- Both Updating the flooring in the bathrooms — Modern flooring can improve the look and feel of the bathrooms
- Both Upgrading the kitchen appliances — New appliances can make the kitchen more functional and appealing
Renovation cost estimate screening
Value-add ROI direction
- Both Painting the exterior and interior walls — Fresh paint can enhance curb appeal and interior aesthetics ↑
- Both Updating the flooring in the bathrooms — Modern flooring can improve the look and feel of the bathrooms ↑
- Both Upgrading the kitchen appliances — New appliances can make the kitchen more functional and appealing ↑
ⓘ Cost ranges are severity-bucket heuristics (US national rule-of-thumb). Get contractor quotes + a written scope before underwriting a rehab budget.
Schools (NCES district)
- District
- Lexington 02
- NCES district ID
- 4502730
- Math proficiency
- 30% ▼ -6.00%
- Reading proficiency
- 38% ▬ 0.00%
- Median HH income
- $42,532
- Composite
- 28.78/100
- National rank
- #6669
- State rank
- #45 of 80 in SC
Livability — Edmund
No livability data for this city. (Only ~50 U.S. cities are tracked.)
Census & demographics
- Census place
- Edmund, SC
- County
- Lexington County · 232,571 people
- Metro
- Columbia, SC
- Population (ZIP)
- 53,156
- Household income
- $77,229
- Rent vs Own
- Severe rent burden
- 935.0
Population outlook (Lexington County) Hauer SSP2
- Today (2025)
- 322,999 people
- By 2030
- 342,356 · +6.0%
- By 2040
- 377,715 · +16.9%
- By 2050
- 406,984 · +26.0%
- By 2075
- 465,447 · +44.1%
- By 2100
- 485,674 · +50.4%
Race, ethnicity, and origin ACS 2023
- Neighborhood character
- Predominantly White (72%)
- Race & ethnicity
- White 72% Black 14% Two or more races 7% Hispanic / Latino 6% Asian 2%
- Hispanic origin (detail)
- Mexican 2% Puerto Rican 1%
- Common ancestry
- Romanian 3% Italian 2% Slovak 1%
- Foreign-born
- 4% · Canada, China
- Languages at home
- 93% English-only · Spanish 5% Other Indo-European 1%
Political lean MEDSL · Lexington
- 2024 margin
- Solid R (+33.5) · D 32.5% · R 66.0% · Other 1.4%
- 2008→2024 swing
- +4.6pp toward D · 2008: -38.0pp · 2024: -33.5pp
- All cycles
- 2024: R+33.5 2020: R+30.1 2016: R+36.7 2012: R+37.8 2008: R+38.0
Not yet ingested
- Civics
- —
Market trends
- HPI YoY
- ▼ -59.20%
- Current HPI
- 249.8957
- Rent YoY
- ▲ 3.24%
- Metro
- Columbia, SC
- State GDP YoY
- ▲ 4.51%
- F500 in state
- 2
Industry mix (Fortune 500 HQ in SC)
| Industry | F500 HQs | Revenue |
|---|---|---|
| Packaging | 1 | $7B |
|
||
Cash-flow waterfall
monthlySold comps — $/sqft
last 12 mo · ≤1 miLoading sold comps…