572 Bear Paw Rd SW · Shallotte, NC
Flood risk 1/10 · Minimal
- FEMA flood zone
- X (unshaded)
- Chance of flooding over 30 yrs
- 0.0%
- Est. flood insurance / yr
- $507 – $1,088
Fire risk 6/10 · Moderate
- Est. fire insurance / yr
- $906 – $1,684
Heat risk 9/10 · Severe
- Hot days now (above 105°F)
- 7 days/yr
- Hot days in 30 yrs
- 19 days/yr
Wind risk 8/10 · Major
- Chance of severe wind over 30 yrs
- 99.0%
Air-quality risk 1/10 · Minimal
- Unhealthy air days now
- 0 days/yr
- Unhealthy air days in 30 yrs
- 0 days/yr
Risk factors via First Street. Map © Google.
Why this score? — see what drove the D+ grade
The composite is a weighted blend of 9 inputs, each scored 0–100. Each bar is that input's sub-score; the figure is the points it added to the 100-point composite (weight × sub-score).
- ARV discount +13.6/15.0
- Cash flow +12.5/30.0
- 1% rule +4.1/10.0
- Schools +3.9/10.0
- Condition / age +3.8/5.0
- DSCR +3.7/10.0
- Livability +3.2/5.0
- Rent growth +2.5/5.0
- Appreciation +0.0/10.0
$221,990
🖨 Deal sheet (PDF) 📄 Offer letter ✓ Due diligence
Listing remarks
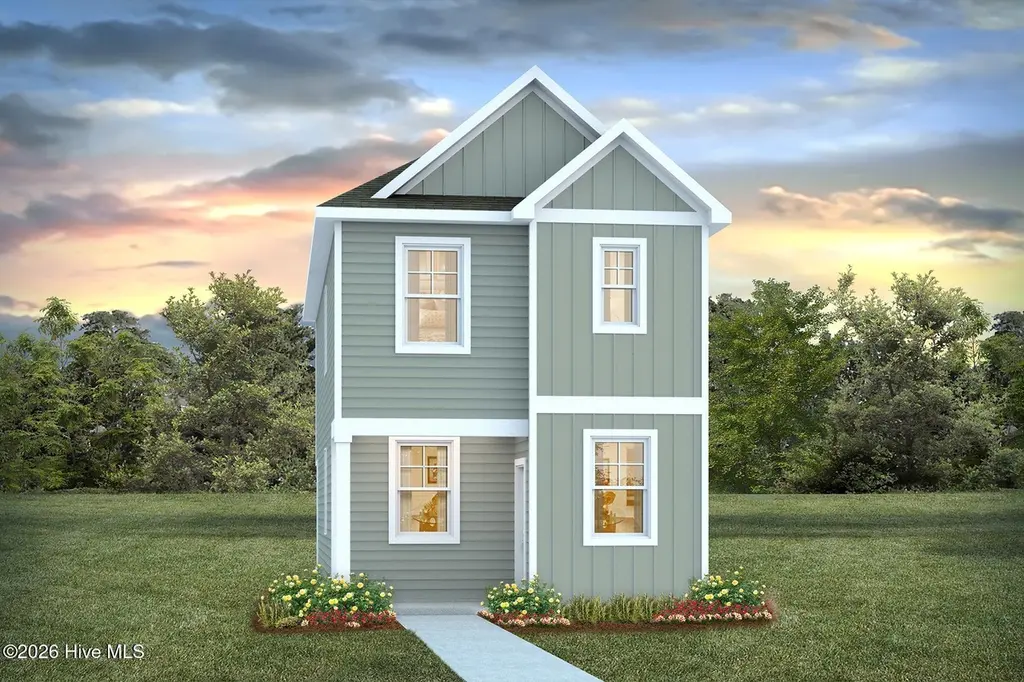
Welcome to Fox Run, offering new homes with thoughtful details and smart designs plus a convenient location. The Westport floor plan features an open flow between the kitchen, dining and living area that is great for entertaining. The well-designed floorplan offers the open concept layout and a space that can be decorated and lived-in in many ways. The kitchen comes complete with a center island, granite countertops, a pantry closet, , 36'' cabinets and stainless steel appliances including a refrigerator! Beautiful vinyl flooring throughout the first level main living areas! A second floor owner's suite is spacious with a walk in closet and a bathroom that features double sinks and 5' wal
Key facts
- Vinyl flooring
- 36 cabinets
- Granite countertops
Tags
Neighborhood map
What this means for you Summary
Snapshot
- This is a 3-bed/2.5-bath single-family listed at $222k. Condition is rated good.
Deal economics
- At list price, monthly cash flow is $-34 ($-407/yr) — negative.
- To cash-flow at today's rent, offer at most $217k (2.2% below list).
- To meet the 1% rule (rent ≥ 1% of price), the offer needs to be $201k (9.4% below list).
- Recommended offer: $201k (9.4% below list) — sets the bar for 1% rule.
- Cap rate 6.1% vs local median 4.0% in Shallotte — top-decile yield for the area; either an underpriced asset or a hidden risk that comps aren't pricing in. Stress-test before assuming the spread holds.
Location & tenants
- Location reads 63/100 on livability (#411 in NC) — a middle-class / working-renter tenant base. Strengths: cost of living A+, housing A+, employment B; Watch: health & safety D, crime F, amenities F.
- Brunswick County Schools (rural): math 45% / reading 47% proficiency, ranked #82 of 178 in NC (top 46%) — families likely to look elsewhere, expect single-tenant / working-renter base with shorter leases.
- Zoned schools: Supply Elementary (math 46% / reading 39%, grade F, #625 of 1,410 statewide, top 45%, 539 students, 99% FRL); Cedar Grove Middle (math 30% / reading 36%, grade F, #305 of 475 statewide, top 65%, 434 students, 99% FRL); West Brunswick High (math 50% / reading 56%, grade C-, #281 of 535 statewide, top 53%, 1,526 students, 100% FRL) — zoned schools average 100% FRL vs 53% district-wide (46 pts higher); higher-poverty schools than district average — tighter screening recommended.
- Market conditions: 513 active listings in the ZIP; 6,112 units permitted in Brunswick County in 2024 (990 in 5+ unit buildings).
- This rent runs 40% of the median local income ($60k/yr) — at the standard rent-burdened threshold; future hikes will face affordability resistance.
Forward outlook
- Local home prices are declining (-3.0%/yr); year-one equity from $2k of loan paydown is wiped out by about $7k of value loss. Plan a longer hold.
- Brunswick County population projected at +36% by 2050 — long-run rental-demand tailwind backs the buy-and-hold thesis.
Negotiation context
- Only 3 days on market — expect competitive offers; lowballing is unlikely to land.
Risks & watch-outs
- Climate carrying-cost: severe wind risk, 99% chance of damaging wind over 30y; major wildfire risk; extreme-heat days projected 7→19/yr by 2055 (HVAC capex compounding) — expect insurance premiums to compound above CPI over the hold.
Questions for the listing agent
- What do current leases actually rent for vs. the listed asking? Can we see a recent rent roll and the last 12 months of T-12 income?
- What does the HOA fee cover, when was the last increase, and are there any pending special assessments or reserve-fund shortfalls?
- Is there a deadline driving the sale (1031 exchange, divorce, estate, relocation)? That informs how much negotiation room exists.
- Crime grade is F in this area — have there been break-ins, vandalism, or insurance claims at this property in the last 3 years? What carrier currently insures it and at what premium?
- The area grade is low — what's the realistic commute time and amenity access for the typical tenant pool here? Any planned neighborhood developments (good or bad) we should know about?
- What's the average days-on-market for RENTAL listings here right now (not sales)? A rising rental-DOM trend means longer vacancies and softer asking-rent achievability than the comps imply.
- What's the recent tenant-quality profile in this submarket — average credit score on applications, eviction rate, late-payment / NSF rate, and stable-employment percentage? A property-management company in the area should have these aggregated.
- How much new for-sale + rental construction is in the pipeline within 1–3 miles? Heavy new supply typically softens prices + rents 12–24 months out; constrained supply supports both.
Investment metrics
- 1% rule
- 0.91% ✗
- Cap rate
- 6.11%
- Cash-on-cash
- -0.66%
- DSCR
- 0.97
- GRM
- 9.2
CMA / ARV
- ARV (on-the-fly)
- $257,052
- Comps found
- 12
Show comp detail 12 sales within ~0.75 mi
| Address | Dist | Beds/Ba | Sqft | Sold | Price | $/sf | Match |
|---|---|---|---|---|---|---|---|
| 390 Red Fox St NW | 0.33mi | 3/2.0 | 1,401 (+1%) | 14mo | $298,900 | $213 | 69 |
| 4580 Squirrel Ave NW | 0.45mi | 3/2.0 | 1,248 (-10%) | 1mo | $204,500 | $164 | 60 |
| 4496 East Coast Ln Unit 241- Kerry B | 0.71mi | 3/2.0 | 1,475 (+7%) | 7mo | $275,000 | $186 | 48 |
| 4496 Lot 241- Kerry B East Coast Ln | 0.71mi | 3/2.0 | 1,475 (+7%) | 7mo | $275,000 | $186 | 48 |
| 4243 Milkweed Rd | 0.68mi | 3/2.0 | 1,281 (-7%) | 10mo | $260,000 | $203 | 46 |
| 4243 Milkweed Rd Unit 256- Devon B | 0.68mi | 3/2.0 | 1,281 (-7%) | 10mo | $260,000 | $203 | 46 |
| 4470 East Coast Ln | 0.74mi | 3/2.0 | 1,475 (+7%) | 10mo | $282,000 | $191 | 44 |
| 4470 East Coast Ln | 0.74mi | 3/2.0 | 1,475 (+7%) | 10mo | $282,000 | $191 | 44 |
| 4477 East Coast Ln Unit 235- Kerry B | 0.75mi | 3/2.0 | 1,475 (+7%) | 11mo | $273,990 | $186 | 43 |
| 4477 Lot 235- Kerry B East Coast Ln | 0.75mi | 3/2.0 | 1,475 (+7%) | 11mo | $273,990 | $186 | 43 |
| 4262 Milkweed Rd Unit 252- Kerry B | 0.73mi | 3/2.0 | 1,475 (+7%) | 22mo | $268,000 | $182 | 35 |
| 4262 Lot 252- Kerry B Milkweed Rd | 0.74mi | 3/2.0 | 1,475 (+7%) | 22mo | $268,000 | $182 | 34 |
Match score weights: distance 35% · size 25% · config 20% · recency 20%. Top-matched comps best support the ARV.
Projected returns pro-forma
-3.0% appreciation · 3.0% rent growth · sell at horizon
- IRR
- -17.3%
- Equity multiple
- 0.39×
- Total profit
- $-38,049
- Equity at exit
- $33,099
- IRR
- -9.2%
- Equity multiple
- 0.43×
- Total profit
- $-35,570
- Equity at exit
- $19,194
Cash invested: $62,157 (down + closing). Projections, not guarantees.
Landlord ↔ Tenant lean methodology
- Overall (STATE)
- 85 Strongly Landlord-Friendly
- State North Carolina
- 85 Strongly Landlord-Friendly · R+3
- County
- — inherits STATE
- City
- — inherits STATE
ZIP-level market 28462
- Active inventory
- 513
- Price-to-rent
- 9.2×
Monthly cashflow live
- Estimated rent
- $2,012 medium interval (Pro) →
- Mortgage (P&I)
- −$1,164
- Tax est. 1.5%
- −$277 /mo · $3,330/yr
- Insurance
- −$92
- HOA
- −$89
- Vacancy / Maint / Mgmt
- −$422
- Net cashflow
- $-34
Break-even live
Sensitivity live
| Price | -10% $119 | -5% $43 | +0% $-34 | +5% $-111 | +10% $-187 |
|---|---|---|---|---|---|
| Rent | -10% $-193 | -5% $-113 | +0% $-34 | +5% $46 | +10% $125 |
| Rate | -1.0pp $78 | -0.5pp $23 | base $-34 | +0.5pp $-91 | +1.0pp $-150 |
UW: 25.0% down · 7.5% · 30yr · 1.5% tax · 5.0% vac · 8.0% maint · 8.0% mgmt
Financing live
Cash to close
- Down payment
- $55,498
- Closing costs
- $6,660
- Reserves months
- —
- Total cash needed
- —
Loan-product check · same deal, 3 products live
Conventional
25% down · 7.5% · 30yr
- Down + closing
- —
- Monthly P&I
- —
- Monthly cashflow
- —
- DSCR
- —
- Eligible?
- —
Personal DTI + credit; lowest rate.
DSCR
20% down · 8.5% · 30yr
- Down + closing
- —
- Monthly P&I
- —
- Monthly cashflow
- —
- DSCR
- —
- Eligible?
- —
No personal income docs; deal must DSCR.
Hard money
10% down · 12.0% · 12mo
- Down + closing
- —
- Monthly P&I
- —
- Monthly cashflow
- —
- DSCR
- —
- Eligible?
- —
Short-term bridge; refi at stabilization.
HOA detail
- Monthly dues
- $89 · $1,068/yr
Listing history 2 events
-
2026-03-11status Pending
-
2026-03-08$221,990 Active
ⓘ Source: listings_history table (triggers on properties + properties_extension) + one-shot
backfill from property_details.listing_events for pre-trigger history.
Climate risk First Street
- Flood 1/10 Low FEMA zone X (unshaded) · 0% chance over 30 yrs
- Wildfire 6/10 Major
- Heat 9/10 Extreme 7 d/yr ≥105°F today · 19 d/yr by 30 yrs out
- Wind 8/10 Severe 99% chance of damaging wind over 30 yrs
- Air quality 1/10 Low 0 unhealthy d/yr today · 0 by 30 yrs out
Nearby sold comps map
Loading sold comps map…
Walkable amenities ~0.75 mi
Loading nearby amenities…
Taxation est. · year 1
- Rental income
- $24,139
- − Mortgage interest
- −$12,435
- − Property taxes
- −$3,330
- − Insurance
- −$1,110
- − Repairs & maintenance
- −$1,931
- − Management
- −$1,931
- − HOA
- −$1,068
- − Depreciation
- −$6,458
- Taxable loss
- −$4,123
- Est. tax savings @ 24.0%
- +$990
- After-tax cash flow
- $582/yr
For passive investors: Depreciation is non-cash, so a rental often shows a tax loss while cash-flowing — sheltering income. Rental losses are passive: they offset passive income freely, and up to $25,000/yr can offset ordinary (W-2) income if you actively participate and your MAGI is under $100k (phasing out to $0 by $150k); unused losses carry forward. On sale, claimed depreciation is recaptured at up to 25%, and gains may owe capital-gains tax (a 1031 exchange can defer both). Figures are a year-1 estimate at your 24.0% rate — not tax advice; consult a CPA.
Condition & rehab AI · 2 photos
The home is in good condition with no major repairs needed. It has a good exterior, interior, and landscaping, making it a good candidate for a cosmetic renovation to further enhance its value.
Value-add opportunities
- Both Painting the exterior siding — Fresh paint can enhance the curb appeal and increase the home's value
- Both Landscaping improvements — Well-maintained landscaping can improve the home's curb appeal and increase its value
- Both Interior touch-ups — Fresh paint and minor touch-ups can improve the home's interior and increase its value
Renovation cost estimate screening
Value-add ROI direction
- Both Painting the exterior siding — Fresh paint can enhance the curb appeal and increase the home's value ↑
- Both Landscaping improvements — Well-maintained landscaping can improve the home's curb appeal and increase its value ↑
- Both Interior touch-ups — Fresh paint and minor touch-ups can improve the home's interior and increase its value ↑
ⓘ Cost ranges are severity-bucket heuristics (US national rule-of-thumb). Get contractor quotes + a written scope before underwriting a rehab budget.
Schools (NCES district)
- District
- Brunswick County Schools
- NCES district ID
- 3700420
- Math proficiency
- 45% ▲ 4.00%
- Reading proficiency
- 47% ▲ 4.00%
- Median HH income
- $47,494
- Composite
- 39.23/100
- National rank
- #4011
- State rank
- #82 of 178 in NC
Livability — Shallotte
- Score
- 63/100
- State rank
- #411
- US rank
- #15490
Category grades
Schools grade is shown separately in the Schools card above.
Census & demographics
- County
- Brunswick County · 131,536 people
- City population
- 11,219
- Metro
- Myrtle Beach-Conway-North Myrtle Beach, SC-NC
- Population (ZIP)
- 12,340
- Household income
- $60,349
- Rent vs Own
- Severe rent burden
- 269.0
Population outlook (Brunswick County) Hauer SSP2
- Today (2025)
- 152,111 people
- By 2030
- 165,705 · +8.9%
- By 2040
- 188,494 · +23.9%
- By 2050
- 206,228 · +35.6%
- By 2075
- 237,876 · +56.4%
- By 2100
- 251,451 · +65.3%
Race, ethnicity, and origin ACS 2023
- Neighborhood character
- Predominantly White (87%)
- Race & ethnicity
- White 87% Black 7% Two or more races 5% Hispanic / Latino 2%
- Common ancestry
- Slovak 4% Lithuanian 4% Serbian 2%
- Foreign-born
- 1% · Canada
- Languages at home
- 99% English-only · Spanish 1%
Political lean MEDSL · Brunswick
- 2024 margin
- Strong R (+24.9) · D 37.2% · R 62.0%
- 2008→2024 swing
- -6.9pp toward R · 2008: -17.9pp · 2024: -24.9pp
- All cycles
- 2024: R+24.9 2020: R+25.0 2016: R+28.7 2012: R+22.2 2008: R+17.9
Not yet ingested
- Civics
- —
Market trends
- HPI YoY
- ▼ -259.44%
- Current HPI
- 144.2462
- Rent YoY
- —
- Metro
- Myrtle Beach-Conway-North Myrtle Beach, SC-NC
- State GDP YoY
- ▲ 3.28%
- F500 in state
- 26
Industry mix (Fortune 500 HQ in NC)
| Industry | F500 HQs | Revenue |
|---|---|---|
| Financial Services | 2 | $213B |
|
||
| Retail | 2 | $95B |
|
||
| Industrial Conglomerate | 1 | $38B |
|
||
| Metals / Steel | 1 | $35B |
|
||
| Utilities | 1 | $30B |
|
||
| Industrial Machinery | 1 | $19B |
|
||
Price history
2 events — show timeline
- 2026-03-11 Pending — Hive MLS
- 2026-03-08 Listed $221,990 Hive MLS
Cash-flow waterfall
monthlySold comps — $/sqft
last 12 mo · ≤1 miLoading sold comps…