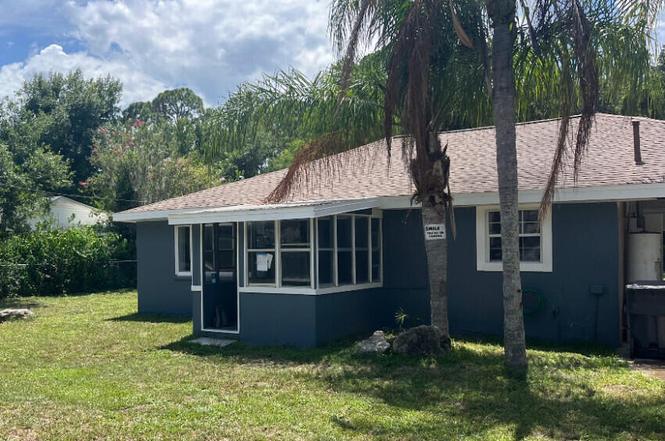
2852 Glenwood Ave · New Smyrna Beach, FL
Flood risk 8/10 · Major
- FEMA flood zone
- X (shaded)
- Chance of flooding over 30 yrs
- 0.97%
- Est. flood insurance / yr
- $507 – $1,088
Fire risk 3/10 · Minor
- Est. fire insurance / yr
- $947 – $1,759
Heat risk 9/10 · Severe
- Hot days now (above 105°F)
- 7 days/yr
- Hot days in 30 yrs
- 20 days/yr
Wind risk 10/10 · Severe
- Chance of severe wind over 30 yrs
- 99.0%
Air-quality risk 2/10 · Minimal
- Unhealthy air days now
- 1 days/yr
- Unhealthy air days in 30 yrs
- 1 days/yr
Risk factors via First Street. Map © Google.
Why this score? — see what drove the D grade
The composite is a weighted blend of 9 inputs, each scored 0–100. Each bar is that input's sub-score; the figure is the points it added to the 100-point composite (weight × sub-score).
- Cash flow +14.1/30.0
- ARV discount +7.5/15.0
- DSCR +4.3/10.0
- Rent growth +3.9/5.0
- Schools +3.9/10.0
- Livability +3.5/5.0
- 1% rule +3.4/10.0
- Condition / age +2.5/5.0
- Appreciation +0.0/10.0
$255,900
🖨 Deal sheet 📄 Offer letter ✓ Due diligence
Listing remarks
Newly remodeled 2 bed 1.5 Bath home in the quant city of New Smyrna Beach. Just west of A1A the home boasts a new kitchen, bathrooms, flooring and fixtures. Perfect for a beach getaway or first time home buyer.
Key facts
- New kitchen
- New flooring
- New fixtures
Tags
Neighborhood map
What this means for you Summary
Snapshot
- This is a 2-bed/1.0-bath single-family listed at $256k.
Deal economics
- At list price, monthly cash flow is $-30 ($-366/yr) — negative.
- To cash-flow at today's rent, offer at most $251k (2.1% below list).
- To meet the 1% rule (rent ≥ 1% of price), the offer needs to be $215k (16.1% below list).
- Recommended offer: $215k (16.1% below list) — sets the bar for 1% rule.
Location & tenants
- Location reads 69/100 on livability (#474 in FL) — a middle-class / working-renter tenant base. Strengths: crime A+, housing A+, employment B; Watch: amenities F, commute F, health & safety D-.
- Volusia (suburban): math 44% / reading 49% proficiency, ranked #47 of 73 in FL (top 64%) — families likely to look elsewhere, expect single-tenant / working-renter base with shorter leases.
- Market conditions: Rents rising fast (+5.6%/yr); 601 active listings in the ZIP; 3 comparable units currently listed for rent nearby; rentals at typical pace (median 15d on market — plan ~3-4 weeks tenant-placement turnaround); solid renter incomes; 3,402 units permitted in Volusia County in 2024 (681 in 5+ unit buildings).
- This rent runs 33% of the median local income ($77k/yr) — at the standard rent-burdened threshold; future hikes will face affordability resistance.
Forward outlook
- Local home prices are declining (-3.0%/yr); year-one equity from $2k of loan paydown is wiped out by about $8k of value loss. Plan a longer hold.
- Volusia County population projected at +19% by 2050 — long-run rental-demand tailwind backs the buy-and-hold thesis.
Negotiation context
- It's been on market 217 days — a 12% lower offer ($225k) is reasonable based on typical stale-listing flexibility.
- 12 sale attempts since 6y ago with the ask held roughly flat each time — persistent listings suggest the price (not the market) is what's stuck; bring a comps-based counter.
- Current owner paid $185k; 38% above their basis — modest negotiation headroom, anchor on the comps not their cost.
Risks & watch-outs
- Watch-outs: flood insurance adds $66/mo; built in 1956 — expect roof / HVAC / electrical / plumbing capex.
- Climate carrying-cost: severe flood risk; severe wind risk, 99% chance of damaging wind over 30y; extreme-heat days projected 7→20/yr by 2055 (HVAC capex compounding) — expect insurance premiums to compound above CPI over the hold.
Questions for the listing agent
- What do current leases actually rent for vs. the listed asking? Can we see a recent rent roll and the last 12 months of T-12 income?
- It's been on market 217 days. Have you received any prior offers? Is the seller open to a 16% concession, seller financing, or rate buy-down credit?
- Built in 1956 — when were the roof, HVAC, electrical panel, plumbing, and water heater last replaced?
- What's the actual annual flood-insurance premium (NFIP or private), and is the property in a SFHA with mandatory coverage?
- Why hasn't it sold? Are there any deal-killer items the seller is aware of (foundation, flood, title, zoning, code violations)?
- Is there a deadline driving the sale (1031 exchange, divorce, estate, relocation)? That informs how much negotiation room exists.
- Schools are B-rated — typically a magnet for longer-tenancy family renters. What's the average tenant stay here, and is there a school-zone premium baked into asking?
- The area grade is low — what's the realistic commute time and amenity access for the typical tenant pool here? Any planned neighborhood developments (good or bad) we should know about?
- What's the average days-on-market for RENTAL listings here right now (not sales)? A rising rental-DOM trend means longer vacancies and softer asking-rent achievability than the comps imply.
- What's the recent tenant-quality profile in this submarket — average credit score on applications, eviction rate, late-payment / NSF rate, and stable-employment percentage? A property-management company in the area should have these aggregated.
- How much new for-sale + rental construction is in the pipeline within 1–3 miles? Heavy new supply typically softens prices + rents 12–24 months out; constrained supply supports both.
Investment metrics
- 1% rule
- 0.84% ✗
- Cap rate
- 6.46%
- Cash-on-cash
- 0.60%
- DSCR
- 1.03
- GRM
- 9.9
CMA / ARV
No comps found within radius.
Projected returns pro-forma
-3.0% appreciation · 5.6% rent growth · sell at horizon
- IRR
- -14.3%
- Equity multiple
- 0.47×
- Total profit
- $-37,642
- Equity at exit
- $38,156
- IRR
- -1.9%
- Equity multiple
- 0.86×
- Total profit
- $-10,321
- Equity at exit
- $22,126
Cash invested: $71,652 (down + closing). Projections, not guarantees.
Landlord ↔ Tenant lean methodology
- Overall (STATE)
- 87 Strongly Landlord-Friendly
- State Florida
- 87 Strongly Landlord-Friendly · R+3
- County
- — inherits STATE
- City
- — inherits STATE
ZIP-level market 32168
- Home prices YoY
- -27.0%
- Rents YoY
- 5.6%
- Active inventory
- 601
- Price-to-rent
- 9.9×
Monthly cashflow live
- Estimated rent
- $2,146 medium interval (Pro) →
- Mortgage (P&I)
- −$1,342
- Tax from tax record
- −$211 /mo · $2,530/yr
- Insurance
- −$107
- Flood insurance flood zone
- −$66 /mo · $798/yr
- HOA
- −$0
- Vacancy / Maint / Mgmt
- −$451
- Net cashflow
- $-30
Break-even live
UW: 25.0% down · 7.5% · 30yr · 1.5% tax · 5.0% vac · 8.0% maint · 8.0% mgmt
Financing live
Cash to close
- Down payment
- $63,975
- Closing costs
- $7,677
- Reserves months
- —
- Total cash needed
- —
Loan-product check · same deal, 3 products live
Conventional
25% down · 7.5% · 30yr
- Down + closing
- —
- Monthly P&I
- —
- Monthly cashflow
- —
- DSCR
- —
- Eligible?
- —
Personal DTI + credit; lowest rate.
DSCR
20% down · 8.5% · 30yr
- Down + closing
- —
- Monthly P&I
- —
- Monthly cashflow
- —
- DSCR
- —
- Eligible?
- —
No personal income docs; deal must DSCR.
Hard money
10% down · 12.0% · 12mo
- Down + closing
- —
- Monthly P&I
- —
- Monthly cashflow
- —
- DSCR
- —
- Eligible?
- —
Short-term bridge; refi at stabilization.
Rent comps 3 comps
| Address | Beds | Baths | Sqft | Rent | $/sqft | DOM | Units | Dist |
|---|---|---|---|---|---|---|---|---|
| 2829 Nordman Ave New Smyrna Beach, FL | 3.0 | 2.0 | 1363 | $2,000 | $1.47 | 14d | 1 | 0.36mi |
| 603 Conrad Dr New Smyrna Beach, FL | 3.0 | 2.0 | 1206 | $2,100 | $1.74 | 14d | 1 | 0.50mi |
| 1007 Conrad Dr New Smyrna Beach, FL | 2.0 | 2.0 | 1100 | $2,400 | $2.18 | 23d | 1 | 0.64mi |
Listing history 43 events
-
2026-06-05statusdays on market $255,900 Pending 217 DOM
-
2026-06-03days on market $255,900 Active 216 DOM
-
2026-06-03status $255,900 Active 215 DOM
-
2026-04-08status Pending
-
2026-01-20status Active
-
2025-12-07historical
-
2025-08-29price $255,900
-
2025-07-22$257,900 Active
-
2025-07-17historical
-
2025-06-17price $257,900
-
2025-05-16price $259,900
-
2025-04-24price $264,900
-
2025-02-08price $268,900
-
2025-01-17$269,900 Active
-
2025-01-17historical
-
2024-12-13price $269,900
-
2024-11-14price $274,900
-
2024-10-03price $279,900
-
2024-08-28price $284,900
-
2024-08-09price $289,900
-
2024-07-16$299,900 Active
-
2024-03-12soldstatus $185,000
-
2024-03-11soldstatus $185,000 Closed
-
2024-03-11soldstatus $185,000 Closed
-
2024-02-16status Pending
-
2024-02-16status Pending
-
2024-02-02status Active
-
2024-02-02$215,000 Active
-
2024-01-09status Pending
-
2024-01-04$215,000 Active
-
2023-01-25soldstatus $201,000
-
2023-01-17soldstatus $201,000 Closed
-
2023-01-17soldstatus $201,000
-
2022-07-26historical Contingent
-
2022-07-23$195,000 Active
-
2022-07-23$195,000
-
2021-06-19status Pending
-
2021-06-18$229,900 Active
-
2020-08-03historical
-
2020-08-02historical
-
2020-03-18$179,000 Active
-
2020-03-18$179,000 Active
-
2010-12-20soldstatus $15,000
ⓘ Source: listings_history table (triggers on properties + properties_extension) + one-shot
backfill from property_details.listing_events for pre-trigger history.
Tax reassessment forecast FL · Resets to sale price
- Current annual tax
- $2,530 · $211/mo
- Projected year-2 tax
- $2,530 · $211/mo
- Expected delta
- $0/yr ($0/mo · 0.0%)
ⓘ Screening estimate from a state-policy table — verify with the county assessor before closing.
Climate risk First Street
- Flood 8/10 Severe FEMA zone X (shaded) · 97% chance over 30 yrs
- Wildfire 3/10 Moderate
- Heat 9/10 Extreme 7 d/yr ≥105°F today · 20 d/yr by 30 yrs out
- Wind 10/10 Extreme 99% chance of damaging wind over 30 yrs
- Air quality 2/10 Low 1 unhealthy d/yr today · 1 by 30 yrs out
Nearby sold comps map
Loading sold comps map…
Walkable amenities ~0.75 mi
Loading nearby amenities…
Taxation est. · year 1
- Rental income
- $25,753
- − Mortgage interest
- −$14,334
- − Property taxes
- −$2,530
- − Insurance
- −$2,077
- − Repairs & maintenance
- −$2,060
- − Management
- −$2,060
- − Depreciation
- −$7,444
- Taxable loss
- −$4,753
- Est. tax savings @ 24.0%
- +$1,141
- After-tax cash flow
- $775/yr
For passive investors: Depreciation is non-cash, so a rental often shows a tax loss while cash-flowing — sheltering income. Rental losses are passive: they offset passive income freely, and up to $25,000/yr can offset ordinary (W-2) income if you actively participate and your MAGI is under $100k (phasing out to $0 by $150k); unused losses carry forward. On sale, claimed depreciation is recaptured at up to 25%, and gains may owe capital-gains tax (a 1031 exchange can defer both). Figures are a year-1 estimate at your 24.0% rate — not tax advice; consult a CPA.
Schools (NCES district)
- District
- Volusia
- NCES district ID
- 1201920
- Math proficiency
- 44% ▼ -9.00%
- Reading proficiency
- 49% ▼ -3.00%
- Median HH income
- $42,946
- Composite
- 39.2/100
- National rank
- #4019
- State rank
- #47 of 73 in FL
Livability — New Smyrna Beach
- Score
- 69/100
- State rank
- #474
- US rank
- #8577
Category grades
Schools grade is shown separately in the Schools card above.
Census & demographics
- Census place
- New Smyrna Beach, FL
- County
- Volusia County · 556,871 people
- City population
- 42,039
- Metro
- Deltona-Daytona Beach-Ormond Beach, FL
- Population (ZIP)
- 31,847
- Household income
- $77,083
- Rent vs Own
- Severe rent burden
- 1139.0
Population outlook (Volusia County) Hauer SSP2
- Today (2025)
- 572,749 people
- By 2030
- 598,695 · +4.5%
- By 2040
- 644,880 · +12.6%
- By 2050
- 681,451 · +19.0%
- By 2075
- 759,957 · +32.7%
- By 2100
- 778,902 · +36.0%
Race, ethnicity, and origin ACS 2023
- Neighborhood character
- Predominantly White (85%)
- Race & ethnicity
- White 85% Hispanic / Latino 6% Black 5% Two or more races 4%
- Hispanic origin (detail)
- Mexican 2% Puerto Rican 1%
- Common ancestry
- Romanian 4% Italian 3% Lithuanian 2%
- Foreign-born
- 5% · Canada, Vietnam
- Languages at home
- 93% English-only · Spanish 5% Other Indo-European 1%
Political lean MEDSL · Volusia
- 2024 margin
- Strong R (+21.8) · D 38.7% · R 60.5%
- 2008→2024 swing
- -27.4pp toward R · 2008: 5.7pp · 2024: -21.8pp
- All cycles
- 2024: R+21.8 2020: R+14.1 2016: R+13.1 2012: R+1.2 2008: D+5.7
Not yet ingested
- Civics
- —
Market trends
- HPI YoY
- ▼ -129.58%
- Current HPI
- 350.4259
- Rent YoY
- ▲ 5.60%
- Metro
- Deltona-Daytona Beach-Ormond Beach, FL
- State GDP YoY
- ▲ 3.28%
- F500 in state
- 36
Industry mix (Fortune 500 HQ in FL)
| Industry | F500 HQs | Revenue |
|---|---|---|
| Industrial Technology | 2 | $29B |
|
||
| Insurance | 2 | $17B |
|
||
| Retail | 1 | $60B |
|
||
| Technology Distribution | 1 | $58B |
|
||
| Homebuilding | 1 | $35B |
|
||
| Technology Manufacturing | 1 | $35B |
|
||
Price history
+1606.0% since first listed40 events — show timeline
- 2026-04-08 Pending — Daytona MLS
- 2026-01-20 Relisted — Daytona MLS
- 2025-12-07 Listing Removed — Daytona MLS
- 2025-08-29 Price Changed $255,900 Daytona MLS
- 2025-07-22 Listed $257,900 Daytona MLS
- 2025-07-17 Listing Removed — Daytona MLS
- 2025-06-17 Price Changed $257,900 Daytona MLS
- 2025-05-16 Price Changed $259,900 Daytona MLS
- 2025-04-24 Price Changed $264,900 Daytona MLS
- 2025-02-08 Price Changed $268,900 Daytona MLS
- 2025-01-17 Listed $269,900 Daytona MLS
- 2025-01-17 Listing Removed — Daytona MLS
- 2024-12-13 Price Changed $269,900 Daytona MLS
- 2024-11-14 Price Changed $274,900 Daytona MLS
- 2024-10-03 Price Changed $279,900 Daytona MLS
- 2024-08-28 Price Changed $284,900 Daytona MLS
- 2024-08-09 Price Changed $289,900 Daytona MLS
- 2024-07-16 Listed $299,900 Daytona MLS
- 2024-03-12 Sold (Public Records) $185,000 Public Records
- 2024-03-11 Sold (MLS) $185,000 Stellar MLS as Distributed by MLS Grid
- 2024-03-11 Sold (MLS) $185,000 Daytona MLS
- 2024-02-16 Pending — Daytona MLS
- 2024-02-16 Pending — Stellar MLS as Distributed by MLS Grid
- 2024-02-02 Relisted — Stellar MLS as Distributed by MLS Grid
- 2024-02-02 Listed $215,000 Daytona MLS
- 2024-01-09 Pending — Stellar MLS as Distributed by MLS Grid
- 2024-01-04 Listed $215,000 Stellar MLS as Distributed by MLS Grid
- 2023-01-25 Sold (Public Records) $201,000 Public Records
- 2023-01-17 Sold (MLS) $201,000 Stellar MLS as Distributed by MLS Grid
- 2023-01-17 Sold (MLS) $201,000 NSBMLS
- 2022-07-26 Contingent — NSBMLS
- 2022-07-23 Listed $195,000 Stellar MLS as Distributed by MLS Grid
- 2022-07-23 Listed $195,000 NSBMLS
- 2021-06-19 Pending — Stellar MLS as Distributed by MLS Grid
- 2021-06-18 Listed $229,900 Stellar MLS as Distributed by MLS Grid
- 2020-08-03 Listing Removed — Daytona MLS
- 2020-08-02 Listing Removed — realMLS
- 2020-03-18 Listed $179,000 realMLS
- 2020-03-18 Listed $179,000 Daytona MLS
- 2010-12-20 Sold (Public Records) $15,000 Public Records
Property tax history
+13.1%/yrLatest (2025): $2,530 · +2.6% YoY. Source: county tax records.
Cash-flow waterfall
monthlySold comps — $/sqft
last 12 mo · ≤1 miLoading sold comps…