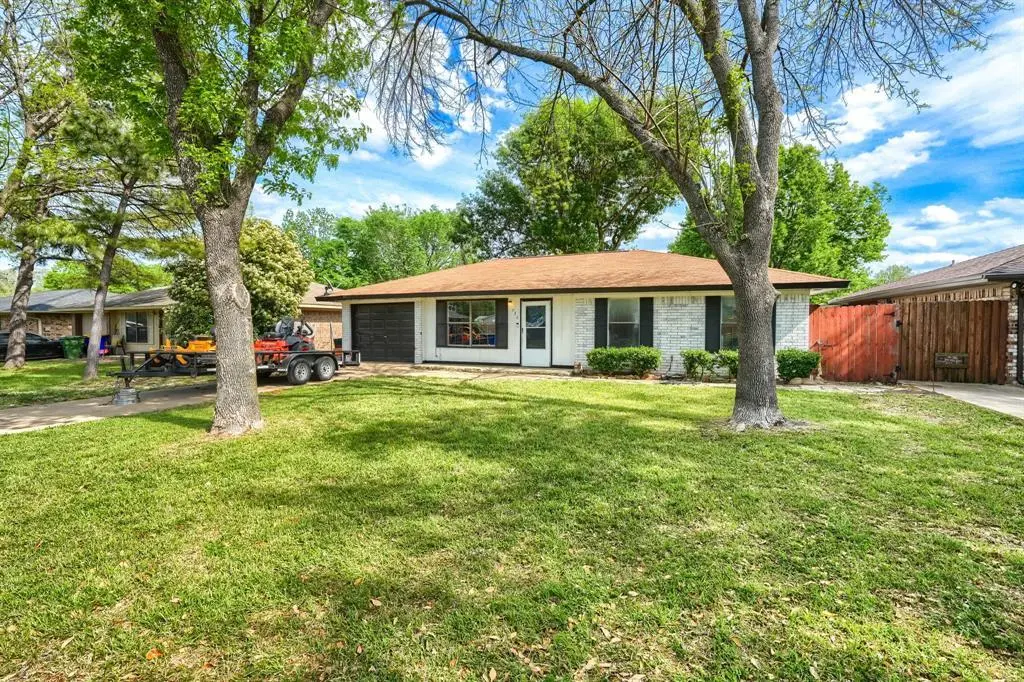
736 Thedford Rd · Seagoville, TX
Flood risk 1/10 · Minimal
- FEMA flood zone
- X (unshaded)
- Chance of flooding over 30 yrs
- 0.0%
- Est. flood insurance / yr
- $507 – $1,088
Fire risk 3/10 · Minor
- Est. fire insurance / yr
- $1,222 – $2,270
Heat risk 7/10 · Major
- Hot days now (above 110°F)
- 7 days/yr
- Hot days in 30 yrs
- 24 days/yr
Wind risk 6/10 · Moderate
- Chance of severe wind over 30 yrs
- 27.0%
Air-quality risk 2/10 · Minimal
- Unhealthy air days now
- 1 days/yr
- Unhealthy air days in 30 yrs
- 1 days/yr
Risk factors via First Street. Map © Google.
Why this score? — see what drove the B- grade
The composite is a weighted blend of 9 inputs, each scored 0–100. Each bar is that input's sub-score; the figure is the points it added to the 100-point composite (weight × sub-score).
- Cash flow +25.7/30.0
- ARV discount +15.0/15.0
- 1% rule +8.9/10.0
- DSCR +8.6/10.0
- Livability +3.6/5.0
- Schools +2.8/10.0
- Condition / age +2.5/5.0
- Rent growth +1.8/5.0
- Appreciation +0.0/10.0
$150,000
🖨 Deal sheet 📄 Offer letter ✓ Due diligence
Listing remarks MLS
Exceptional opportunity to transform this 3-bedroom, 1'5 bath home offering 1,027 sq. ft. of living space. With a desirable layout and a prime location, it’s an ideal project for buyers looking to renovate or invest. Sold AS-IS—bring your vision and restore its full potential.AGENT OR BUYER TO VERIFY ALL INFORMATION ON MLS, INFORMATION RELIABLE NOT GUARANTEED!
Key facts
- 7,187 sq ft lot
- Garage
- Built 1987
Neighborhood map
What this means for you Summary
Snapshot
- This is a 3-bed/1.5-bath single-family listed at $150k.
Deal economics
- At list price, monthly cash flow is $359 ($4k/yr) — positive.
- The deal already cash-flows at list — no discount required.
- Meets the 1% rule at list price ($2k rent vs $150k).
- Recommended offer: $141k (6.0% below list) — sets the bar for market timing.
- Cap rate 9.2% vs local median 5.1% in Seagoville — top-decile yield for the area; either an underpriced asset or a hidden risk that comps aren't pricing in. Stress-test before assuming the spread holds.
Location & tenants
- Location reads 71/100 on livability (#319 in TX) — a middle-class / working-renter tenant base. Strengths: cost of living A+, housing A+, crime A; Watch: schools D, amenities F, commute F.
- Dallas ISD (urban): math 31% / reading 36% proficiency, ranked #559 of 826 in TX (top 68%) — families likely to look elsewhere, expect single-tenant / working-renter base with shorter leases; 83% free/reduced lunch — lower-income household profile, screen leases tightly.
- Market conditions: Rents soft (-2.9%/yr); 280 active listings in the ZIP; 8 comparable units currently listed for rent nearby; rentals at typical pace (median 25d on market — plan ~3-4 weeks tenant-placement turnaround); 12,577 units permitted in Dallas County in 2024 (6,829 in 5+ unit buildings).
- This rent runs 34% of the median local income ($73k/yr) — at the standard rent-burdened threshold; future hikes will face affordability resistance.
Forward outlook
- Local home prices are declining (-3.0%/yr); year-one equity from $1k of loan paydown is wiped out by about $4k of value loss. Plan a longer hold.
- Dallas County population projected at +35% by 2050 — long-run rental-demand tailwind backs the buy-and-hold thesis.
Negotiation context
- It's been on market 61 days — a 6% lower offer ($141k) is reasonable based on typical stale-listing flexibility.
Risks & watch-outs
- Watch-outs: property tax is 3.5% of price.
- Climate carrying-cost: major wind risk, 27% chance of damaging wind over 30y; extreme-heat days projected 7→24/yr by 2055 (HVAC capex compounding) — expect insurance premiums to compound above CPI over the hold.
Questions for the listing agent
- It's been on market 61 days. Have you received any prior offers? Is the seller open to a 6% concession, seller financing, or rate buy-down credit?
- Property tax is high relative to price — has the assessment been appealed recently, and will the sale trigger a re-assessment?
- Why hasn't it sold? Are there any deal-killer items the seller is aware of (foundation, flood, title, zoning, code violations)?
- Is there a deadline driving the sale (1031 exchange, divorce, estate, relocation)? That informs how much negotiation room exists.
- Schools are D-rated, which usually means shorter tenancies and higher turnover. Who's the typical renter profile here, and what's been the actual vacancy rate?
- What's the average days-on-market for RENTAL listings here right now (not sales)? A rising rental-DOM trend means longer vacancies and softer asking-rent achievability than the comps imply.
- What's the recent tenant-quality profile in this submarket — average credit score on applications, eviction rate, late-payment / NSF rate, and stable-employment percentage? A property-management company in the area should have these aggregated.
- How much new for-sale + rental construction is in the pipeline within 1–3 miles? Heavy new supply typically softens prices + rents 12–24 months out; constrained supply supports both.
Investment metrics
- 1% rule
- 1.39% ✓
- Cap rate
- 9.16%
- Cash-on-cash
- 10.26%
- DSCR
- 1.46
- GRM
- 6.0
CMA / ARV
- ARV (median comp)
- $197,688
- List price
- $150,000
- Delta
- -24.12%
- Verdict
- UNDERPRICED
- Comps
- 20 within 1.0 mi
Show comp detail 12 sales within ~0.75 mi
| Address | Dist | Beds/Ba | Sqft | Sold | Price | $/sf | Match |
|---|---|---|---|---|---|---|---|
| 736 Thedford Rd | 0.00mi | 3/1.5 | 1,027 (0%) | 0mo | $150,000 | $146 | 100 |
| 730 High School Dr | 0.12mi | 3/1.0 | 1,033 (+1%) | 1mo | $165,000 | $160 | 91 |
| 747 High School Dr | 0.11mi | 3/2.0 | 1,092 (+6%) | 3mo | $199,999 | $183 | 80 |
| 815 Thedford | 0.18mi | 3/1.5 | 1,100 (+7%) | 7mo | $214,900 | $195 | 74 |
| 815 Quinette Dr | 0.18mi | 3/2.0 | 1,016 (-1%) | 18mo | $250,000 | $246 | 72 |
| 824 Johnnie Row | 0.51mi | 3/1.5 | 1,022 (-0%) | 8mo | $199,900 | $196 | 69 |
| 740 Quinette Dr | 0.06mi | 2/1.5 (-1) | 1,108 (+8%) | 14mo | $199,000 | $180 | 68 |
| 718 Judy Ln | 0.26mi | 3/1.0 | 1,088 (+6%) | 21mo | $165,000 | $152 | 58 |
| 1610 Woodhaven Dr | 0.65mi | 3/1.5 | 1,090 (+6%) | 6mo | $184,900 | $170 | 54 |
| 1311 Crosscreek | 0.51mi | 3/1.0 | 1,065 (+4%) | 21mo | $230,000 | $216 | 51 |
| 1328 Riverview Ln | 0.64mi | 3/1.5 | 1,114 (+8%) | 10mo | $255,000 | $229 | 47 |
| 1309 Bryan Pl | 0.60mi | 3/1.0 | 1,150 (+12%) | 12mo | $189,900 | $165 | 40 |
Match score weights: distance 35% · size 25% · config 20% · recency 20%. Top-matched comps best support the ARV.
Projected returns pro-forma
-3.0% appreciation · 0.0% rent growth · sell at horizon
- IRR
- -4.9%
- Equity multiple
- 0.82×
- Total profit
- $-7,373
- Equity at exit
- $22,365
- IRR
- 0.1%
- Equity multiple
- 1.00×
- Total profit
- $147
- Equity at exit
- $12,969
Cash invested: $42,000 (down + closing). Projections, not guarantees.
Landlord ↔ Tenant lean methodology
- Overall (STATE)
- 87 Strongly Landlord-Friendly
- State Texas
- 87 Strongly Landlord-Friendly · R+5
- County
- — inherits STATE
- City
- — inherits STATE
ZIP-level market 75159
- Home prices YoY
- -13.8%
- Rents YoY
- -2.9%
- Active inventory
- 280
- Price-to-rent
- 6.0×
Monthly cashflow live
- Estimated rent
- $2,086 high interval (Pro) →
- Mortgage (P&I)
- −$787
- Tax from tax record
- −$440 /mo · $5,280/yr
- Insurance
- −$62
- HOA
- −$0
- Vacancy / Maint / Mgmt
- −$438
- Net cashflow
- $359
Break-even live
UW: 25.0% down · 7.5% · 30yr · 1.5% tax · 5.0% vac · 8.0% maint · 8.0% mgmt
Financing live
Cash to close
- Down payment
- $37,500
- Closing costs
- $4,500
- Reserves months
- —
- Total cash needed
- —
Loan-product check · same deal, 3 products live
Conventional
25% down · 7.5% · 30yr
- Down + closing
- —
- Monthly P&I
- —
- Monthly cashflow
- —
- DSCR
- —
- Eligible?
- —
Personal DTI + credit; lowest rate.
DSCR
20% down · 8.5% · 30yr
- Down + closing
- —
- Monthly P&I
- —
- Monthly cashflow
- —
- DSCR
- —
- Eligible?
- —
No personal income docs; deal must DSCR.
Hard money
10% down · 12.0% · 12mo
- Down + closing
- —
- Monthly P&I
- —
- Monthly cashflow
- —
- DSCR
- —
- Eligible?
- —
Short-term bridge; refi at stabilization.
Rent comps 8 comps
| Address | Beds | Baths | Sqft | Rent | $/sqft | DOM | Units | Dist |
|---|---|---|---|---|---|---|---|---|
| 813 Huddleston Ct Seagoville, TX | 3.0 | 2.0 | 1460 | $1,855 | $1.27 | 3d | 1 | 0.23mi |
| 521 Jean Dr Seagoville, TX | 3.0 | 2.0 | 1080 | $1,825 | $1.69 | 3d | 1 | 0.38mi |
| 1304 Riverview Ln Seagoville, TX | 3.0 | 2.0 | 1490 | $1,899 | $1.27 | 24d | 1 | 0.50mi |
| 707 Shadybrook Ln Seagoville, TX | 3.0 | 2.0 | 1344 | $1,950 | $1.45 | 44d | 1 | 0.51mi |
| 702 Catherine Ln Seagoville, TX | 3.0 | 1.0 | 945 | $1,650 | $1.75 | 44d | 1 | 0.55mi |
| 1324 Bluffview Dr Unit C Seagoville, TX | 3.0 | 2.0 | 1150 | $1,295 | $1.13 | 24d | 1 | 0.61mi |
| 1610 Parkhaven Dr Seagoville, TX | 4.0 | 1.5 | 1450 | $1,695 | $1.17 | 15d | 1 | 0.62mi |
| 108 US HWY Seagoville, TX | 1.0–3.0 | 1.0–2.5 | 1340 | $2,650 | $1.98 | 1d | 48 | 1.09mi |
Listing history 17 events
-
2026-06-04status $150,000 Pending 61 DOM
-
2026-06-03days on market $150,000 Active 61 DOM
-
2026-06-02days on market $150,000 Active 60 DOM
-
2026-06-01days on market $150,000 Active 59 DOM
-
2026-05-31days on market $150,000 Active 58 DOM
-
2026-05-16price $150,000 374-char remark
Show marketing remark (374 chars)
Exceptional opportunity to transform this 3-bedroom, 1'5 bath home offering 1,027 sq. ft. of living space. With a desirable layout and a prime location, it’s an ideal project for buyers looking to renovate or invest. Sold AS-IS—bring your vision and restore its full potential.AGENT OR BUYER TO VERIFY ALL INFORMATION ON MLS, INFORMATION RELIABLE NOT GUARANTEED!
-
2026-05-15price $155,000 374-char remark
Show marketing remark (374 chars)
Exceptional opportunity to transform this 3-bedroom, 1'5 bath home offering 1,027 sq. ft. of living space. With a desirable layout and a prime location, it’s an ideal project for buyers looking to renovate or invest. Sold AS-IS—bring your vision and restore its full potential.AGENT OR BUYER TO VERIFY ALL INFORMATION ON MLS, INFORMATION RELIABLE NOT GUARANTEED!
-
2026-05-08price $165,000 374-char remark
Show marketing remark (374 chars)
Exceptional opportunity to transform this 3-bedroom, 1'5 bath home offering 1,027 sq. ft. of living space. With a desirable layout and a prime location, it’s an ideal project for buyers looking to renovate or invest. Sold AS-IS—bring your vision and restore its full potential.AGENT OR BUYER TO VERIFY ALL INFORMATION ON MLS, INFORMATION RELIABLE NOT GUARANTEED!
-
2026-04-29price $169,900 374-char remark
Show marketing remark (374 chars)
Exceptional opportunity to transform this 3-bedroom, 1'5 bath home offering 1,027 sq. ft. of living space. With a desirable layout and a prime location, it’s an ideal project for buyers looking to renovate or invest. Sold AS-IS—bring your vision and restore its full potential.AGENT OR BUYER TO VERIFY ALL INFORMATION ON MLS, INFORMATION RELIABLE NOT GUARANTEED!
-
2026-04-18price $174,900 374-char remark
Show marketing remark (374 chars)
Exceptional opportunity to transform this 3-bedroom, 1'5 bath home offering 1,027 sq. ft. of living space. With a desirable layout and a prime location, it’s an ideal project for buyers looking to renovate or invest. Sold AS-IS—bring your vision and restore its full potential.AGENT OR BUYER TO VERIFY ALL INFORMATION ON MLS, INFORMATION RELIABLE NOT GUARANTEED!
-
2026-04-12price $179,900 374-char remark
Show marketing remark (374 chars)
Exceptional opportunity to transform this 3-bedroom, 1'5 bath home offering 1,027 sq. ft. of living space. With a desirable layout and a prime location, it’s an ideal project for buyers looking to renovate or invest. Sold AS-IS—bring your vision and restore its full potential.AGENT OR BUYER TO VERIFY ALL INFORMATION ON MLS, INFORMATION RELIABLE NOT GUARANTEED!
-
2026-04-06price $185,000 374-char remark
Show marketing remark (374 chars)
Exceptional opportunity to transform this 3-bedroom, 1'5 bath home offering 1,027 sq. ft. of living space. With a desirable layout and a prime location, it’s an ideal project for buyers looking to renovate or invest. Sold AS-IS—bring your vision and restore its full potential.AGENT OR BUYER TO VERIFY ALL INFORMATION ON MLS, INFORMATION RELIABLE NOT GUARANTEED!
-
2026-04-03$190,000 Active 374-char remark
Show marketing remark (374 chars)
Exceptional opportunity to transform this 3-bedroom, 1'5 bath home offering 1,027 sq. ft. of living space. With a desirable layout and a prime location, it’s an ideal project for buyers looking to renovate or invest. Sold AS-IS—bring your vision and restore its full potential.AGENT OR BUYER TO VERIFY ALL INFORMATION ON MLS, INFORMATION RELIABLE NOT GUARANTEED!
-
2022-10-05soldstatus
-
2021-10-04soldstatus
-
2008-04-28soldstatus
-
1999-03-24soldstatus
ⓘ Source: listings_history table (triggers on properties + properties_extension) + one-shot
backfill from property_details.listing_events for pre-trigger history.
Tax reassessment forecast TX · Resets to sale price
- Current annual tax
- $5,280 · $440/mo
- Projected year-2 tax
- $5,280 · $440/mo
- Expected delta
- $0/yr ($0/mo · 0.0%)
ⓘ Screening estimate from a state-policy table — verify with the county assessor before closing.
Climate risk First Street
- Flood 1/10 Low FEMA zone X (unshaded) · 0% chance over 30 yrs
- Wildfire 3/10 Moderate
- Heat 7/10 Severe 7 d/yr ≥110°F today · 24 d/yr by 30 yrs out
- Wind 6/10 Major 27% chance of damaging wind over 30 yrs
- Air quality 2/10 Low 1 unhealthy d/yr today · 1 by 30 yrs out
Nearby sold comps map
Loading sold comps map…
Walkable amenities ~0.75 mi
Loading nearby amenities…
Taxation est. · year 1
- Rental income
- $25,034
- − Mortgage interest
- −$8,402
- − Property taxes
- −$5,280
- − Insurance
- −$750
- − Repairs & maintenance
- −$2,003
- − Management
- −$2,003
- − Depreciation
- −$4,364
- Taxable income
- $2,232
- Est. tax owed @ 24.0%
- −$536
- After-tax cash flow
- $3,771/yr
For passive investors: Depreciation is non-cash, so a rental often shows a tax loss while cash-flowing — sheltering income. Rental losses are passive: they offset passive income freely, and up to $25,000/yr can offset ordinary (W-2) income if you actively participate and your MAGI is under $100k (phasing out to $0 by $150k); unused losses carry forward. On sale, claimed depreciation is recaptured at up to 25%, and gains may owe capital-gains tax (a 1031 exchange can defer both). Figures are a year-1 estimate at your 24.0% rate — not tax advice; consult a CPA.
Schools (NCES district)
- District
- Dallas ISD
- NCES district ID
- 4816230
- Math proficiency
- 31% ▼ -16.00%
- Reading proficiency
- 36% ▼ -4.00%
- Median HH income
- $42,881
- Composite
- 28.41/100
- National rank
- #6763
- State rank
- #559 of 826 in TX
Livability — Seagoville
- Score
- 71/100
- State rank
- #319
- US rank
- #7103
Category grades
Schools grade is shown separately in the Schools card above.
Census & demographics
- Census place
- Seagoville, TX
- County
- Dallas County · 2,612,404 people
- City population
- 23,456
- Metro
- Dallas-Fort Worth-Arlington, TX
- Population (ZIP)
- 23,456
- Household income
- $72,897
- Rent vs Own
- Severe rent burden
- 422.0
Population outlook (Dallas County) Hauer SSP2
- Today (2025)
- 2,979,839 people
- By 2030
- 3,191,823 · +7.1%
- By 2040
- 3,619,611 · +21.5%
- By 2050
- 4,026,915 · +35.1%
- By 2075
- 4,957,073 · +66.4%
- By 2100
- 5,508,725 · +84.9%
Race, ethnicity, and origin ACS 2023
- Neighborhood character
- Diverse neighborhood (Simpson 0.66)
- Race & ethnicity
- Hispanic / Latino 46% White 32% Two or more races 20% Black 17%
- Hispanic origin (detail)
- Mexican 40%
- Common ancestry
- Romanian 1% Slovak 1% Italian 1%
- Foreign-born
- 17% · Canada, Jamaica
- Languages at home
- 63% English-only · Spanish 35%
Political lean MEDSL · Dallas
- 2024 margin
- Strong D (+22.2) · D 60.2% · R 38.0% · Other 1.8%
- 2008→2024 swing
- +6.9pp toward D · 2008: 15.3pp · 2024: 22.2pp
- All cycles
- 2024: D+22.2 2020: D+31.6 2016: D+26.2 2012: D+15.4 2008: D+15.3
Not yet ingested
- Civics
- —
Market trends
- HPI YoY
- ▼ -51.45%
- Current HPI
- 321.2065
- Rent YoY
- ▼ -2.86%
- Metro
- Dallas-Fort Worth-Arlington, TX
- State GDP YoY
- ▲ 3.95%
- F500 in state
- 110
Industry mix (Fortune 500 HQ in TX)
| Industry | F500 HQs | Revenue |
|---|---|---|
| Energy | 16 | $1,198B |
|
||
| Technology | 5 | $198B |
|
||
| Engineering / Construction | 4 | $72B |
|
||
| Energy Services | 3 | $60B |
|
||
| Utilities | 3 | $41B |
|
||
| Healthcare | 2 | $330B |
|
||
Price history
-21.1% since first listed12 events — show timeline
- 2026-05-16 Price Changed $150,000 NTREIS
- 2026-05-15 Price Changed $155,000 NTREIS
- 2026-05-08 Price Changed $165,000 NTREIS
- 2026-04-29 Price Changed $169,900 NTREIS
- 2026-04-18 Price Changed $174,900 NTREIS
- 2026-04-12 Price Changed $179,900 NTREIS
- 2026-04-06 Price Changed $185,000 NTREIS
- 2026-04-03 Listed $190,000 NTREIS
- 2022-10-05 Sold (Public Records) — Public Records
- 2021-10-04 Sold (Public Records) — Public Records
- 2008-04-28 Sold (Public Records) — Public Records
- 1999-03-24 Sold (Public Records) — Public Records
Property tax history
+8.9%/yrLatest (2025): $5,280 · +0.3% YoY. Source: county tax records.
Cash-flow waterfall
monthlySold comps — $/sqft
last 12 mo · ≤1 miLoading sold comps…