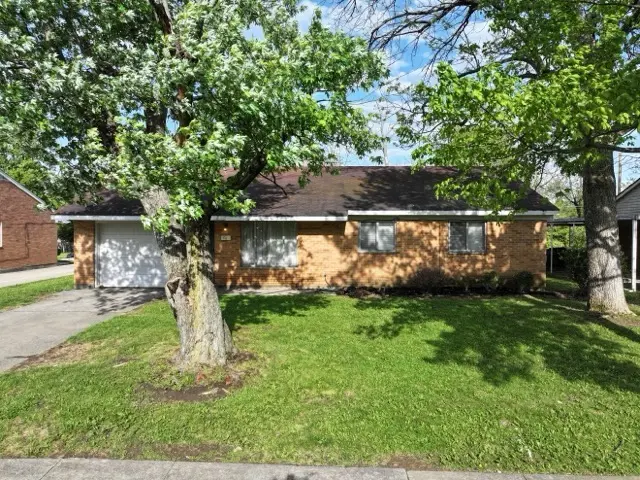
80 Brookhaven Dr · Trotwood, OH
Flood risk 1/10 · Minimal
- FEMA flood zone
- X (unshaded)
- Chance of flooding over 30 yrs
- 0.0%
- Est. flood insurance / yr
- $507 – $1,088
Fire risk 1/10 · Minimal
- Est. fire insurance / yr
- $713 – $1,323
Heat risk 3/10 · Minor
- Hot days now (above 102°F)
- 7 days/yr
- Hot days in 30 yrs
- 19 days/yr
Wind risk 2/10 · Minimal
- Chance of severe wind over 30 yrs
- 0.0%
Air-quality risk 3/10 · Minor
- Unhealthy air days now
- 3 days/yr
- Unhealthy air days in 30 yrs
- 4 days/yr
Risk factors via First Street. Map © Google.
Why this score? — see what drove the B grade
The composite is a weighted blend of 9 inputs, each scored 0–100. Each bar is that input's sub-score; the figure is the points it added to the 100-point composite (weight × sub-score).
- Cash flow +30.0/30.0
- ARV discount +15.0/15.0
- 1% rule +10.0/10.0
- DSCR +10.0/10.0
- Livability +3.0/5.0
- Rent growth +2.5/5.0
- Condition / age +2.5/5.0
- Schools +1.2/10.0
- Appreciation +0.0/10.0
$79,900
🖨 Deal sheet 📄 Offer letter ✓ Due diligence
Listing remarks
Investor special! This solid brick ranch offers a great opportunity for a fix-and-flip or rental investment. Featuring a spacious layout, attached garage, and large backyard, this property has strong potential with the right vision. The property needs renovation and is being sold as-is. Cash only. Priced to sell, don’t miss this value-add opportunity!
Key facts
- Needs renovation
- Attached garage
- Large backyard
Tags
Property features AI
Finance
- Other: Approximately 1–3 miles to nearest bus service
- Financial info: Offered for sale
Exterior
- Parking: No garage
- Utilities: Natural gas available; Sewer available; Public water available
- Home design: Single-story brick home
- Construction: Brick construction
- Exterior features: Residential zoning; Lot record dimensions noted
Interior
- Kitchen: Refrigerator; Galley layout; Laminate counters
- Bedrooms: Two main-level bedrooms (9 x 10 and 10 x 11)
- Flooring: Laminate counters noted (flooring not specified)
- Bathrooms: One full bathroom; One half bathroom; Two main-level bathrooms
- Heating & cooling: Forced air heating; Central air conditioning
- Interior features: Galley kitchen; Laminate counters
Neighborhood map
What this means for you Summary
Snapshot
- This is a 3-bed/1.5-bath single-family listed at $80k.
Deal economics
- At list price, monthly cash flow is $346 ($4k/yr) — positive.
- The deal already cash-flows at list — no discount required.
- Meets the 1% rule at list price ($1k rent vs $80k).
- Cap rate 11.5% vs local median 6.5% in Trotwood — top-decile yield for the area; either an underpriced asset or a hidden risk that comps aren't pricing in. Stress-test before assuming the spread holds.
Location & tenants
- Location reads 59/100 on livability (#1,014 in OH) — a working-class tenant base; expect higher turnover. Strengths: cost of living A+, housing A; Watch: employment D, schools F, crime F.
- Trotwood-Madison City (suburban): math 9% / reading 21% proficiency, ranked #645 of 656 in OH (top 98%) — low school quality limits family demand, transient renter base, plan for 1-2y turnover; 78% free/reduced lunch — lower-income household profile, screen leases tightly.
- Market conditions: 48 active listings in the ZIP; 8 comparable units currently listed for rent nearby; rentals leasing fast (median 12d on market — plan ~1-2 weeks tenant-placement turnaround); 907 units permitted in Montgomery County in 2024 (416 in 5+ unit buildings).
Forward outlook
- Local home prices are declining (-3.0%/yr); year-one equity from $552 of loan paydown is wiped out by about $2k of value loss. Plan a longer hold.
- Montgomery County population projected at -10% by 2050 — secular population decline; favor cash flow + early exit over multi-decade hold.
- At projected returns (-3.0% appreciation + 3.0% rent growth), your $22k cash investment doubles in ~7 years — after that, you're playing with house money.
Negotiation context
- Only 1 days on market — expect competitive offers; lowballing is unlikely to land.
Risks & watch-outs
- Watch-outs: property tax is 2.7% of price.
Questions for the listing agent
- Built in 1961 — when were the roof, HVAC, electrical panel, plumbing, and water heater last replaced?
- Property tax is high relative to price — has the assessment been appealed recently, and will the sale trigger a re-assessment?
- Is there a deadline driving the sale (1031 exchange, divorce, estate, relocation)? That informs how much negotiation room exists.
- Schools are F-rated, which usually means shorter tenancies and higher turnover. Who's the typical renter profile here, and what's been the actual vacancy rate?
- Crime grade is F in this area — have there been break-ins, vandalism, or insurance claims at this property in the last 3 years? What carrier currently insures it and at what premium?
- What's the average days-on-market for RENTAL listings here right now (not sales)? A rising rental-DOM trend means longer vacancies and softer asking-rent achievability than the comps imply.
- What's the recent tenant-quality profile in this submarket — average credit score on applications, eviction rate, late-payment / NSF rate, and stable-employment percentage? A property-management company in the area should have these aggregated.
- How much new for-sale + rental construction is in the pipeline within 1–3 miles? Heavy new supply typically softens prices + rents 12–24 months out; constrained supply supports both.
Investment metrics
- 1% rule
- 1.55% ✓
- Cap rate
- 11.49%
- Cash-on-cash
- 18.55%
- DSCR
- 1.83
- GRM
- 5.4
CMA / ARV
- ARV (on-the-fly)
- $142,740
- Comps found
- 12
Show comp detail 12 sales within ~0.75 mi
| Address | Dist | Beds/Ba | Sqft | Sold | Price | $/sf | Match |
|---|---|---|---|---|---|---|---|
| 80 Brookhaven Dr | 0.00mi | 3/1.5 | 1,170 (0%) | 1mo | $82,500 | $71 | 99 |
| 405 Stubbs Dr | 0.13mi | 3/1.5 | 1,170 (0%) | 10mo | $127,000 | $109 | 86 |
| 118 Stubbs Dr | 0.39mi | 3/2.0 | 1,100 (-6%) | 2mo | $189,900 | $173 | 68 |
| 6765 Little Richmond Rd | 0.61mi | 3/1.0 | 1,170 (0%) | 3mo | $125,000 | $107 | 67 |
| 16 Hillgard St | 0.57mi | 3/1.5 | 1,215 (+4%) | 3mo | $164,900 | $136 | 65 |
| 6750 Shadowbrook Dr | 0.58mi | 3/1.0 | 1,188 (+2%) | 5mo | $147,000 | $124 | 64 |
| 63 Soloman St | 0.50mi | 3/1.0 | 1,100 (-6%) | 1mo | $66,600 | $61 | 64 |
| 30 Whispering Dr | 0.55mi | 3/1.5 | 1,100 (-6%) | 2mo | $100,000 | $91 | 63 |
| 6760 Sandy Dr | 0.46mi | 3/1.0 | 1,107 (-5%) | 8mo | $135,000 | $122 | 61 |
| 98 Gump Pl | 0.66mi | 3/3.0 | 1,100 (-6%) | 0mo | $181,000 | $165 | 53 |
| 33 Mario Dr | 0.71mi | 3/2.0 | 1,080 (-8%) | 6mo | $179,900 | $167 | 47 |
| 17 Berry Dr | 0.74mi | 3/1.0 | 1,305 (+12%) | 10mo | $147,500 | $113 | 36 |
Match score weights: distance 35% · size 25% · config 20% · recency 20%. Top-matched comps best support the ARV.
Projected returns pro-forma
-3.0% appreciation · 3.0% rent growth · sell at horizon
- IRR
- 10.3%
- Equity multiple
- 1.41×
- Total profit
- $9,151
- Equity at exit
- $11,913
- IRR
- 19.5%
- Equity multiple
- 2.64×
- Total profit
- $36,615
- Equity at exit
- $6,908
Cash invested: $22,372 (down + closing). Projections, not guarantees.
Landlord ↔ Tenant lean methodology
- Overall (STATE)
- 73 Landlord-Friendly
- State Ohio
- 73 Landlord-Friendly · R+6
- County
- — inherits STATE
- City
- — inherits STATE
ZIP-level market 45426
- Home prices YoY
- -12.0%
- Active inventory
- 48
- Price-to-rent
- 5.4×
Monthly cashflow live
- Estimated rent
- $1,241 high interval (Pro) →
- Mortgage (P&I)
- −$419
- Tax from tax record
- −$182 /mo · $2,183/yr
- Insurance
- −$33
- HOA
- −$0
- Vacancy / Maint / Mgmt
- −$261
- Net cashflow
- $346
Break-even live
Sensitivity live
| Price | -10% $391 | -5% $368 | +0% $346 | +5% $323 | +10% $301 |
|---|---|---|---|---|---|
| Rent | -10% $248 | -5% $297 | +0% $346 | +5% $395 | +10% $444 |
| Rate | -1.0pp $386 | -0.5pp $366 | base $346 | +0.5pp $325 | +1.0pp $304 |
UW: 25.0% down · 7.5% · 30yr · 1.5% tax · 5.0% vac · 8.0% maint · 8.0% mgmt
Financing live
Cash to close
- Down payment
- $19,975
- Closing costs
- $2,397
- Reserves months
- —
- Total cash needed
- —
Loan-product check · same deal, 3 products live
Conventional
25% down · 7.5% · 30yr
- Down + closing
- —
- Monthly P&I
- —
- Monthly cashflow
- —
- DSCR
- —
- Eligible?
- —
Personal DTI + credit; lowest rate.
DSCR
20% down · 8.5% · 30yr
- Down + closing
- —
- Monthly P&I
- —
- Monthly cashflow
- —
- DSCR
- —
- Eligible?
- —
No personal income docs; deal must DSCR.
Hard money
10% down · 12.0% · 12mo
- Down + closing
- —
- Monthly P&I
- —
- Monthly cashflow
- —
- DSCR
- —
- Eligible?
- —
Short-term bridge; refi at stabilization.
Rent comps 8 comps
| Address | Beds | Baths | Sqft | Rent | $/sqft | DOM | Units | Dist |
|---|---|---|---|---|---|---|---|---|
| 400 Burman Ave Trotwood, OH | 1.0–2.0 | 1.0 | 845 | $1,050 | $1.24 | 3d | 5 | 0.98mi |
| 259 Burman Ave Dayton, OH | 2.0 | 1.0 | 1030 | $1,050 | $1.02 | 11d | 1 | 1.03mi |
| 249 Burman Ave Trotwood, OH | 2.0 | 1.0 | 1030 | $1,050 | $1.02 | 11d | 1 | 1.03mi |
| 3 W Sunrise Ave Dayton, OH | 3.0 | 1.5 | 1200 | $1,250 | $1.04 | 44d | 1 | 1.20mi |
| 305 N Broadway St Trotwood, OH | 2.0 | 1.0 | 725 | $900 | $1.24 | 3d | 1 | 1.22mi |
| 421 N Broadway St Trotwood, OH | 2.0 | 1.0 | 1000 | $945 | $0.94 | 3d | 1 | 1.28mi |
| 481 N Broadway St Unit 8 Trotwood, OH | 2.0 | 1.5 | 950 | $850 | $0.89 | 3d | 1 | 1.35mi |
| 481 N Broadway St Unit 1 Trotwood, OH | 2.0 | 1.5 | 950 | $895 | $0.94 | 44d | 1 | 1.35mi |
Listing history 5 events
-
2026-05-18status Pending
-
2026-05-18historical ActiveUnderContract
-
2026-05-02status Pending
-
2026-04-30$79,900 Active
-
1997-05-13soldstatus $73,900
ⓘ Source: listings_history table (triggers on properties + properties_extension) + one-shot
backfill from property_details.listing_events for pre-trigger history.
Tax reassessment forecast OH · Partial reset (capped growth)
- Current annual tax
- $2,183 · $182/mo
- Projected year-2 tax
- $2,183 · $182/mo
- Expected delta
- $0/yr ($0/mo · 0.0%)
ⓘ Screening estimate from a state-policy table — verify with the county assessor before closing.
Climate risk First Street
- Flood 1/10 Low FEMA zone X (unshaded) · 0% chance over 30 yrs
- Wildfire 1/10 Low
- Heat 3/10 Moderate 7 d/yr ≥102°F today · 19 d/yr by 30 yrs out
- Wind 2/10 Low 0% chance of damaging wind over 30 yrs
- Air quality 3/10 Moderate 3 unhealthy d/yr today · 4 by 30 yrs out
Nearby sold comps map
Loading sold comps map…
Walkable amenities ~0.75 mi
Loading nearby amenities…
Taxation est. · year 1
- Rental income
- $14,887
- − Mortgage interest
- −$4,476
- − Property taxes
- −$2,183
- − Insurance
- −$400
- − Repairs & maintenance
- −$1,191
- − Management
- −$1,191
- − Depreciation
- −$2,324
- Taxable income
- $3,123
- Est. tax owed @ 24.0%
- −$749
- After-tax cash flow
- $3,401/yr
For passive investors: Depreciation is non-cash, so a rental often shows a tax loss while cash-flowing — sheltering income. Rental losses are passive: they offset passive income freely, and up to $25,000/yr can offset ordinary (W-2) income if you actively participate and your MAGI is under $100k (phasing out to $0 by $150k); unused losses carry forward. On sale, claimed depreciation is recaptured at up to 25%, and gains may owe capital-gains tax (a 1031 exchange can defer both). Figures are a year-1 estimate at your 24.0% rate — not tax advice; consult a CPA.
Schools (NCES district)
- District
- Trotwood-Madison City
- NCES district ID
- 3904869
- Math proficiency
- 9% ▼ -15.00%
- Reading proficiency
- 21% ▼ -11.00%
- Median HH income
- $33,529
- Composite
- 12.15/100
- National rank
- #9651
- State rank
- #645 of 656 in OH
Livability — Trotwood
- Score
- 59/100
- State rank
- #1014
- US rank
- #20073
Category grades
Schools grade is shown separately in the Schools card above.
Census & demographics
- Census place
- Trotwood, OH
- County
- Montgomery County · 459,541 people
- City population
- 19,754
- Metro
- Dayton-Kettering, OH
- Population (ZIP)
- 14,114
- Household income
- $51,908
- Rent vs Own
- Severe rent burden
- 852.0
Population outlook (Montgomery County) Hauer SSP2
- Today (2025)
- 523,241 people
- By 2030
- 514,948 · -1.6%
- By 2040
- 493,378 · -5.7%
- By 2050
- 469,639 · -10.2%
- By 2075
- 418,360 · -20.0%
- By 2100
- 353,315 · -32.5%
Race, ethnicity, and origin ACS 2023
- Neighborhood character
- Predominantly Black (69%)
- Race & ethnicity
- Black 69% White 22% Two or more races 7% Asian 2% Hispanic / Latino 1%
- Common ancestry
- Lithuanian 1% Serbian 1%
- Foreign-born
- 3% · Canada
- Languages at home
- 95% English-only · Other Asian/Pacific 1% Spanish 1% French/Haitian/Cajun 1%
Political lean MEDSL · Montgomery
- 2024 margin
- Toss-up / Even · D 49.8% · R 49.3%
- 2008→2024 swing
- -5.8pp toward R · 2008: 6.2pp · 2024: 0.5pp
- All cycles
- 2024: D+0.5 2020: D+2.2 2016: R+1.2 2012: D+3.1 2008: D+6.2
Not yet ingested
- Civics
- —
Market trends
- HPI YoY
- ▼ -44.94%
- Current HPI
- 329.0106
- Rent YoY
- —
- Metro
- Dayton-Kettering, OH
- State GDP YoY
- ▲ 1.98%
- F500 in state
- 48
Industry mix (Fortune 500 HQ in OH)
| Industry | F500 HQs | Revenue |
|---|---|---|
| Insurance | 3 | $145B |
|
||
| Industrial Machinery | 3 | $49B |
|
||
| Financial Services | 3 | $24B |
|
||
| Consumer Goods | 2 | $93B |
|
||
| Aerospace / Defense | 2 | $47B |
|
||
| Utilities | 2 | $33B |
|
||
Price history
+8.1% since first listed5 events — show timeline
- 2026-05-18 Pending — Dayton MLS
- 2026-05-18 Contingent — Dayton MLS
- 2026-05-02 Pending — Dayton MLS
- 2026-04-30 Listed $79,900 Dayton MLS
- 1997-05-13 Sold (Public Records) $73,900 Public Records
Property tax history
+4.2%/yrLatest (2025): $2,183 · +48.3% YoY. Source: county tax records.
Cash-flow waterfall
monthlySold comps — $/sqft
last 12 mo · ≤1 miLoading sold comps…