 🌊 Lakefront
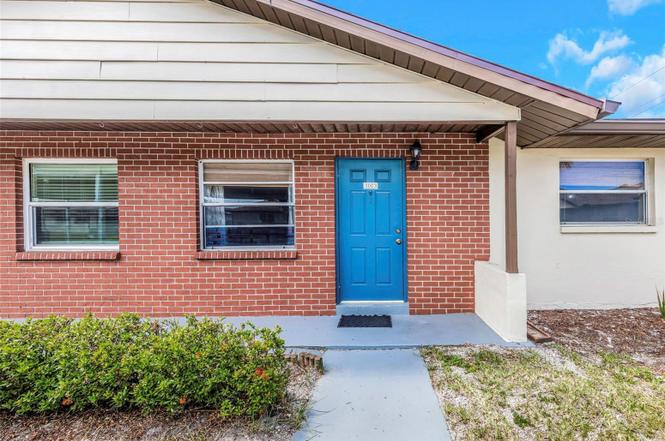
24862 US Highway 19 N #3003 · Clearwater, FL
Flood risk 1/10 · Minimal
- FEMA flood zone
- X (unshaded)
- Chance of flooding over 30 yrs
- 0.0%
- Est. flood insurance / yr
- $507 – $1,088
Fire risk 1/10 · Minimal
- Est. fire insurance / yr
- $947 – $1,759
Heat risk 10/10 · Severe
- Hot days now (above 107°F)
- 7 days/yr
- Hot days in 30 yrs
- 28 days/yr
Wind risk 10/10 · Severe
- Chance of severe wind over 30 yrs
- 99.0%
Air-quality risk 3/10 · Minor
- Unhealthy air days now
- 3 days/yr
- Unhealthy air days in 30 yrs
- 3 days/yr
Risk factors via First Street. Map © Google.
Why this score? — see what drove the C- grade
The composite is a weighted blend of 9 inputs, each scored 0–100. Each bar is that input's sub-score; the figure is the points it added to the 100-point composite (weight × sub-score).
- Cash flow +18.4/30.0
- 1% rule +10.0/10.0
- ARV discount +7.5/15.0
- DSCR +5.8/10.0
- Schools +4.3/10.0
- Livability +4.1/5.0
- Condition / age +2.5/5.0
- Rent growth +1.8/5.0
- Appreciation +0.0/10.0
$79,999
🖨 Deal sheet (PDF) 📄 Offer letter ✓ Due diligence
Listing remarks MLS
Adorable 1 Bedroom, 1 Bath first floor villa located in the desirable "Hill Crest Villas" in Clearwater! Super clean and well kept unit. New ceiling fans, and light fixtures, interior paint and carpet in the bedroom. Large tile throughout the home except for the bedroom! You will love relaxing or entertaining on the spacious lanai! Low maintenance fee of 209 per month which includes the roof! The community offers a pool, laundry facility, and recreation building. This is an easy commute to almost anywhere as shopping, dining entertainment and Beaches are close by! It doesn't get any better than this!
Key facts
- Community pool
- Built 1979
- Listed 8 days
Property features AI
Finance
- Other: Unfurnished; Third-party listing
- Financial info: Total monthly association fees reported as $433; Total annual association fees reported as $5,196; Lease restrictions apply
- HOA & community: HOA: HillCrest; Monthly HOA fee $433; Association approval required; Community clubhouse and pool; Pets not allowed
Exterior
- Parking: No parking information provided
- Security: No security features listed
- Utilities: Public water; Public sewer; Public utilities
- Home design: Residential villa; Single-story; North-facing entry
- Construction: Block construction; Shingle roof; Slab foundation; Built as one-level unit
- Exterior features: Sliding doors; Asphalt road access
Interior
- Kitchen: Range; Refrigerator
- Bedrooms: 1 bedroom
- Flooring: Tile flooring
- Bathrooms: 1 full bathroom
- Heating & cooling: Central heating; Central air conditioning
- Interior features: No notable interior extras listed
- Laundry & utility: No laundry facilities in unit
Neighborhood map
What this means for you Summary
Snapshot
- This is a 1-bed/1.0-bath condo listed at $80k.
Deal economics
- At list price, monthly cash flow is $74 ($893/yr) — positive.
- The deal already cash-flows at list — no discount required.
- Meets the 1% rule at list price ($1k rent vs $80k).
- Cap rate 7.4% vs local median 2.9% in Clearwater — top-decile yield for the area; either an underpriced asset or a hidden risk that comps aren't pricing in. Stress-test before assuming the spread holds.
Location & tenants
- Location reads 82/100 on livability (#60 in FL, #988 nationally) — a professional / high-income tenant draw. Strengths: commute A+, housing A+, health & safety A+; Watch: schools C-, employment C-.
- Pinellas (suburban): math 51% / reading 51% proficiency, ranked #31 of 73 in FL (top 42%) — acceptable for families but not a draw, mixed tenant base, ~2y average lease.
- Market conditions: Rents soft (-2.6%/yr); 292 active listings in the ZIP; 12 comparable units currently listed for rent nearby; rentals leasing fast (median 5d on market — plan ~1-2 weeks tenant-placement turnaround); 2,676 units permitted in Pinellas County in 2024 (1,422 in 5+ unit buildings).
- This rent runs 31% of the median local income ($55k/yr) — at the standard rent-burdened threshold; future hikes will face affordability resistance.
Forward outlook
- Local home prices are declining (-3.0%/yr); year-one equity from $553 of loan paydown is wiped out by about $2k of value loss. Plan a longer hold.
- Pinellas County population projected at +14% by 2050 — modest demand growth; plan on rents tracking national, not racing it.
Negotiation context
- Only 8 days on market — expect competitive offers; lowballing is unlikely to land.
- 4 sale attempts since 21y ago with the ask held roughly flat each time — persistent listings suggest the price (not the market) is what's stuck; bring a comps-based counter.
Risks & watch-outs
- Watch-outs: HOA is 31% of rent.
- Climate carrying-cost: severe wind risk, 99% chance of damaging wind over 30y; extreme-heat days projected 7→28/yr by 2055 (HVAC capex compounding) — expect insurance premiums to compound above CPI over the hold.
Questions for the listing agent
- Built in 1979 — when were the roof, HVAC, electrical panel, plumbing, and water heater last replaced?
- What does the HOA fee cover, when was the last increase, and are there any pending special assessments or reserve-fund shortfalls?
- Any open or pending special assessments — roof, HVAC, plumbing, elevator, façade? What's the per-unit balance and payoff schedule, and is the seller paying it off at close or rolling it to the buyer?
- Is there a deadline driving the sale (1031 exchange, divorce, estate, relocation)? That informs how much negotiation room exists.
- This sits on a lake — are riparian / water-frontage rights deeded with the parcel? Any dock permits, shoreline easements, or HOA water-use restrictions?
- What's the documented flood / surge / shoreline-erosion history here (FEMA AND non-FEMA — e.g., storm surge, creek backup, septic-field saturation)?
- Any water-quality or seasonal algae-bloom issues that affect tenant satisfaction or short-term-rental demand?
- What's the average days-on-market for RENTAL listings here right now (not sales)? A rising rental-DOM trend means longer vacancies and softer asking-rent achievability than the comps imply.
- What's the recent tenant-quality profile in this submarket — average credit score on applications, eviction rate, late-payment / NSF rate, and stable-employment percentage? A property-management company in the area should have these aggregated.
- How much new apartment / multifamily construction is in the pipeline within 1–3 miles? Heavy new supply (>2% of stock underway) typically softens rents 12–24 months out; light construction supports rent growth.
Investment metrics
- 1% rule
- 1.77% ✓
- Cap rate
- 7.41%
- Cash-on-cash
- 3.99%
- DSCR
- 1.18
- GRM
- 4.7
CMA / ARV
No comps found within radius.
Projected returns pro-forma
-3.0% appreciation · 0.0% rent growth · sell at horizon
- IRR
- -15.9%
- Equity multiple
- 0.46×
- Total profit
- $-12,054
- Equity at exit
- $11,928
- IRR
- -22.7%
- Equity multiple
- 0.15×
- Total profit
- $-19,131
- Equity at exit
- $6,917
Cash invested: $22,400 (down + closing). Projections, not guarantees.
Landlord ↔ Tenant lean methodology
- Overall (STATE)
- 87 Strongly Landlord-Friendly
- State Florida
- 87 Strongly Landlord-Friendly · R+3
- County
- — inherits STATE
- City
- — inherits STATE
ZIP-level market 33763
- Rents YoY
- -2.6%
- Active inventory
- 292
- Price-to-rent
- 4.7×
Monthly cashflow live
- Estimated rent
- $1,417 high interval (Pro) →
- Mortgage (P&I)
- −$420
- Tax from tax record
- −$159 /mo · $1,914/yr
- Insurance
- −$33
- HOA
- −$433
- Vacancy / Maint / Mgmt
- −$298
- Net cashflow
- $74
Break-even live
Sensitivity live
| Price | -10% $120 | -5% $97 | +0% $74 | +5% $52 | +10% $29 |
|---|---|---|---|---|---|
| Rent | -10% $-38 | -5% $18 | +0% $74 | +5% $130 | +10% $186 |
| Rate | -1.0pp $115 | -0.5pp $95 | base $74 | +0.5pp $54 | +1.0pp $33 |
UW: 25.0% down · 7.5% · 30yr · 1.5% tax · 5.0% vac · 8.0% maint · 8.0% mgmt
Financing live
Cash to close
- Down payment
- $20,000
- Closing costs
- $2,400
- Reserves months
- —
- Total cash needed
- —
Loan-product check · same deal, 3 products live
Conventional
25% down · 7.5% · 30yr
- Down + closing
- —
- Monthly P&I
- —
- Monthly cashflow
- —
- DSCR
- —
- Eligible?
- —
Personal DTI + credit; lowest rate.
DSCR
20% down · 8.5% · 30yr
- Down + closing
- —
- Monthly P&I
- —
- Monthly cashflow
- —
- DSCR
- —
- Eligible?
- —
No personal income docs; deal must DSCR.
Hard money
10% down · 12.0% · 12mo
- Down + closing
- —
- Monthly P&I
- —
- Monthly cashflow
- —
- DSCR
- —
- Eligible?
- —
Short-term bridge; refi at stabilization.
Rent comps 12 comps
| Address | Beds | Baths | Sqft | Rent | $/sqft | DOM | Units | Dist |
|---|---|---|---|---|---|---|---|---|
| 24862 US Highway 19 N #3202 Clearwater, FL | 1.0 | 1.0 | 600 | $1,295 | $2.16 | 5d | 1 | 0.08mi |
| 24862 U.S. 19 Unit 3202 1 Clearwater, FL | 1.0 | 1.0 | 640 | $1,295 | $2.02 | 24d | 1 | 0.11mi |
| 2031 Glass Loop Clearwater, FL | 1.0–3.0 | 1.0–2.0 | 1058 | $1,848 | $1.75 | 3d | 34 | 0.40mi |
| 25350 US Highway 19 N Clearwater, FL | 3.0 | 1.0–2.0 | 875 | $1,466 | $1.68 | 3d | 28 | 0.42mi |
| 2400 Franciscan Dr #44 Clearwater, FL | 1.0 | 1.0 | 735 | $1,200 | $1.63 | 25d | 1 | 0.53mi |
| 1730 Audrey Dr Unit 2 Clearwater, FL | 1.0 | 1.0 | 700 | $2,100 | $3.00 | 25d | 1 | 0.95mi |
| 2599 Countryside Blvd #210 Clearwater, FL | 1.0 | 1.0 | 575 | $1,400 | $2.43 | 3d | 1 | 0.97mi |
| 2597 Countryside Blvd #209 Clearwater, FL | 1.0 | 1.0 | 575 | $1,500 | $2.61 | 5d | 1 | 1.03mi |
| 2625 Florida 590 Unit 1414 Clearwater, FL | 1.0 | 1.0 | 600 | $1,300 | $2.17 | 25d | 1 | 1.15mi |
| 2524 Alexander Pl Clearwater, FL | 1.0–3.0 | 1.0–2.0 | 991 | $1,735 | $1.75 | 2d | 20 | 1.20mi |
| 2583 Countryside Blvd #3103 Clearwater, FL | 1.0 | 1.0 | 555 | $1,400 | $2.52 | 25d | 1 | 1.23mi |
| 2481 NE Coachman Rd Clearwater, FL | 1.0–2.0 | 1.0–2.0 | 762 | $1,424 | $1.87 | 2d | 14 | 1.28mi |
HOA detail condo
- Monthly dues
- $433 · $5,196/yr
- Likely covers
- waterpool
- Assessments
- None detected in remarks — confirm with the listing agent.
Listing history 6 events
-
2026-06-18days on market $79,999 Active 8 DOM
-
2026-06-17days on market $79,999 Active 7 DOM
-
2026-06-16days on market $79,999 Active 6 DOM
-
2026-06-15days on market $79,999 Active 5 DOM
-
2026-06-13remarks 546-char remark
-
2026-06-13$79,999 Active 3 DOM
ⓘ Source: listings_history table (triggers on properties + properties_extension) + one-shot
backfill from property_details.listing_events for pre-trigger history.
Tax reassessment forecast FL · Resets to sale price
- Current annual tax
- $1,914 · $159/mo
- Projected year-2 tax
- $1,914 · $159/mo
- Expected delta
- $0/yr ($0/mo · 0.0%)
ⓘ Screening estimate from a state-policy table — verify with the county assessor before closing.
Climate risk First Street
- Flood 1/10 Low FEMA zone X (unshaded) · 0% chance over 30 yrs
- Wildfire 1/10 Low
- Heat 10/10 Extreme 7 d/yr ≥107°F today · 28 d/yr by 30 yrs out
- Wind 10/10 Extreme 99% chance of damaging wind over 30 yrs
- Air quality 3/10 Moderate 3 unhealthy d/yr today · 3 by 30 yrs out
Nearby sold comps map
Loading sold comps map…
Walkable amenities ~0.75 mi
Loading nearby amenities…
Taxation est. · year 1
- Rental income
- $17,009
- − Mortgage interest
- −$4,481
- − Property taxes
- −$1,914
- − Insurance
- −$400
- − Repairs & maintenance
- −$1,361
- − Management
- −$1,361
- − HOA
- −$5,196
- − Depreciation
- −$2,327
- Taxable loss
- −$31
- Est. tax savings @ 24.0%
- +$7
- After-tax cash flow
- $900/yr
For passive investors: Depreciation is non-cash, so a rental often shows a tax loss while cash-flowing — sheltering income. Rental losses are passive: they offset passive income freely, and up to $25,000/yr can offset ordinary (W-2) income if you actively participate and your MAGI is under $100k (phasing out to $0 by $150k); unused losses carry forward. On sale, claimed depreciation is recaptured at up to 25%, and gains may owe capital-gains tax (a 1031 exchange can defer both). Figures are a year-1 estimate at your 24.0% rate — not tax advice; consult a CPA.
Schools (NCES district)
- District
- Pinellas
- NCES district ID
- 1201560
- Math proficiency
- 51% ▼ -5.00%
- Reading proficiency
- 51% ▼ -3.00%
- Median HH income
- $46,270
- Composite
- 43.27/100
- National rank
- #3046
- State rank
- #31 of 73 in FL
Livability — Clearwater
- Score
- 82/100
- State rank
- #60
- US rank
- #988
Category grades
Schools grade is shown separately in the Schools card above.
Census & demographics
- Census place
- Clearwater, FL
- County
- Pinellas County · 939,478 people
- City population
- 170,933
- Metro
- Tampa-St. Petersburg-Clearwater, FL
- Population (ZIP)
- 21,146
- Household income
- $54,794
- Rent vs Own
- Severe rent burden
- 753.0
Population outlook (Pinellas County) Hauer SSP2
- Today (2025)
- 1,027,532 people
- By 2030
- 1,063,586 · +3.5%
- By 2040
- 1,125,020 · +9.5%
- By 2050
- 1,168,637 · +13.7%
- By 2075
- 1,265,188 · +23.1%
- By 2100
- 1,260,357 · +22.7%
Race, ethnicity, and origin ACS 2023
- Neighborhood character
- Predominantly White (72%)
- Race & ethnicity
- White 72% Hispanic / Latino 17% Two or more races 9% Black 4% Asian 2%
- Hispanic origin (detail)
- Mexican 5% Puerto Rican 3% Cuban 1%
- Common ancestry
- Romanian 3% Lithuanian 2% Slovak 2%
- Foreign-born
- 15% · Canada, Jamaica, Vietnam
- Languages at home
- 81% English-only · Spanish 10% Other Indo-European 3% Russian/Polish/Slavic 1%
Political lean MEDSL · Pinellas
- 2024 margin
- Lean R (+5.2) · D 46.9% · R 52.1%
- 2008→2024 swing
- -13.5pp toward R · 2008: 8.3pp · 2024: -5.2pp
- All cycles
- 2024: R+5.2 2020: D+0.2 2016: R+1.1 2012: D+5.6 2008: D+8.3
Not yet ingested
- Civics
- —
Market trends
- HPI YoY
- ▼ -439.90%
- Current HPI
- 265.3099
- Rent YoY
- ▼ -2.63%
- Metro
- Tampa-St. Petersburg-Clearwater, FL
- State GDP YoY
- ▲ 3.28%
- F500 in state
- 36
Industry mix (Fortune 500 HQ in FL)
| Industry | F500 HQs | Revenue |
|---|---|---|
| Industrial Technology | 2 | $29B |
|
||
| Insurance | 2 | $17B |
|
||
| Retail | 1 | $60B |
|
||
| Technology Distribution | 1 | $58B |
|
||
| Homebuilding | 1 | $35B |
|
||
| Technology Manufacturing | 1 | $35B |
|
||
Price history
+304.0% since first listed24 events — show timeline
- 2026-06-10 Listed $79,999 Stellar MLS as Distributed by MLS Grid
- 2026-04-30 Listing Removed — Stellar MLS as Distributed by MLS Grid
- 2026-04-03 Sold (Public Records) $133,000 Public Records
- 2026-03-28 Price Changed $99,999 Stellar MLS as Distributed by MLS Grid
- 2025-12-03 Price Changed $115,000 Stellar MLS as Distributed by MLS Grid
- 2025-10-22 Listed $118,000 Stellar MLS as Distributed by MLS Grid
- 2021-03-05 Sold (Public Records) $69,000 Public Records
- 2021-03-01 Sold (MLS) $69,000 Stellar MLS as Distributed by MLS Grid
- 2021-02-12 Pending — Stellar MLS as Distributed by MLS Grid
- 2021-01-29 Price Changed $71,000 Stellar MLS as Distributed by MLS Grid
- 2020-12-30 Price Changed $73,500 Stellar MLS as Distributed by MLS Grid
- 2020-12-15 Price Changed $74,500 Stellar MLS as Distributed by MLS Grid
- 2020-11-06 Listed $76,500 Stellar MLS as Distributed by MLS Grid
- 2012-07-23 Sold (Public Records) $45,000 Public Records
- 2007-05-29 Sold (Public Records) $63,000 Public Records
- 2005-03-03 Sold (Public Records) $54,900 Public Records
- 2005-02-25 Sold (MLS) $54,900 Stellar MLS as Distributed by MLS Grid
- 2005-02-02 Listed $54,900 Stellar MLS as Distributed by MLS Grid
- 2003-08-20 Sold (Public Records) $38,700 Public Records
- 2002-09-12 Sold (Public Records) $30,400 Public Records
- 2001-01-31 Sold (Public Records) $154,200 Public Records
- 2000-02-29 Sold (Public Records) $27,700 Public Records
- 1998-03-17 Sold (Public Records) $750,000 Public Records
- 1996-11-14 Sold (Public Records) $19,800 Public Records
Property tax history
+9.4%/yrLatest (2025): $1,914 · -2.6% YoY. Source: county tax records.
Cash-flow waterfall
monthlySold comps — $/sqft
last 12 mo · ≤1 miLoading sold comps…