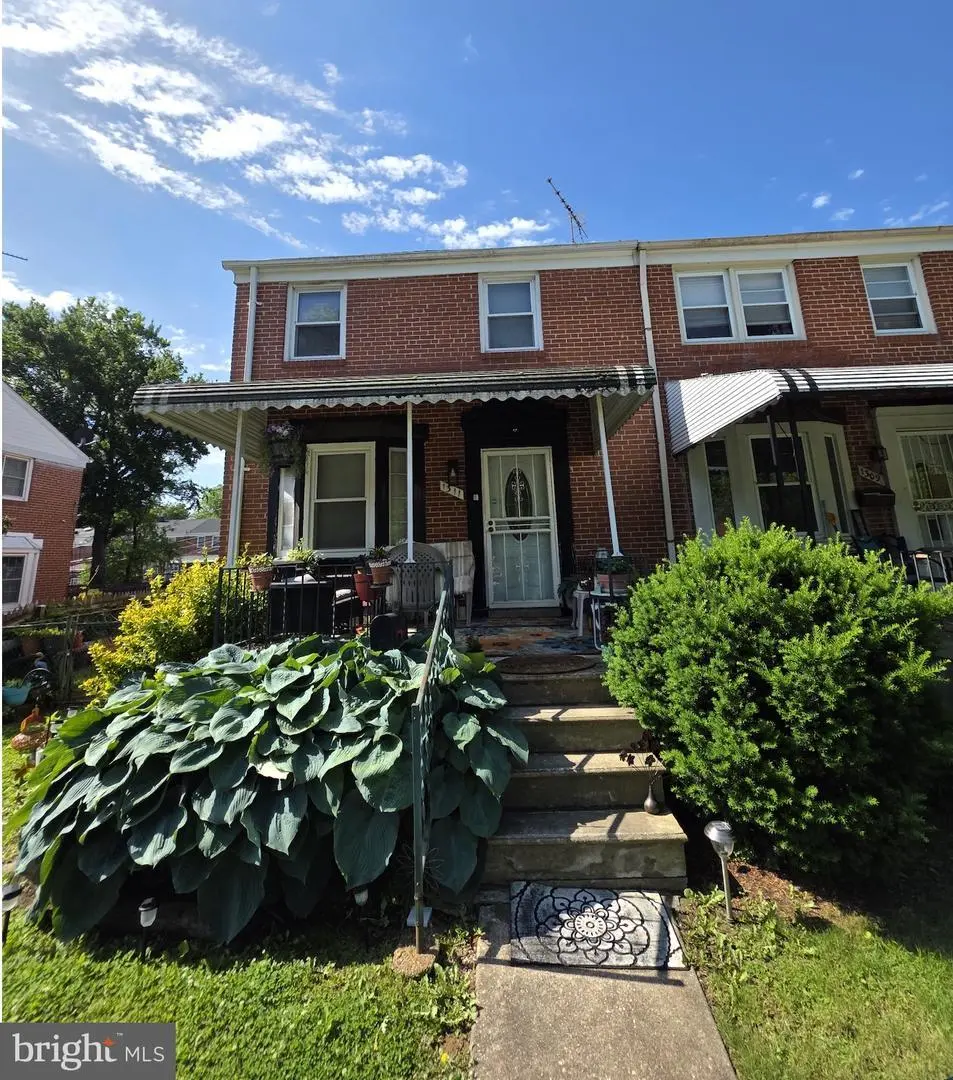
1311 Limit Ave · Baltimore, MD
Flood risk 1/10 · Minimal
- FEMA flood zone
- X (unshaded)
- Chance of flooding over 30 yrs
- 0.0%
- Est. flood insurance / yr
- $473 – $860
Fire risk 1/10 · Minimal
- Est. fire insurance / yr
- $755 – $1,403
Heat risk 7/10 · Major
- Hot days now (above 103°F)
- 7 days/yr
- Hot days in 30 yrs
- 14 days/yr
Wind risk 6/10 · Moderate
- Chance of severe wind over 30 yrs
- 27.0%
Air-quality risk 4/10 · Minor
- Unhealthy air days now
- 3 days/yr
- Unhealthy air days in 30 yrs
- 6 days/yr
Risk factors via First Street. Map © Google.
Why this score? — see what drove the D grade
The composite is a weighted blend of 9 inputs, each scored 0–100. Each bar is that input's sub-score; the figure is the points it added to the 100-point composite (weight × sub-score).
- Cash flow +14.4/30.0
- ARV discount +7.5/15.0
- DSCR +4.4/10.0
- 1% rule +3.9/10.0
- Livability +3.8/5.0
- Rent growth +3.2/5.0
- Condition / age +2.5/5.0
- Schools +1.0/10.0
- Appreciation +0.0/10.0
$222,000
🖨 Deal sheet 📄 Offer letter ✓ Due diligence
Listing remarks
Welcome to Idlewood. This large, well-maintained End Unit rowhome, boasts 3 bedrooms and 1 full bath. Hardwood floors through out the home. Lower level is 50% finished and includes a gas fireplace. Concrete parking pad behind the home. Large yard around the home with plenty of nature on the property. Quiet street in community with Single Family detached home across the street. * * Attractive Seller Financing available * * . Sale is being handled by the Estate, any and ALL offers will be considered. The Estate is also offering 1101 Pelham Wood Rd, 2212 Ellen Ave, and 1146 Monroe Cir, great properties to add to your rental portfolio!
Key facts
- Quiet street
- End unit rowhome
- Gas fireplace
Tags
Property features AI
Finance
- Other: Total below-grade area reported; Above-grade finished area reported; Below-grade finished and unfinished areas reported; Property assessed and tax details available
Exterior
- Parking: Concrete driveway; Off-street parking
- Utilities: Public water; Public sewer; Hot water: Natural gas
- Home design: Interior townhouse/rowhouse; Ownership: Fee simple; Finished above-grade area reported by assessor
- Construction: Brick construction; Brick/mortar foundation; Year built source: Assessor
- Exterior features: Concrete driveway; Driveway and off-street parking available; Tidal water: No; Above- and below-grade structures noted
Interior
- Bedrooms: Three bedrooms on the upper level
- Bathrooms: One full bathroom
- Heating & cooling: Forced air heating (natural gas); Central air conditioning
- Interior features: Basement present (other type); Living area source: Assessor
Neighborhood map
What this means for you Summary
Snapshot
- This is a 3-bed/1.5-bath townhouse listed at $222k.
Deal economics
- At list price, monthly cash flow is $46 ($554/yr) — positive.
- The deal already cash-flows at list — no discount required.
- To meet the 1% rule (rent ≥ 1% of price), the offer needs to be $197k (11.4% below list).
- Recommended offer: $197k (11.4% below list) — sets the bar for 1% rule.
Location & tenants
- Location reads 76/100 on livability (#90 in MD, #3,396 nationally) — a middle-class / working-renter tenant base. Strengths: amenities A+, commute A+, housing A+; Watch: schools D, crime F.
- Baltimore City Public Schools (urban): math 7% / reading 16% proficiency, ranked #24 of 24 in MD (top 100%) — low school quality limits family demand, transient renter base, plan for 1-2y turnover; 79% free/reduced lunch — lower-income household profile, screen leases tightly.
- Market conditions: Rents rising (+2.9%/yr); 71 active listings in the ZIP; 40 comparable units currently listed for rent nearby; rentals lingering (median 44d on market — plan ~5-8 weeks vacancy on turnover, expect pricing pressure); 50% of comp listings sitting > 30 days — soft ceiling on asking rent; 1,273 units permitted in Baltimore city in 2024 (1,104 in 5+ unit buildings).
- This rent runs 38% of the median local income ($63k/yr) — at the standard rent-burdened threshold; future hikes will face affordability resistance.
Forward outlook
- Local home prices are declining (-3.0%/yr); year-one equity from $2k of loan paydown is wiped out by about $7k of value loss. Plan a longer hold.
- Baltimore County population projected to shrink 4% by 2050 — rents likely to lag national; underwrite the cash flow, not the appreciation.
Negotiation context
- It's been on market 19 days — a 2% lower offer ($219k) is reasonable based on typical stale-listing flexibility.
- 4 sale attempts since 24y ago with the ask held roughly flat each time — persistent listings suggest the price (not the market) is what's stuck; bring a comps-based counter.
Risks & watch-outs
- Watch-outs: built in 1953 — expect roof / HVAC / electrical / plumbing capex.
- Climate carrying-cost: major wind risk, 27% chance of damaging wind over 30y; extreme-heat days projected 7→14/yr by 2055 (HVAC capex compounding) — expect insurance premiums to compound above CPI over the hold.
Questions for the listing agent
- Built in 1953 — when were the roof, HVAC, electrical panel, plumbing, and water heater last replaced?
- Is there a deadline driving the sale (1031 exchange, divorce, estate, relocation)? That informs how much negotiation room exists.
- Schools are D-rated, which usually means shorter tenancies and higher turnover. Who's the typical renter profile here, and what's been the actual vacancy rate?
- Crime grade is F in this area — have there been break-ins, vandalism, or insurance claims at this property in the last 3 years? What carrier currently insures it and at what premium?
- The area grade is low — what's the realistic commute time and amenity access for the typical tenant pool here? Any planned neighborhood developments (good or bad) we should know about?
- What's the average days-on-market for RENTAL listings here right now (not sales)? A rising rental-DOM trend means longer vacancies and softer asking-rent achievability than the comps imply.
- What's the recent tenant-quality profile in this submarket — average credit score on applications, eviction rate, late-payment / NSF rate, and stable-employment percentage? A property-management company in the area should have these aggregated.
- How much new for-sale + rental construction is in the pipeline within 1–3 miles? Heavy new supply typically softens prices + rents 12–24 months out; constrained supply supports both.
Investment metrics
- 1% rule
- 0.89% ✗
- Cap rate
- 6.54%
- Cash-on-cash
- 0.89%
- DSCR
- 1.04
- GRM
- 9.4
CMA / ARV
- ARV (on-the-fly)
- $221,760
- Comps found
- 12
Show comp detail 12 sales within ~0.75 mi
| Address | Dist | Beds/Ba | Sqft | Sold | Price | $/sf | Match |
|---|---|---|---|---|---|---|---|
| 1283 Gittings Ave | 0.12mi | 3/1.0 | 1,258 (-0%) | 5mo | $208,000 | $165 | 88 |
| 6216 Falkirk Rd | 0.12mi | 3/1.5 | 1,330 (+6%) | 5mo | $250,000 | $188 | 81 |
| 1400 Walker Ave | 0.24mi | 3/2.0 | 1,330 (+6%) | 4mo | $180,000 | $135 | 75 |
| 1322 Limit Ave | 0.04mi | 3/2.0 | 1,424 (+13%) | 3mo | $265,000 | $186 | 72 |
| 6415 Falkirk Rd | 0.17mi | 3/2.0 | 1,408 (+12%) | 2mo | $215,000 | $153 | 68 |
| 1420 Cedarcroft Rd | 0.29mi | 2/1.5 (-1) | 1,192 (-5%) | 6mo | $160,714 | $135 | 68 |
| 5933 Leith Walk | 0.49mi | 3/1.0 | 1,330 (+6%) | 3mo | $155,000 | $117 | 63 |
| 1045 Marlau Dr | 0.74mi | 3/1.5 | 1,240 (-2%) | 0mo | $225,000 | $181 | 62 |
| 5911 Glenkirk Rd | 0.57mi | 3/1.5 | 1,330 (+6%) | 4mo | $155,100 | $117 | 60 |
| 6505 Loch Hill Ct | 0.43mi | 3/1.5 | 1,425 (+13%) | 0mo | $298,350 | $209 | 58 |
| 5820 Loch Raven Blvd | 0.65mi | 3/2.5 | 1,330 (+6%) | 6mo | $244,000 | $183 | 52 |
| 5811 The Alameda | 0.62mi | 4/2.0 (+1) | 1,420 (+13%) | 1mo | $250,000 | $176 | 42 |
Match score weights: distance 35% · size 25% · config 20% · recency 20%. Top-matched comps best support the ARV.
Projected returns pro-forma
-3.0% appreciation · 2.86% rent growth · sell at horizon
- IRR
- -15.0%
- Equity multiple
- 0.46×
- Total profit
- $-33,297
- Equity at exit
- $33,101
- IRR
- -6.6%
- Equity multiple
- 0.58×
- Total profit
- $-26,287
- Equity at exit
- $19,195
Cash invested: $62,160 (down + closing). Projections, not guarantees.
Landlord ↔ Tenant lean methodology
- Overall (CITY)
- 12 Strongly Tenant-Friendly
- State Maryland
- 27 Tenant-Leaning · D+14
- County
- — inherits STATE
- City Baltimore
- 12 Strongly Tenant-Friendly · D+58
ZIP-level market 21239
- Rents YoY
- 2.9%
- Active inventory
- 71
- Price-to-rent
- 9.4×
Monthly cashflow live
- Estimated rent
- $1,967 high interval (Pro) →
- Mortgage (P&I)
- −$1,164
- Tax from tax record
- −$251 /mo · $3,013/yr
- Insurance
- −$92
- HOA
- −$0
- Vacancy / Maint / Mgmt
- −$413
- Net cashflow
- $46
Break-even live
UW: 25.0% down · 7.5% · 30yr · 1.5% tax · 5.0% vac · 8.0% maint · 8.0% mgmt
Financing live
Cash to close
- Down payment
- $55,500
- Closing costs
- $6,660
- Reserves months
- —
- Total cash needed
- —
Loan-product check · same deal, 3 products live
Conventional
25% down · 7.5% · 30yr
- Down + closing
- —
- Monthly P&I
- —
- Monthly cashflow
- —
- DSCR
- —
- Eligible?
- —
Personal DTI + credit; lowest rate.
DSCR
20% down · 8.5% · 30yr
- Down + closing
- —
- Monthly P&I
- —
- Monthly cashflow
- —
- DSCR
- —
- Eligible?
- —
No personal income docs; deal must DSCR.
Hard money
10% down · 12.0% · 12mo
- Down + closing
- —
- Monthly P&I
- —
- Monthly cashflow
- —
- DSCR
- —
- Eligible?
- —
Short-term bridge; refi at stabilization.
Rent comps 40 comps
| Address | Beds | Baths | Sqft | Rent | $/sqft | DOM | Units | Dist |
|---|---|---|---|---|---|---|---|---|
| 6405 Loch Crest Rd Idlewylde, MD | 3.0 | 2.5 | 1440 | $2,257 | $1.57 | 43d | 1 | 0.25mi |
| 1408 Cedarcroft Rd Baltimore, MD | 3.0 | 2.0 | 912 | $1,957 | $2.15 | 43d | 1 | 0.27mi |
| 1444 Meridene Dr Baltimore, MD | 3.0 | 1.5 | 1520 | $1,950 | $1.28 | 43d | 1 | 0.36mi |
| 6149 Dunroming Rd Baltimore, MD | 3.0 | 1.5 | 1400 | $1,895 | $1.35 | 10d | 1 | 0.38mi |
| 6518 Loch Hill Ct Loch Hill, MD | 3.0 | 1.5 | 1580 | $2,050 | $1.30 | 23d | 1 | 0.42mi |
| 6101 Loch Raven Blvd Baltimore, MD | 1.0–2.0 | 1.0–2.0 | 1138 | $2,318 | $2.04 | 2d | 8 | 0.45mi |
| 1104 Meridene Dr Unit 1 Baltimore, MD | 2.0 | 1.0 | 1098 | $1,350 | $1.23 | 43d | 1 | 0.50mi |
| 6189 Northwood Dr Baltimore, MD | 4.0 | 2.0 | 1400 | $2,200 | $1.57 | 43d | 1 | 0.52mi |
| 1018 Woodson Rd Baltimore, MD | 1.0–3.0 | 1.0–2.0 | 815 | $2,329 | $2.86 | 2d | 13 | 0.60mi |
| 1116 Gleneagle Rd Unit 2 Baltimore, MD | 2.0 | 1.0 | 876 | $1,750 | $2.00 | 43d | 1 | 0.61mi |
| 6159 Parkway Dr Apt 1 Baltimore, MD | 4.0 | 2.0 | 1408 | $2,200 | $1.56 | 23d | 1 | 0.63mi |
| 6159 Parkway Dr Baltimore, MD | 4.0 | 2.0 | 1408 | $2,200 | $1.56 | 21d | 1 | 0.63mi |
| 1106 Gleneagle Rd Unit 2 Baltimore, MD | 2.0 | 1.0 | 1100 | $1,450 | $1.32 | 43d | 1 | 0.63mi |
| 1111 Gleneagle Rd Unit 2 Baltimore, MD | 2.0 | 1.0 | 1452 | $1,050 | $0.72 | 43d | 1 | 0.65mi |
| 1508 Gleneagle Rd Baltimore, MD | 3.0 | 2.0 | 1824 | $2,180 | $1.20 | 4d | 1 | 0.69mi |
| 1020 Dartmouth Glen Way Baltimore, MD | 3.0 | 2.5 | 1152 | $2,250 | $1.95 | 23d | 1 | 0.75mi |
| 1646 Wadsworth Way Baltimore, MD | 3.0 | 1.0 | 1520 | $2,100 | $1.38 | 10d | 1 | 0.85mi |
| 917 Reverdy Rd Unit A Baltimore, MD | 3.0 | 1.0 | 1200 | $2,100 | $1.75 | 43d | 1 | 0.89mi |
| 34 Dowling Cir Parkville, MD | 1.0–2.0 | 1.0 | 874 | $1,465 | $1.68 | 1d | 36 | 0.96mi |
| 6906 Donachie Rd Baltimore, MD | 3.0 | 1.0–2.0 | 904 | $2,363 | $2.61 | 3d | 37 | 0.96mi |
| 1127 Deanwood Rd Parkville, MD | 3.0 | 2.0 | 1730 | $2,350 | $1.36 | 43d | 1 | 1.02mi |
| 6008 Clearspring Rd Baltimore, MD | 4.0 | 2.5 | 1758 | $3,600 | $2.05 | 23d | 1 | 1.02mi |
| 828 Saint Dunstans Rd Baltimore, MD | 3.0 | 2.0 | 1544 | $2,000 | $1.30 | 23d | 1 | 1.04mi |
| 1900 Ramblewood Rd Apt A Baltimore, MD | 2.0 | 2.0 | 903 | $1,847 | $2.05 | 43d | 1 | 1.09mi |
| 5520 Sagra Rd Baltimore, MD | 3.0 | 1.5 | 1650 | $1,900 | $1.15 | 43d | 1 | 1.09mi |
| 1726 E Belvedere Ave Baltimore, MD | 3.0 | 2.0 | 1140 | $1,895 | $1.66 | 21d | 1 | 1.11mi |
| 5626 Midwood Ave Unit 2 Baltimore, MD | 2.0 | 1.0 | 1452 | $1,100 | $0.76 | 23d | 1 | 1.11mi |
| 5622 Midwood Ave Baltimore, MD | 3.0 | 2.0 | 1452 | $2,300 | $1.58 | 43d | 1 | 1.12mi |
| 1806 Ramblewood Rd Apt A Baltimore, MD | 2.0 | 2.0 | 903 | $1,847 | $2.05 | 43d | 1 | 1.15mi |
| 818 Bradhurst Rd Baltimore, MD | 2.0 | 1.0 | 1216 | $1,350 | $1.11 | 3d | 1 | 1.17mi |
| 818 Bradhurst Rd Baltimore, MD | 2.0 | 1.0 | 1216 | $1,250 | $1.03 | 43d | 1 | 1.17mi |
| 1908 E Belvedere Ave Baltimore, MD | 4.0 | 2.0 | 1425 | $1,950 | $1.37 | 19d | 1 | 1.19mi |
| 6502 McClean Blvd Unit 2211-B3 Baltimore, MD | 2.0 | 1.0 | 925 | $1,495 | $1.62 | 21d | 1 | 1.19mi |
| 1006 Cameron Rd Baltimore, MD | 2.0 | 1.0 | 1032 | $950 | $0.92 | 43d | 1 | 1.20mi |
| 7202 Sindall Rd Unit 7202 Parkville, MD | 3.0 | 1.0 | 1350 | $1,850 | $1.37 | 43d | 1 | 1.20mi |
| 5781 Edgepark Rd Baltimore, MD | 3.0 | 2.0 | 1568 | $1,975 | $1.26 | 16d | 1 | 1.22mi |
| 1008 Tunbridge Rd Baltimore, MD | 3.0 | 2.0 | 1732 | $2,050 | $1.18 | 23d | 1 | 1.22mi |
| 1610 Wentworth Ave Parkville, MD | 3.0 | 1.0 | 1024 | $1,900 | $1.86 | 43d | 1 | 1.22mi |
| 2106 Cloville Ave Baltimore, MD | 3.0 | 1.5 | 1080 | $1,700 | $1.57 | 43d | 1 | 1.23mi |
| 1629 Wentworth Ave Parkville, MD | 3.0 | 1.5 | 1152 | $1,895 | $1.64 | 43d | 1 | 1.25mi |
Listing history 12 events
-
2026-06-18days on market $222,000 Active 19 DOM
-
2026-06-17days on market $222,000 Active 18 DOM
-
2026-06-16days on market $222,000 Active 17 DOM
-
2026-06-15days on market $222,000 Active 16 DOM
-
2026-06-13days on market $222,000 Active 14 DOM
-
2026-06-09days on market $222,000 Active 10 DOM
-
2026-06-08days on market $222,000 Active 9 DOM
-
2026-06-07days on market $222,000 Active 8 DOM
-
2026-06-04days on market $222,000 Active 5 DOM
-
2026-06-03days on market $222,000 Active 4 DOM
-
2026-06-02days on market $222,000 Active 3 DOM
-
2026-06-01days on market $222,000 Active 2 DOM
ⓘ Source: listings_history table (triggers on properties + properties_extension) + one-shot
backfill from property_details.listing_events for pre-trigger history.
Tax reassessment forecast MD · Partial reset (capped growth)
- Current annual tax
- $3,013 · $251/mo
- Projected year-2 tax
- $3,013 · $251/mo
- Expected delta
- $0/yr ($0/mo · 0.0%)
ⓘ Screening estimate from a state-policy table — verify with the county assessor before closing.
Climate risk First Street
- Flood 1/10 Low FEMA zone X (unshaded) · 0% chance over 30 yrs
- Wildfire 1/10 Low
- Heat 7/10 Severe 7 d/yr ≥103°F today · 14 d/yr by 30 yrs out
- Wind 6/10 Major 27% chance of damaging wind over 30 yrs
- Air quality 4/10 Moderate 3 unhealthy d/yr today · 6 by 30 yrs out
Nearby sold comps map
Loading sold comps map…
Walkable amenities ~0.75 mi
Loading nearby amenities…
Taxation est. · year 1
- Rental income
- $23,604
- − Mortgage interest
- −$12,435
- − Property taxes
- −$3,013
- − Insurance
- −$1,110
- − Repairs & maintenance
- −$1,888
- − Management
- −$1,888
- − Depreciation
- −$6,458
- Taxable loss
- −$3,189
- Est. tax savings @ 24.0%
- +$765
- After-tax cash flow
- $1,319/yr
For passive investors: Depreciation is non-cash, so a rental often shows a tax loss while cash-flowing — sheltering income. Rental losses are passive: they offset passive income freely, and up to $25,000/yr can offset ordinary (W-2) income if you actively participate and your MAGI is under $100k (phasing out to $0 by $150k); unused losses carry forward. On sale, claimed depreciation is recaptured at up to 25%, and gains may owe capital-gains tax (a 1031 exchange can defer both). Figures are a year-1 estimate at your 24.0% rate — not tax advice; consult a CPA.
Schools (NCES district)
- District
- Baltimore City Public Schools
- NCES district ID
- 2400090
- Math proficiency
- 7% ▼ -9.00%
- Reading proficiency
- 16% ▼ -5.00%
- Median HH income
- $42,108
- Composite
- 10.08/100
- National rank
- #9805
- State rank
- #24 of 24 in MD
Livability — Baltimore
- Score
- 76/100
- State rank
- #90
- US rank
- #3396
Category grades
Schools grade is shown separately in the Schools card above.
Census & demographics
- Census place
- Baltimore, MD
- County
- Baltimore City · 558,601 people
- City population
- 588,727
- Metro
- Baltimore-Columbia-Towson, MD
- Population (ZIP)
- 27,346
- Household income
- $62,650
- Rent vs Own
- Severe rent burden
- 1103.0
Population outlook (Baltimore County) Hauer SSP2
- Today (2025)
- 624,249 people
- By 2030
- 621,541 · -0.4%
- By 2040
- 609,756 · -2.3%
- By 2050
- 597,249 · -4.3%
- By 2075
- 552,236 · -11.5%
- By 2100
- 513,934 · -17.7%
Race, ethnicity, and origin ACS 2023
- Neighborhood character
- Predominantly Black (76%)
- Race & ethnicity
- Black 76% White 12% Asian 4% Hispanic / Latino 4% Two or more races 4%
- Common ancestry
- Lithuanian 1% Romanian 1% Russian 1%
- Foreign-born
- 10% · Canada, United Kingdom, China
- Languages at home
- 88% English-only · Other Indo-European 3% Spanish 2% French/Haitian/Cajun 2%
Political lean MEDSL · Baltimore
- 2024 margin
- Solid D (+73.0) · D 85.2% · R 12.2% · Other 2.6%
- 2008→2024 swing
- -2.5pp toward R · 2008: 75.5pp · 2024: 73.0pp
- All cycles
- 2024: D+73.0 2020: D+76.6 2016: D+74.6 2012: D+76.4 2008: D+75.5
Not yet ingested
- Civics
- —
Market trends
- HPI YoY
- ▼ -164.48%
- Current HPI
- 258.094
- Rent YoY
- ▲ 2.86%
- Metro
- Baltimore-Columbia-Towson, MD
- State GDP YoY
- ▲ 2.97%
- F500 in state
- 12
Industry mix (Fortune 500 HQ in MD)
| Industry | F500 HQs | Revenue |
|---|---|---|
| Aerospace / Defense | 1 | $71B |
|
||
| Utilities | 1 | $25B |
|
||
| Hotels | 1 | $24B |
|
||
| Consumer Goods | 1 | $7B |
|
||
| Real Estate | 1 | $6B |
|
||
| Chemicals | 1 | $2B |
|
||
Price history
+43.3% since first listed8 events — show timeline
- 2026-05-30 Listed $222,000 BRIGHT MLS
- 2023-11-29 Sold (Public Records) $195,000 Public Records
- 2019-08-09 Listing Removed — BRIGHT MLS
- 2019-06-13 Listed $154,900 BRIGHT MLS
- 2005-08-27 Delisted — MRIS
- 2005-06-25 Listed — MRIS
- 2002-06-19 Delisted — MRIS
- 2002-04-20 Listed — MRIS
Property tax history
+0.9%/yrLatest (2025): $3,013 · +28.3% YoY. Source: county tax records.
Cash-flow waterfall
monthlySold comps — $/sqft
last 12 mo · ≤1 miLoading sold comps…