631 NW 215th Ave · Pembroke Pines, FL
Flood risk 1/10 · Minimal
- FEMA flood zone
- X (shaded)
- Chance of flooding over 30 yrs
- 0.0%
- Est. flood insurance / yr
- $507 – $1,088
Fire risk 6/10 · Moderate
- Est. fire insurance / yr
- $947 – $1,759
Heat risk 9/10 · Severe
- Hot days now (above 108°F)
- 7 days/yr
- Hot days in 30 yrs
- 23 days/yr
Wind risk 10/10 · Severe
- Chance of severe wind over 30 yrs
- 99.0%
Air-quality risk 2/10 · Minimal
- Unhealthy air days now
- 1 days/yr
- Unhealthy air days in 30 yrs
- 2 days/yr
Risk factors via First Street. Map © Google.
Why this score? — see what drove the B+ grade
The composite is a weighted blend of 9 inputs, each scored 0–100. Each bar is that input's sub-score; the figure is the points it added to the 100-point composite (weight × sub-score).
- Cash flow +30.0/30.0
- ARV discount +15.0/15.0
- 1% rule +10.0/10.0
- DSCR +10.0/10.0
- Livability +4.2/5.0
- Schools +4.1/10.0
- Condition / age +2.5/5.0
- Rent growth +2.2/5.0
- Appreciation +0.0/10.0
$240,000
🖨 Deal sheet 📄 Offer letter ✓ Due diligence
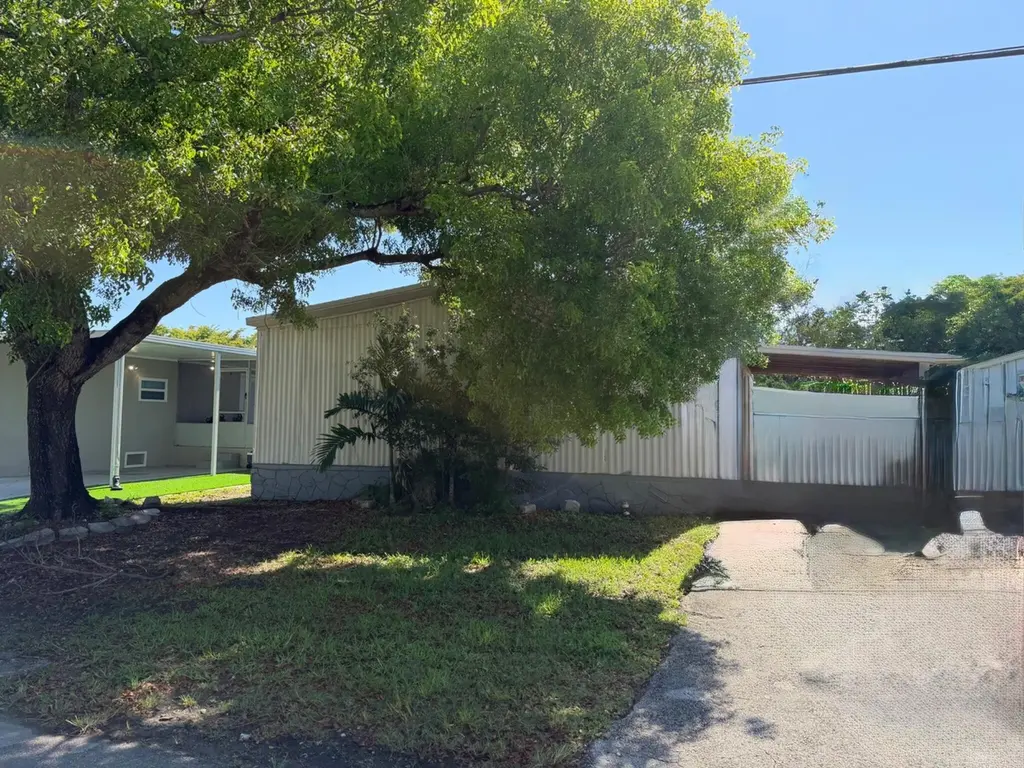
Listing remarks
The property is decent move in ready condition. it's sold at a hefty discount for a buyer who prefers to make his own design and renovation choices. nice little back yard and front patio.
Key facts
- Back yard
- Front patio
- Move in ready
Tags
Property features AI
Finance
- Other: Pets allowed with no restrictions
- HOA & community: Community pool; HOA dues $110 monthly (includes common areas)
Exterior
- Parking: Attached carport; Carport with 1 covered space (2 total parking spaces)
- Security: Security features present
- Utilities: Public water; Public sewer; Electricity connected
- Home design: Mobile home; One story; Entry level: 1; Faces west; Resale condition
- Construction: Shingle roof; Other construction materials
- Exterior features: No waterfront
Interior
- Kitchen: Electric range; Refrigerator
- Bedrooms: 2 main-level bedrooms
- Flooring: Vinyl
- Bathrooms: 2 full bathrooms
- Heating & cooling: Central heating; Electric cooling
- Interior features: Kitchen island
- Laundry & utility: Inside laundry room; Washer hookup; Electric water heater
Neighborhood map
What this means for you Summary
Snapshot
- This is a 3-bed/2.0-bath manufactured listed at $240k.
Deal economics
- At list price, monthly cash flow is $1k ($13k/yr) — positive.
- The deal already cash-flows at list — no discount required.
- Meets the 1% rule at list price ($4k rent vs $240k).
- Recommended offer: $236k (1.5% below list) — sets the bar for market timing.
- Cap rate 11.9% vs local median 4.0% in Pembroke Pines — top-decile yield for the area; either an underpriced asset or a hidden risk that comps aren't pricing in. Stress-test before assuming the spread holds.
Location & tenants
- Location reads 83/100 on livability (#54 in FL, #933 nationally) — a professional / high-income tenant draw. Strengths: housing A+, health & safety A+, crime A-; Watch: amenities D+, cost of living D+.
- Broward (suburban): math 42% / reading 53% proficiency, ranked #46 of 73 in FL (top 63%) — families likely to look elsewhere, expect single-tenant / working-renter base with shorter leases.
- Zoned schools: Chapel Trail Elementary School (math 53% / reading 67%, grade B-, #680 of 2,144 statewide, top 32%, 739 students, 38% FRL); Silver Trail Middle School (math 66% / reading 67%, grade A-, #84 of 571 statewide, top 16%, 1,269 students, 40% FRL); West Broward High School (math 46% / reading 69%, grade C, #125 of 667 statewide, top 19%, 2,586 students, 33% FRL).
- Zoned-school proficiency averages 61% at this address vs 48% district-wide (+14 pts) — the actual schools serving this property are materially stronger than the Broward average implies; a family-tenant draw the district grade alone would hide.
- Market conditions: Rents soft (-1.2%/yr); 240 active listings in the ZIP; 19 comparable units currently listed for rent nearby; rentals at typical pace (median 24d on market — plan ~3-4 weeks tenant-placement turnaround); high-income renter base; 2,111 units permitted in Broward County in 2024 (1,265 in 5+ unit buildings).
- This rent runs 30% of the median local income ($146k/yr) — at the standard rent-burdened threshold; future hikes will face affordability resistance.
Forward outlook
- Local home prices are declining (-3.0%/yr); year-one equity from $2k of loan paydown is wiped out by about $7k of value loss. Plan a longer hold.
- Broward County population projected at +34% by 2050 — long-run rental-demand tailwind backs the buy-and-hold thesis.
- At projected returns (-3.0% appreciation + 0.0% rent growth), your $67k cash investment doubles in ~8 years — after that, you're playing with house money.
Negotiation context
- It's been on market 22 days — a 2% lower offer ($236k) is reasonable based on typical stale-listing flexibility.
- Current owner paid $49k; list at $240k implies a 393% gain — meaningful room to come down on a strong offer.
Risks & watch-outs
- Climate carrying-cost: severe wind risk, 99% chance of damaging wind over 30y; major wildfire risk; extreme-heat days projected 7→23/yr by 2055 (HVAC capex compounding) — expect insurance premiums to compound above CPI over the hold.
Questions for the listing agent
- What does the HOA fee cover, when was the last increase, and are there any pending special assessments or reserve-fund shortfalls?
- Is there a deadline driving the sale (1031 exchange, divorce, estate, relocation)? That informs how much negotiation room exists.
- Schools are A-rated — typically a magnet for longer-tenancy family renters. What's the average tenant stay here, and is there a school-zone premium baked into asking?
- What's the average days-on-market for RENTAL listings here right now (not sales)? A rising rental-DOM trend means longer vacancies and softer asking-rent achievability than the comps imply.
- What's the recent tenant-quality profile in this submarket — average credit score on applications, eviction rate, late-payment / NSF rate, and stable-employment percentage? A property-management company in the area should have these aggregated.
- How much new for-sale + rental construction is in the pipeline within 1–3 miles? Heavy new supply typically softens prices + rents 12–24 months out; constrained supply supports both.
Investment metrics
- 1% rule
- 1.53% ✓
- Cap rate
- 11.89%
- Cash-on-cash
- 19.98%
- DSCR
- 1.89
- GRM
- 5.4
CMA / ARV
- ARV (on-the-fly)
- $324,480
- Comps found
- 1
Show comp detail 1 sale within ~0.75 mi
| Address | Dist | Beds/Ba | Sqft | Sold | Price | $/sf | Match |
|---|---|---|---|---|---|---|---|
| 21661 NW 8th Ct | 0.19mi | 3/2.0 | 1,248 (-8%) | 4mo | $299,000 | $240 | 75 |
Match score weights: distance 35% · size 25% · config 20% · recency 20%. Top-matched comps best support the ARV.
Projected returns pro-forma
-3.0% appreciation · 0.0% rent growth · sell at horizon
- IRR
- 8.5%
- Equity multiple
- 1.32×
- Total profit
- $21,703
- Equity at exit
- $35,785
- IRR
- 14.9%
- Equity multiple
- 2.03×
- Total profit
- $69,489
- Equity at exit
- $20,751
Cash invested: $67,200 (down + closing). Projections, not guarantees.
Landlord ↔ Tenant lean methodology
- Overall (STATE)
- 87 Strongly Landlord-Friendly
- State Florida
- 87 Strongly Landlord-Friendly · R+3
- County
- — inherits STATE
- City
- — inherits STATE
ZIP-level market 33029
- Home prices YoY
- -18.3%
- Rents YoY
- -1.2%
- Active inventory
- 240
- Price-to-rent
- 5.4×
Monthly cashflow live
- Estimated rent
- $3,683 high interval (Pro) →
- Mortgage (P&I)
- −$1,259
- Tax from tax record
- −$322 /mo · $3,865/yr
- Insurance
- −$100
- HOA
- −$110
- Vacancy / Maint / Mgmt
- −$773
- Net cashflow
- $1,119
Break-even live
UW: 25.0% down · 7.5% · 30yr · 1.5% tax · 5.0% vac · 8.0% maint · 8.0% mgmt
Financing live
Cash to close
- Down payment
- $60,000
- Closing costs
- $7,200
- Reserves months
- —
- Total cash needed
- —
Loan-product check · same deal, 3 products live
Conventional
25% down · 7.5% · 30yr
- Down + closing
- —
- Monthly P&I
- —
- Monthly cashflow
- —
- DSCR
- —
- Eligible?
- —
Personal DTI + credit; lowest rate.
DSCR
20% down · 8.5% · 30yr
- Down + closing
- —
- Monthly P&I
- —
- Monthly cashflow
- —
- DSCR
- —
- Eligible?
- —
No personal income docs; deal must DSCR.
Hard money
10% down · 12.0% · 12mo
- Down + closing
- —
- Monthly P&I
- —
- Monthly cashflow
- —
- DSCR
- —
- Eligible?
- —
Short-term bridge; refi at stabilization.
Rent comps 19 comps
| Address | Beds | Baths | Sqft | Rent | $/sqft | DOM | Units | Dist |
|---|---|---|---|---|---|---|---|---|
| 21821 S Heritage Cir #1 Pembroke Pines, FL | 3.0 | 3.0 | 1475 | $2,550 | $1.73 | 24d | 1 | 0.32mi |
| 21821 S Heritage Cir #1 Pembroke Pines, FL | 3.0 | 3.0 | 1475 | $2,550 | $1.73 | 4d | 1 | 0.32mi |
| 20975 NW 1st Ct Pembroke Pines, FL | 3.0 | 2.5 | 1692 | $3,600 | $2.13 | 24d | 1 | 0.35mi |
| 20957 NW 1st Ct Unit 20957 Pembroke Pines, FL | 3.0 | 2.5 | 1749 | $2,900 | $1.66 | 24d | 1 | 0.37mi |
| 20875 NW 4th St Pembroke Pines, FL | 2.0 | 2.5 | 1361 | $2,500 | $1.84 | 24d | 1 | 0.38mi |
| 20861 NW 4th St Pembroke Pines, FL | 3.0 | 2.5 | 1361 | $4,000 | $2.94 | 24d | 1 | 0.41mi |
| 20919 NW 1st Dr Pembroke Pines, FL | 3.0 | 2.5 | 1749 | $3,600 | $2.06 | 11d | 1 | 0.41mi |
| 20919 NW 1st Dr Pembroke Pines, FL | 3.0 | 2.5 | 1749 | $3,600 | $2.06 | 24d | 1 | 0.41mi |
| 20901 NW 1st Dr Pembroke Pines, FL | 3.0 | 2.5 | 1692 | $3,300 | $1.95 | 24d | 1 | 0.42mi |
| 20901 NW 1st Dr Unit 1 Pembroke Pines, FL | 3.0 | 2.5 | 1692 | $3,200 | $1.89 | 24d | 1 | 0.42mi |
| 117 NW 209th Trl Pembroke Pines, FL | 4.0 | 3.0 | 1617 | $3,600 | $2.23 | 24d | 1 | 0.43mi |
| 20908 NW 1st Dr Pembroke Pines, FL | 3.0 | 2.5 | 1692 | $3,500 | $2.07 | 24d | 1 | 0.43mi |
| 20930 NW 1st St Pembroke Pines, FL | 3.0 | 3.0 | 1617 | $3,600 | $2.23 | 7d | 1 | 0.45mi |
| 20841 NW 1st St Pembroke Pines, FL | 3.0 | 2.0 | 1225 | $3,500 | $2.86 | 24d | 1 | 0.54mi |
| 20807 NW 1st St #20807 Pembroke Pines, FL | 2.0 | 2.5 | 1361 | $2,650 | $1.95 | 16d | 1 | 0.61mi |
| 210 NW 207th Way Pembroke Pines, FL | 3.0 | 2.0 | 1620 | $3,450 | $2.13 | 2d | 1 | 0.63mi |
| 20541 SW 2nd St Pembroke Pines, FL | 3.0 | 3.0 | 1694 | $5,500 | $3.25 | 1d | 1 | 0.95mi |
| 387 SW 206th Ave Pembroke Pines, FL | 3.0 | 2.0 | 1453 | $3,500 | $2.41 | 11d | 1 | 0.99mi |
| 387 SW 206th Ave Pembroke Pines, FL | 3.0 | 2.0 | 1453 | $3,500 | $2.41 | 16d | 1 | 0.99mi |
HOA detail
- Monthly dues
- $110 · $1,320/yr
Listing history 5 events
-
2026-05-22status Pending
-
2026-05-04price $240,000
-
2026-04-30$235,000 Active
-
1995-08-28soldstatus $48,700
-
1983-08-01soldstatus $11,900
ⓘ Source: listings_history table (triggers on properties + properties_extension) + one-shot
backfill from property_details.listing_events for pre-trigger history.
Tax reassessment forecast FL · Resets to sale price
- Current annual tax
- $3,865 · $322/mo
- Projected year-2 tax
- $3,865 · $322/mo
- Expected delta
- $0/yr ($0/mo · 0.0%)
ⓘ Screening estimate from a state-policy table — verify with the county assessor before closing.
Climate risk First Street
- Flood 1/10 Low FEMA zone X (shaded) · 0% chance over 30 yrs
- Wildfire 6/10 Major
- Heat 9/10 Extreme 7 d/yr ≥108°F today · 23 d/yr by 30 yrs out
- Wind 10/10 Extreme 99% chance of damaging wind over 30 yrs
- Air quality 2/10 Low 1 unhealthy d/yr today · 2 by 30 yrs out
Nearby sold comps map
Loading sold comps map…
Walkable amenities ~0.75 mi
Loading nearby amenities…
Taxation est. · year 1
- Rental income
- $44,193
- − Mortgage interest
- −$13,444
- − Property taxes
- −$3,865
- − Insurance
- −$1,200
- − Repairs & maintenance
- −$3,535
- − Management
- −$3,535
- − HOA
- −$1,320
- − Depreciation
- −$6,982
- Taxable income
- $10,311
- Est. tax owed @ 24.0%
- −$2,475
- After-tax cash flow
- $10,949/yr
For passive investors: Depreciation is non-cash, so a rental often shows a tax loss while cash-flowing — sheltering income. Rental losses are passive: they offset passive income freely, and up to $25,000/yr can offset ordinary (W-2) income if you actively participate and your MAGI is under $100k (phasing out to $0 by $150k); unused losses carry forward. On sale, claimed depreciation is recaptured at up to 25%, and gains may owe capital-gains tax (a 1031 exchange can defer both). Figures are a year-1 estimate at your 24.0% rate — not tax advice; consult a CPA.
Schools (NCES district)
- District
- Broward
- NCES district ID
- 1200180
- Math proficiency
- 42% ▼ -18.00%
- Reading proficiency
- 53% ▼ -5.00%
- Median HH income
- $52,139
- Composite
- 40.88/100
- National rank
- #3621
- State rank
- #46 of 73 in FL
Livability — Pembroke Pines
- Score
- 83/100
- State rank
- #54
- US rank
- #933
Category grades
Schools grade is shown separately in the Schools card above.
Census & demographics
- Census place
- Pembroke Pines, FL
- County
- Broward County · 1,963,430 people
- City population
- 180,224
- Metro
- Miami-Fort Lauderdale-Pompano Beach, FL
- Population (ZIP)
- 44,070
- Household income
- $146,237
- Rent vs Own
- Severe rent burden
- 307.0
Population outlook (Broward County) Hauer SSP2
- Today (2025)
- 2,207,033 people
- By 2030
- 2,360,704 · +7.0%
- By 2040
- 2,661,208 · +20.6%
- By 2050
- 2,946,698 · +33.5%
- By 2075
- 3,602,273 · +63.2%
- By 2100
- 3,970,984 · +79.9%
Race, ethnicity, and origin ACS 2023
- Neighborhood character
- Highly diverse neighborhood (Simpson 0.70)
- Race & ethnicity
- Hispanic / Latino 43% Two or more races 29% White 27% Black 20% Asian 7%
- Hispanic origin (detail)
- Mexican 2% Puerto Rican 5% Cuban 14% Dominican 3%
- Common ancestry
- Hispanic 2% Russian 1% Estonian 1%
- Foreign-born
- 33% · Canada, Jamaica, China
- Languages at home
- 53% English-only · Spanish 38% Other Indo-European 4% French/Haitian/Cajun 2%
Political lean MEDSL · Broward
- 2024 margin
- D (+17.0) · D 58.0% · R 41.0%
- 2008→2024 swing
- -17.8pp toward R · 2008: 34.7pp · 2024: 17.0pp
- All cycles
- 2024: D+17.0 2020: D+29.8 2016: D+35.0 2012: D+34.9 2008: D+34.7
Not yet ingested
- Civics
- —
Market trends
- HPI YoY
- ▼ -83.68%
- Current HPI
- 373.7752
- Rent YoY
- ▼ -1.17%
- Metro
- Miami-Fort Lauderdale-Pompano Beach, FL
- State GDP YoY
- ▲ 3.28%
- F500 in state
- 36
Industry mix (Fortune 500 HQ in FL)
| Industry | F500 HQs | Revenue |
|---|---|---|
| Industrial Technology | 2 | $29B |
|
||
| Insurance | 2 | $17B |
|
||
| Retail | 1 | $60B |
|
||
| Technology Distribution | 1 | $58B |
|
||
| Homebuilding | 1 | $35B |
|
||
| Technology Manufacturing | 1 | $35B |
|
||
Price history
+1916.8% since first listed5 events — show timeline
- 2026-05-22 Pending — Beaches MLS
- 2026-05-04 Price Changed $240,000 Beaches MLS
- 2026-04-30 Listed $235,000 Beaches MLS
- 1995-08-28 Sold (Public Records) $48,700 Public Records
- 1983-08-01 Sold (Public Records) $11,900 Public Records
Property tax history
+12.9%/yrLatest (2025): $3,865 · +6.3% YoY. Source: county tax records.
Cash-flow waterfall
monthlySold comps — $/sqft
last 12 mo · ≤1 miLoading sold comps…