None · Crystal, ME
Flood risk No data
- FEMA flood zone
- —
- Chance of flooding over 30 yrs
- —
- Est. flood insurance / yr
- —
Fire risk No data
- Est. fire insurance / yr
- —
Heat risk No data
- Hot days now (above threshold)
- —
- Hot days in 30 yrs
- —
Wind risk No data
- Chance of severe wind over 30 yrs
- —
Air-quality risk No data
- Unhealthy air days now
- —
- Unhealthy air days in 30 yrs
- —
Risk factors via First Street. Map © Google.
Why this score? — see what drove the B+ grade
The composite is a weighted blend of 9 inputs, each scored 0–100. Each bar is that input's sub-score; the figure is the points it added to the 100-point composite (weight × sub-score).
- Cash flow +30.0/30.0
- 1% rule +10.0/10.0
- DSCR +10.0/10.0
- ARV discount +7.5/15.0
- Appreciation +7.2/10.0
- Schools +3.8/10.0
- Rent growth +2.5/5.0
- Livability +2.5/5.0
- Condition / age +2.5/5.0
$45,000
🖨 Deal sheet 📄 Offer letter ✓ Due diligence
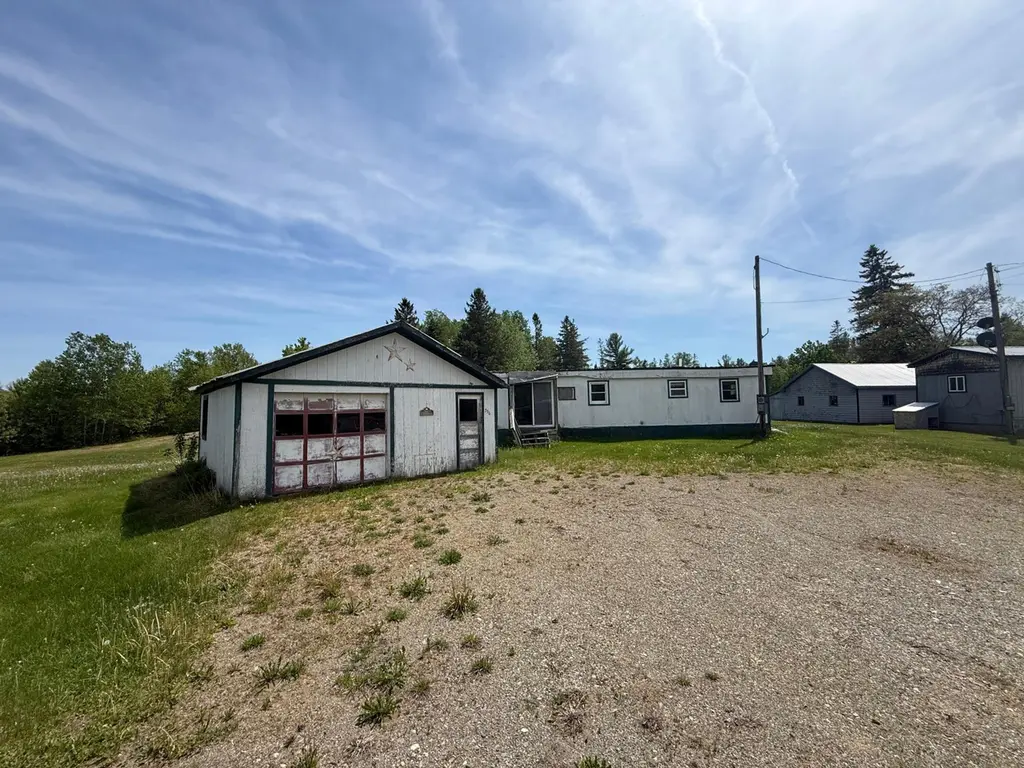
Listing remarks
Seller inherited the property. No information known on condition of home, septic, well, or garage. Sold as is.
Key facts
- 1.46 acre lot
- Garage
- Built 1993
Property features AI
Finance
- Financial info: Annual taxes reported
Exterior
- Parking: Has garage (1 car); Parking for 1–4 vehicles
- Utilities: Well water; Sewer: Unknown
- Home design: Mobile Home; Built in 1993; Residential zoning
- Construction: Mobile construction
- Exterior features: Paved road access; Near town; Rural setting; Level lot
Interior
- Flooring: Carpet
- Bathrooms: One full bathroom
- Heating & cooling: Has heating
- Interior features: Five total rooms; Carpet flooring; Living room on the first level
Neighborhood map
What this means for you Summary
Snapshot
- This is a 2-bed/1.0-bath other listed at $45k.
Deal economics
- At list price, monthly cash flow is $544 ($7k/yr) — positive.
- The deal already cash-flows at list — no discount required.
- Meets the 1% rule at list price ($1k rent vs $45k).
Location & tenants
- Location reads: area grade B — affects rentability + tenant quality, not the cash-flow math above.
- RSU 50 (rural): math 30% / reading 55% proficiency, ranked #103 of 185 in ME (top 56%) — families likely to look elsewhere, expect single-tenant / working-renter base with shorter leases.
- Market conditions: 29 active listings in the ZIP; 112 units permitted in Aroostook County in 2024 (45 in 5+ unit buildings).
Forward outlook
- In year one you build about $2k of equity ($311 loan paydown + $2k appreciation (4.4% local appreciation)).
- Aroostook County population projected at -33% by 2050 — secular population decline; favor cash flow + early exit over multi-decade hold.
- At projected returns (4.4% appreciation + 3.0% rent growth), your $13k cash investment doubles in ~2 years — after that, you're playing with house money.
Negotiation context
- Only 2 days on market — expect competitive offers; lowballing is unlikely to land.
Questions for the listing agent
- Is there a deadline driving the sale (1031 exchange, divorce, estate, relocation)? That informs how much negotiation room exists.
- What's the average days-on-market for RENTAL listings here right now (not sales)? A rising rental-DOM trend means longer vacancies and softer asking-rent achievability than the comps imply.
- What's the recent tenant-quality profile in this submarket — average credit score on applications, eviction rate, late-payment / NSF rate, and stable-employment percentage? A property-management company in the area should have these aggregated.
- How much new for-sale + rental construction is in the pipeline within 1–3 miles? Heavy new supply typically softens prices + rents 12–24 months out; constrained supply supports both.
Investment metrics
- 1% rule
- 2.34% ✓
- Cap rate
- 20.80%
- Cash-on-cash
- 51.80%
- DSCR
- 3.30
- GRM
- 3.6
CMA / ARV
No comps found within radius.
Projected returns pro-forma
4.39% appreciation · 3.0% rent growth · sell at horizon
- IRR
- 58.5%
- Equity multiple
- 4.45×
- Total profit
- $43,454
- Equity at exit
- $23,841
- IRR
- 56.8%
- Equity multiple
- 9.11×
- Total profit
- $102,216
- Equity at exit
- $39,836
Cash invested: $12,600 (down + closing). Projections, not guarantees.
Landlord ↔ Tenant lean methodology
- Overall (STATE)
- 41 Moderately Tenant-Leaning
- State Maine
- 41 Moderately Tenant-Leaning · D+2
- County
- — inherits STATE
- City
- — inherits STATE
ZIP-level market 04747
- Home prices YoY
- 2.6%
- Active inventory
- 29
- Price-to-rent
- 3.6×
Monthly cashflow live
- Estimated rent
- $1,052 medium interval (Pro) →
- Mortgage (P&I)
- −$236
- Tax from tax record
- −$32 /mo · $390/yr
- Insurance
- −$19
- HOA
- −$0
- Vacancy / Maint / Mgmt
- −$221
- Net cashflow
- $544
Break-even live
UW: 25.0% down · 7.5% · 30yr · 1.5% tax · 5.0% vac · 8.0% maint · 8.0% mgmt
Financing live
Cash to close
- Down payment
- $11,250
- Closing costs
- $1,350
- Reserves months
- —
- Total cash needed
- —
Loan-product check · same deal, 3 products live
Conventional
25% down · 7.5% · 30yr
- Down + closing
- —
- Monthly P&I
- —
- Monthly cashflow
- —
- DSCR
- —
- Eligible?
- —
Personal DTI + credit; lowest rate.
DSCR
20% down · 8.5% · 30yr
- Down + closing
- —
- Monthly P&I
- —
- Monthly cashflow
- —
- DSCR
- —
- Eligible?
- —
No personal income docs; deal must DSCR.
Hard money
10% down · 12.0% · 12mo
- Down + closing
- —
- Monthly P&I
- —
- Monthly cashflow
- —
- DSCR
- —
- Eligible?
- —
Short-term bridge; refi at stabilization.
Listing history 3 events
-
2026-06-18status $45,000 Active 2 DOM
-
2026-06-07remarks 110-char remark
-
2026-06-07$45,000 Pending 2 DOM
ⓘ Source: listings_history table (triggers on properties + properties_extension) + one-shot
backfill from property_details.listing_events for pre-trigger history.
Tax reassessment forecast ME · Partial reset (capped growth)
- Current annual tax
- $390 · $32/mo
- Projected year-2 tax
- $501 · $42/mo
- Expected delta
- +$111/yr (+$9/mo · 28.5%)
ⓘ Screening estimate from a state-policy table — verify with the county assessor before closing.
Nearby sold comps map
Loading sold comps map…
Walkable amenities ~0.75 mi
Loading nearby amenities…
Taxation est. · year 1
- Rental income
- $12,625
- − Mortgage interest
- −$2,521
- − Property taxes
- −$390
- − Insurance
- −$225
- − Repairs & maintenance
- −$1,010
- − Management
- −$1,010
- − Depreciation
- −$1,309
- Taxable income
- $6,160
- Est. tax owed @ 24.0%
- −$1,478
- After-tax cash flow
- $5,048/yr
For passive investors: Depreciation is non-cash, so a rental often shows a tax loss while cash-flowing — sheltering income. Rental losses are passive: they offset passive income freely, and up to $25,000/yr can offset ordinary (W-2) income if you actively participate and your MAGI is under $100k (phasing out to $0 by $150k); unused losses carry forward. On sale, claimed depreciation is recaptured at up to 25%, and gains may owe capital-gains tax (a 1031 exchange can defer both). Figures are a year-1 estimate at your 24.0% rate — not tax advice; consult a CPA.
Schools (NCES district)
- District
- RSU 50
- NCES district ID
- 2314806
- Math proficiency
- 30% ▼ -3.00%
- Reading proficiency
- 55% ▲ 7.00%
- Median HH income
- $36,091
- Composite
- 37.51/100
- National rank
- #8882
- State rank
- #103 of 185 in ME
Livability — Crystal
No livability data for this city. (Only ~50 U.S. cities are tracked.)
Census & demographics
- Population (ZIP)
- 1,318
Population outlook (Aroostook County) Hauer SSP2
- Today (2025)
- 61,905 people
- By 2030
- 57,815 · -6.6%
- By 2040
- 49,240 · -20.5%
- By 2050
- 41,386 · -33.1%
- By 2075
- 27,664 · -55.3%
- By 2100
- 18,974 · -69.3%
Race, ethnicity, and origin ACS 2023
- Neighborhood character
- Predominantly White (89%)
- Race & ethnicity
- White 89% Two or more races 4% Native American 3% Asian 2% Hispanic / Latino 1%
- Common ancestry
- Slovak 12% Lithuanian 10% Polish 5%
- Foreign-born
- 3% · China, Canada
- Languages at home
- 96% English-only · Chinese 2% German/W. Germanic 2% Spanish 1%
Political lean MEDSL · Aroostook
- 2024 margin
- Strong R (+26.2) · D 36.2% · R 62.4% · Other 1.4%
- 2008→2024 swing
- -35.8pp toward R · 2008: 9.6pp · 2024: -26.2pp
- All cycles
- 2024: R+26.2 2020: R+19.9 2016: R+17.3 2012: D+7.7 2008: D+9.6
Not yet ingested
- Civics
- —
Market trends
- HPI YoY
- ▲ 4.39%
- Current HPI
- 170.9479
- Rent YoY
- —
- Metro
- —
- State GDP YoY
- —
- F500 in state
- 0
Price history
2 events — show timeline
- 2026-06-07 Pending — MREIS
- 2026-06-05 Listed $45,000 MREIS
Property tax history
+1.2%/yrLatest (2021): $390 · -4.6% YoY. Source: county tax records.
Cash-flow waterfall
monthlySold comps — $/sqft
last 12 mo · ≤1 miLoading sold comps…