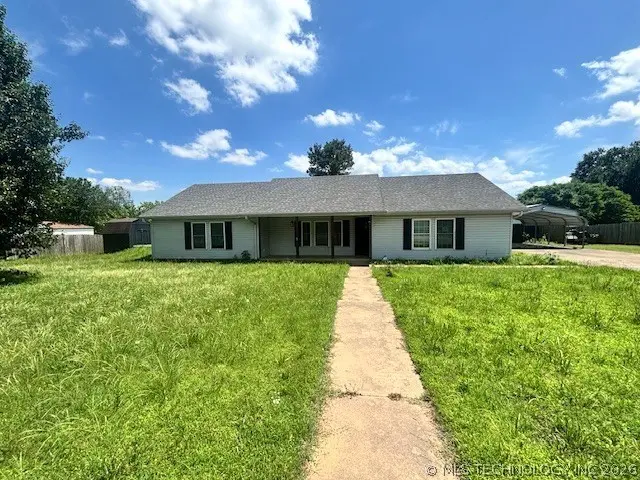
406 Eagle Rock Rd · Muldrow, OK
Flood risk 1/10 · Minimal
- FEMA flood zone
- X (unshaded)
- Chance of flooding over 30 yrs
- 0.0%
- Est. flood insurance / yr
- $507 – $1,088
Fire risk 8/10 · Major
- Est. fire insurance / yr
- $2,463 – $4,575
Heat risk 7/10 · Major
- Hot days now (above 111°F)
- 7 days/yr
- Hot days in 30 yrs
- 21 days/yr
Wind risk 2/10 · Minimal
- Chance of severe wind over 30 yrs
- 4.0%
Air-quality risk 2/10 · Minimal
- Unhealthy air days now
- 0 days/yr
- Unhealthy air days in 30 yrs
- 1 days/yr
Risk factors via First Street. Map © Google.
Why this score? — see what drove the D+ grade
The composite is a weighted blend of 9 inputs, each scored 0–100. Each bar is that input's sub-score; the figure is the points it added to the 100-point composite (weight × sub-score).
- ARV discount +13.4/15.0
- Appreciation +10.0/10.0
- Cash flow +9.3/30.0
- Livability +2.8/5.0
- DSCR +2.6/10.0
- Rent growth +2.5/5.0
- Schools +2.5/10.0
- Condition / age +2.5/5.0
- 1% rule +1.7/10.0
$187,500
🖨 Deal sheet (PDF) 📄 Offer letter ✓ Due diligence
Listing remarks MLS
OMGoodness! Is this home not the cutest?! This adorable open-concept kitchen, dining room, and living room home has 3 spacious bedrooms and 2 bathrooms. Not to mention the trendy black accent wall in the laundry room! Plus, the large backyard for your furry friends! This one checks all the boxes for that perfect home in a neighborhood, but has a great amount of space! BACK ON MARKET AT NO FAULT TO SELLER! * * Inspection has been done! * *
Key facts
- Carport
- Abundant cabinetry
- Vaulted ceilings
Tags
Property features AI
Finance
- HOA & community: Gutters noted as a community feature
Exterior
- Parking: 1-car garage; Carport
- Security: Storm shelter; Smoke detectors
- Utilities: Electricity available; Natural gas available; Water available (rural); Septic tank
- Home design: Single-story home; Faces north; Slab foundation
- Construction: Built (per public records); Vinyl siding with wood frame construction; Asphalt/fiberglass roof
- Exterior features: Covered patio and porch; Rain gutters; Privacy fencing; Shed(s); Storm shelter; Smoke detectors
Interior
- Kitchen: Oven; Range; Dishwasher; Gas range connection
- Flooring: Laminate flooring; Tile flooring
- Bathrooms: 2 full bathrooms
- Heating & cooling: Central heating (gas); Central air conditioning
- Interior features: Ceiling fans; Laminate countertops; Vinyl window frames
- Laundry & utility: Washer hookup; Electric dryer hookup; Electric and gas water heaters
Neighborhood map
What this means for you Summary
Snapshot
- This is a 3-bed/2.0-bath single-family listed at $188k.
Deal economics
- At list price, monthly cash flow is $-138 ($-2k/yr) — negative.
- To cash-flow at today's rent, offer at most $163k (13.0% below list).
- To meet the 1% rule (rent ≥ 1% of price), the offer needs to be $125k (33.3% below list).
- Recommended offer: $125k (33.3% below list) — sets the bar for 1% rule.
- Cap rate 5.4% vs local median 3.8% in Muldrow — top-decile yield for the area; either an underpriced asset or a hidden risk that comps aren't pricing in. Stress-test before assuming the spread holds.
Location & tenants
- Location reads 56/100 on livability (#505 in OK) — a working-class tenant base; expect higher turnover. Strengths: cost of living A+, housing A; Watch: crime F, amenities F, commute F.
- Muldrow (town): math 29% / reading 30% proficiency, ranked #71 of 270 in OK (top 26%) — low school quality limits family demand, transient renter base, plan for 1-2y turnover; 62% free/reduced lunch — lower-income household profile, screen leases tightly.
- Zoned schools: Muldrow Es (math 32% / reading 32%, grade F, #213 of 845 statewide, top 28%, 484 students, 0% FRL); Muldrow Ms (math 31% / reading 26%, grade F, #57 of 345 statewide, top 18%, 329 students, 0% FRL); Muldrow Hs (math 17% / reading 37%, grade F, #125 of 447 statewide, top 31%, 479 students, 0% FRL) — zoned schools average 0% FRL vs 62% district-wide (62 pts lower); this property's tenant base skews higher-income than the district average.
- Market conditions: 110 active listings in the ZIP; 1 comparable units currently listed for rent nearby; 125 units permitted in Sequoyah County in 2024 (0 in 5+ unit buildings).
Forward outlook
- In year one you build about $20k of equity ($1k loan paydown + $19k appreciation (10.0% local appreciation)).
- Sequoyah County population projected at -16% by 2050 — secular population decline; favor cash flow + early exit over multi-decade hold.
- By year 2, paydown + projected appreciation supports a ~$32k cash-out refi (75% LTV) — recoverable capital for the next deal without selling this one.
Negotiation context
- It's been on market 20 days — a 2% lower offer ($185k) is reasonable based on typical stale-listing flexibility.
- 3 sale attempts since 4y ago with the ask held roughly flat each time — persistent listings suggest the price (not the market) is what's stuck; bring a comps-based counter.
Risks & watch-outs
- Climate carrying-cost: severe wildfire risk; extreme-heat days projected 7→21/yr by 2055 (HVAC capex compounding) — expect insurance premiums to compound above CPI over the hold.
Questions for the listing agent
- What do current leases actually rent for vs. the listed asking? Can we see a recent rent roll and the last 12 months of T-12 income?
- Is there a deadline driving the sale (1031 exchange, divorce, estate, relocation)? That informs how much negotiation room exists.
- Schools are F-rated, which usually means shorter tenancies and higher turnover. Who's the typical renter profile here, and what's been the actual vacancy rate?
- Crime grade is F in this area — have there been break-ins, vandalism, or insurance claims at this property in the last 3 years? What carrier currently insures it and at what premium?
- The area grade is low — what's the realistic commute time and amenity access for the typical tenant pool here? Any planned neighborhood developments (good or bad) we should know about?
- What's the average days-on-market for RENTAL listings here right now (not sales)? A rising rental-DOM trend means longer vacancies and softer asking-rent achievability than the comps imply.
- What's the recent tenant-quality profile in this submarket — average credit score on applications, eviction rate, late-payment / NSF rate, and stable-employment percentage? A property-management company in the area should have these aggregated.
- How much new for-sale + rental construction is in the pipeline within 1–3 miles? Heavy new supply typically softens prices + rents 12–24 months out; constrained supply supports both.
Investment metrics
- 1% rule
- 0.67% ✗
- Cap rate
- 5.41%
- Cash-on-cash
- -3.14%
- DSCR
- 0.86
- GRM
- 12.5
CMA / ARV
- ARV (on-the-fly)
- $215,900
- Comps found
- 2
Show comp detail 2 sales within ~0.75 mi
| Address | Dist | Beds/Ba | Sqft | Sold | Price | $/sf | Match |
|---|---|---|---|---|---|---|---|
| 410 Eagle Rock Rd | 0.05mi | 3/2.0 | 1,800 (+6%) | 13mo | $228,800 | $127 | 77 |
| 1104 Bran Britt Ln | 0.64mi | 3/2.0 | 1,766 (+4%) | 5mo | $220,000 | $125 | 60 |
Match score weights: distance 35% · size 25% · config 20% · recency 20%. Top-matched comps best support the ARV.
Projected returns pro-forma
10.0% appreciation · 3.0% rent growth · sell at horizon
- IRR
- 22.0%
- Equity multiple
- 2.78×
- Total profit
- $93,270
- Equity at exit
- $168,915
- IRR
- 19.8%
- Equity multiple
- 6.36×
- Total profit
- $281,384
- Equity at exit
- $364,271
Cash invested: $52,500 (down + closing). Projections, not guarantees.
Landlord ↔ Tenant lean methodology
- Overall (STATE)
- 83 Strongly Landlord-Friendly
- State Oklahoma
- 83 Strongly Landlord-Friendly · R+20
- County
- — inherits STATE
- City
- — inherits STATE
ZIP-level market 74948
- Home prices YoY
- 17.6%
- Active inventory
- 110
- Price-to-rent
- 12.5×
Monthly cashflow live
- Estimated rent
- $1,250 medium interval (Pro) →
- Mortgage (P&I)
- −$983
- Tax from tax record
- −$64 /mo · $764/yr
- Insurance
- −$78
- HOA
- −$0
- Vacancy / Maint / Mgmt
- −$262
- Net cashflow
- $-138
Break-even live
Sensitivity live
| Price | -10% $-31 | -5% $-84 | +0% $-138 | +5% $-191 | +10% $-244 |
|---|---|---|---|---|---|
| Rent | -10% $-236 | -5% $-187 | +0% $-138 | +5% $-88 | +10% $-39 |
| Rate | -1.0pp $-43 | -0.5pp $-90 | base $-138 | +0.5pp $-186 | +1.0pp $-236 |
UW: 25.0% down · 7.5% · 30yr · 1.5% tax · 5.0% vac · 8.0% maint · 8.0% mgmt
Financing live
Cash to close
- Down payment
- $46,875
- Closing costs
- $5,625
- Reserves months
- —
- Total cash needed
- —
Loan-product check · same deal, 3 products live
Conventional
25% down · 7.5% · 30yr
- Down + closing
- —
- Monthly P&I
- —
- Monthly cashflow
- —
- DSCR
- —
- Eligible?
- —
Personal DTI + credit; lowest rate.
DSCR
20% down · 8.5% · 30yr
- Down + closing
- —
- Monthly P&I
- —
- Monthly cashflow
- —
- DSCR
- —
- Eligible?
- —
No personal income docs; deal must DSCR.
Hard money
10% down · 12.0% · 12mo
- Down + closing
- —
- Monthly P&I
- —
- Monthly cashflow
- —
- DSCR
- —
- Eligible?
- —
Short-term bridge; refi at stabilization.
Rent comps 1 comps
| Address | Beds | Baths | Sqft | Rent | $/sqft | DOM | Units | Dist |
|---|---|---|---|---|---|---|---|---|
| 908 Cherry Loop Muldrow, OK | 3.0 | 2.0 | 1240 | $1,250 | $1.01 | 5d | 1 | 0.65mi |
Listing history 15 events
-
2026-06-21days on market $187,500 Active 20 DOM
-
2026-06-19days on market $187,500 Active 18 DOM
-
2026-06-18days on market $187,500 Active 17 DOM
-
2026-06-17days on market $187,500 Active 16 DOM
-
2026-06-16days on market $187,500 Active 15 DOM
-
2026-06-15days on market $187,500 Active 14 DOM
-
2026-06-14days on market $187,500 Active 12 DOM
-
2026-06-13days on market $187,500 Active 11 DOM
-
2026-06-10days on market $187,500 Active 9 DOM
-
2026-06-09days on market $187,500 Active 8 DOM
-
2026-06-08days on market $187,500 Active 7 DOM
-
2026-06-07days on market $187,500 Active 6 DOM
-
2026-06-05days on market $187,500 Active 3 DOM
-
2026-06-02remarks 699-char remark
-
2026-06-02$187,500 Active 1 DOM
ⓘ Source: listings_history table (triggers on properties + properties_extension) + one-shot
backfill from property_details.listing_events for pre-trigger history.
Tax reassessment forecast OK · Resets to sale price
- Current annual tax
- $764 · $64/mo
- Projected year-2 tax
- $1,687 · $141/mo
- Expected delta
- +$923/yr (+$77/mo · 120.9%)
ⓘ Screening estimate from a state-policy table — verify with the county assessor before closing.
Climate risk First Street
- Flood 1/10 Low FEMA zone X (unshaded) · 0% chance over 30 yrs
- Wildfire 8/10 Severe
- Heat 7/10 Severe 7 d/yr ≥111°F today · 21 d/yr by 30 yrs out
- Wind 2/10 Low 4% chance of damaging wind over 30 yrs
- Air quality 2/10 Low 0 unhealthy d/yr today · 1 by 30 yrs out
Nearby sold comps map
Loading sold comps map…
Walkable amenities ~0.75 mi
Loading nearby amenities…
Taxation est. · year 1
- Rental income
- $15,000
- − Mortgage interest
- −$10,503
- − Property taxes
- −$764
- − Insurance
- −$938
- − Repairs & maintenance
- −$1,200
- − Management
- −$1,200
- − Depreciation
- −$5,455
- Taxable loss
- −$5,059
- Est. tax savings @ 24.0%
- +$1,214
- After-tax cash flow
- $-437/yr
For passive investors: Depreciation is non-cash, so a rental often shows a tax loss while cash-flowing — sheltering income. Rental losses are passive: they offset passive income freely, and up to $25,000/yr can offset ordinary (W-2) income if you actively participate and your MAGI is under $100k (phasing out to $0 by $150k); unused losses carry forward. On sale, claimed depreciation is recaptured at up to 25%, and gains may owe capital-gains tax (a 1031 exchange can defer both). Figures are a year-1 estimate at your 24.0% rate — not tax advice; consult a CPA.
Schools (NCES district)
- District
- Muldrow
- NCES district ID
- 4020880
- Math proficiency
- 29% ▼ -11.00%
- Reading proficiency
- 30% ▼ -9.00%
- Median HH income
- $39,775
- Composite
- 24.81/100
- National rank
- #7595
- State rank
- #71 of 270 in OK
Livability — Muldrow
- Score
- 56/100
- State rank
- #505
- US rank
- #22502
Category grades
Schools grade is shown separately in the Schools card above.
Census & demographics
- Census place
- Muldrow, OK
- Population (ZIP)
- 11,946
Population outlook (Sequoyah County) Hauer SSP2
- Today (2025)
- 39,398 people
- By 2030
- 38,215 · -3.0%
- By 2040
- 35,625 · -9.6%
- By 2050
- 32,943 · -16.4%
- By 2075
- 27,805 · -29.4%
- By 2100
- 23,311 · -40.8%
Race, ethnicity, and origin ACS 2023
- Neighborhood character
- Diverse neighborhood (Simpson 0.59)
- Race & ethnicity
- White 64% Native American 16% Two or more races 15% Hispanic / Latino 6% Asian 1%
- Hispanic origin (detail)
- Mexican 5%
- Common ancestry
- Italian 1% Slovak 1% Serbian 1%
- Foreign-born
- 3% · Canada
- Languages at home
- 92% English-only · Spanish 5% Tagalog/Filipino 1%
Political lean MEDSL · Sequoyah
- 2024 margin
- Solid R (+61.5) · D 18.6% · R 80.2% · Other 1.2%
- 2008→2024 swing
- -25.5pp toward R · 2008: -36.0pp · 2024: -61.5pp
- All cycles
- 2024: R+61.5 2020: R+59.0 2016: R+54.2 2012: R+39.1 2008: R+36.0
Not yet ingested
- Civics
- —
Market trends
- HPI YoY
- ▲ 38.01%
- Current HPI
- 253.7544
- Rent YoY
- —
- Metro
- —
- State GDP YoY
- ▲ 1.55%
- F500 in state
- 6
Industry mix (Fortune 500 HQ in OK)
| Industry | F500 HQs | Revenue |
|---|---|---|
| Energy | 3 | $48B |
|
||
Price history
+146.7% since first listed8 events — show timeline
- 2026-05-31 Listed $187,500 MLS Technology, Inc.
- 2024-02-16 Listed $232,900 WRVBOR
- 2022-09-27 Sold (Public Records) $206,000 Public Records
- 2022-09-23 Sold (MLS) $206,000 WRVBOR
- 2022-07-30 Listed $197,000 WRVBOR
- 2017-11-15 Sold (Public Records) $90,000 Public Records
- 2008-06-02 Sold (Public Records) $88,000 Public Records
- 1996-12-11 Sold (Public Records) $76,000 Public Records
Property tax history
+0.7%/yrLatest (2025): $764 · +21.1% YoY. Source: county tax records.
Cash-flow waterfall
monthlySold comps — $/sqft
last 12 mo · ≤1 miLoading sold comps…