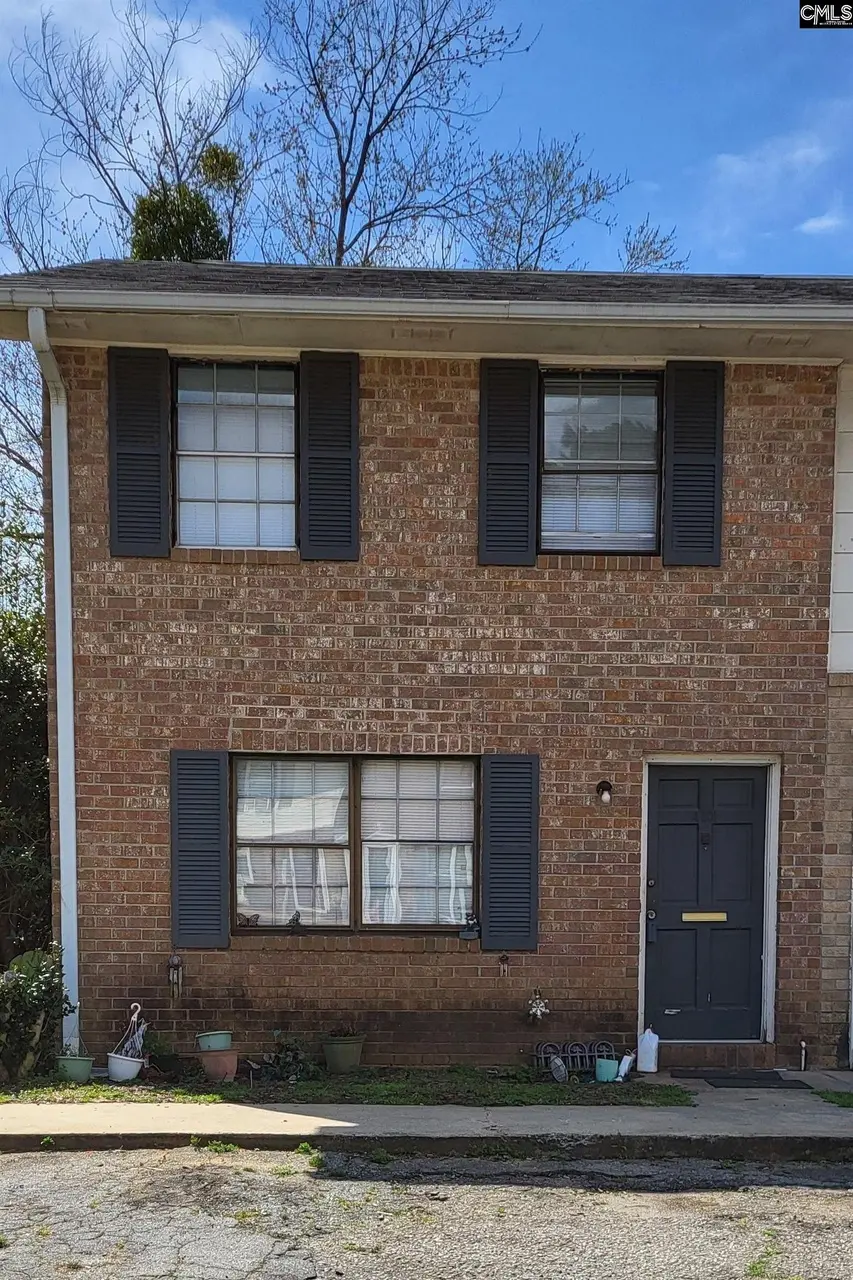
4601 Grove Park Ln · St. Andrews, SC
Flood risk 1/10 · Minimal
- FEMA flood zone
- X (unshaded)
- Chance of flooding over 30 yrs
- 0.0%
- Est. flood insurance / yr
- $507 – $1,088
Fire risk 1/10 · Minimal
- Est. fire insurance / yr
- $783 – $1,453
Heat risk 6/10 · Moderate
- Hot days now (above 108°F)
- 7 days/yr
- Hot days in 30 yrs
- 16 days/yr
Wind risk 6/10 · Moderate
- Chance of severe wind over 30 yrs
- 64.0%
Air-quality risk 3/10 · Minor
- Unhealthy air days now
- 2 days/yr
- Unhealthy air days in 30 yrs
- 3 days/yr
Risk factors via First Street. Map © Google.
Why this score? — see what drove the B- grade
The composite is a weighted blend of 9 inputs, each scored 0–100. Each bar is that input's sub-score; the figure is the points it added to the 100-point composite (weight × sub-score).
- Cash flow +30.0/30.0
- 1% rule +10.0/10.0
- DSCR +10.0/10.0
- ARV discount +7.5/15.0
- Rent growth +3.8/5.0
- Schools +2.6/10.0
- Livability +2.5/5.0
- Condition / age +2.5/5.0
- Appreciation +0.0/10.0
$69,000
🖨 Deal sheet 📄 Offer letter ✓ Due diligence
Listing remarks
CHECK THIS OUT: BRICK END UNIT in Convenient Grove Park! It's ready & waiting for a total remodel to make this your dream home!! LIVING ROOM with DINING AREA open to KITCHEN. Upstairs are 2 large BEDROOMS and a FULL BATH. LAUNDRY ROOM off kitchen. You have views of the COMMON POND from your GATED PRIVATE PATIO. Convenient to Interstates and Downtown, shopping at Columbiana Mall & Harbison Blvd, enjoy Nature and Hiking Trails at close by Harbison State Forest. Disclaimer: CMLS has not reviewed and, therefore, does not endorse vendors who may appear in listings. Disclaimer: CMLS has not reviewed and, therefore, does not endorse vendors who may appear in listings.
Key facts
- Gated private patio
- Brick end unit
- $189 HOA
Tags
Property features AI
Finance
- HOA & community: Property is part of an association; Association covers common area maintenance, sewer, trash, and water
Exterior
- Parking: 2 parking spaces
- Utilities: Public water; Public sewer
- Home design: Two-story property; Public water with common pond frontage; Paved road access
- Construction: Slab foundation
- Exterior features: Patio; Partial brick above foundation
Interior
- Kitchen: Eat-in kitchen; Formica countertops; Painted cabinets; Refrigerator; Free-standing range
- Bedrooms: Master bedroom with ceiling fan, private closet, and carpeted floors (Second level); Second bedroom with ceiling fan, private closet, and carpeted floors (Second level)
- Flooring: Carpet in bedrooms; Tile in living room and formal dining area
- Bathrooms: One full bath; One half bath; One additional partial bath
- Heating & cooling: Central heating; Window air conditioning units
- Interior features: Ceiling fan; Refrigerator; Electric water heater; Free-standing range
- Laundry & utility: Utility room on main level; Washer/Dryer located on main level
Neighborhood map
What this means for you Summary
Snapshot
- This is a 2-bed/2.0-bath condo listed at $69k.
Deal economics
- At list price, monthly cash flow is $427 ($5k/yr) — positive.
- The deal already cash-flows at list — no discount required.
- Meets the 1% rule at list price ($1k rent vs $69k).
- Recommended offer: $65k (6.0% below list) — sets the bar for market timing.
Location & tenants
- Location reads: area grade B — affects rentability + tenant quality, not the cash-flow math above.
- Richland 01 (urban): math 26% / reading 36% proficiency, ranked #54 of 80 in SC (top 68%) — families likely to look elsewhere, expect single-tenant / working-renter base with shorter leases; 64% free/reduced lunch — lower-income household profile, screen leases tightly.
- Zoned schools: Pine Grove Elementary (math 24% / reading 15%, grade F, #496 of 597 statewide, top 83%, 541 students, 100% FRL); Columbia High (math 17% / reading 67%, grade F, #174 of 196 statewide, top 90%, 665 students, 100% FRL) — zoned schools average 100% FRL vs 64% district-wide (36 pts higher); higher-poverty schools than district average — tighter screening recommended.
- Market conditions: Rents rising fast (+5.0%/yr); 145 active listings in the ZIP; 33 comparable units currently listed for rent nearby; rentals at typical pace (median 22d on market — plan ~3-4 weeks tenant-placement turnaround); 3,472 units permitted in Richland County in 2024 (1,096 in 5+ unit buildings).
- This rent runs 32% of the median local income ($51k/yr) — at the standard rent-burdened threshold; future hikes will face affordability resistance.
Forward outlook
- Local home prices are declining (-3.0%/yr); year-one equity from $477 of loan paydown is wiped out by about $2k of value loss. Plan a longer hold.
- Richland County population projected at +30% by 2050 — long-run rental-demand tailwind backs the buy-and-hold thesis.
- At projected returns (-3.0% appreciation + 5.0% rent growth), your $19k cash investment doubles in ~5 years — after that, you're playing with house money.
Negotiation context
- It's been on market 73 days — a 6% lower offer ($65k) is reasonable based on typical stale-listing flexibility.
- 6 sale attempts since 2y ago with the ask held roughly flat each time — persistent listings suggest the price (not the market) is what's stuck; bring a comps-based counter.
Risks & watch-outs
- Climate carrying-cost: major wind risk, 64% chance of damaging wind over 30y; extreme-heat days projected 7→16/yr by 2055 (HVAC capex compounding) — expect insurance premiums to compound above CPI over the hold.
Questions for the listing agent
- It's been on market 73 days. Have you received any prior offers? Is the seller open to a 6% concession, seller financing, or rate buy-down credit?
- Built in 1972 — when were the roof, HVAC, electrical panel, plumbing, and water heater last replaced?
- What does the HOA fee cover, when was the last increase, and are there any pending special assessments or reserve-fund shortfalls?
- Any open or pending special assessments — roof, HVAC, plumbing, elevator, façade? What's the per-unit balance and payoff schedule, and is the seller paying it off at close or rolling it to the buyer?
- Why hasn't it sold? Are there any deal-killer items the seller is aware of (foundation, flood, title, zoning, code violations)?
- Is there a deadline driving the sale (1031 exchange, divorce, estate, relocation)? That informs how much negotiation room exists.
- What's the average days-on-market for RENTAL listings here right now (not sales)? A rising rental-DOM trend means longer vacancies and softer asking-rent achievability than the comps imply.
- What's the recent tenant-quality profile in this submarket — average credit score on applications, eviction rate, late-payment / NSF rate, and stable-employment percentage? A property-management company in the area should have these aggregated.
- How much new apartment / multifamily construction is in the pipeline within 1–3 miles? Heavy new supply (>2% of stock underway) typically softens rents 12–24 months out; light construction supports rent growth.
Investment metrics
- 1% rule
- 1.96% ✓
- Cap rate
- 13.72%
- Cash-on-cash
- 26.54%
- DSCR
- 2.18
- GRM
- 4.2
CMA / ARV
No comps found within radius.
Projected returns pro-forma
-3.0% appreciation · 5.0% rent growth · sell at horizon
- IRR
- 23.1%
- Equity multiple
- 1.98×
- Total profit
- $18,939
- Equity at exit
- $10,288
- IRR
- 32.6%
- Equity multiple
- 4.31×
- Total profit
- $63,919
- Equity at exit
- $5,966
Cash invested: $19,320 (down + closing). Projections, not guarantees.
Landlord ↔ Tenant lean methodology
- Overall (STATE)
- 90 Strongly Landlord-Friendly
- State South Carolina
- 90 Strongly Landlord-Friendly · R+6
- County
- — inherits STATE
- City
- — inherits STATE
ZIP-level market 29210
- Home prices YoY
- -32.2%
- Rents YoY
- 5.0%
- Active inventory
- 145
- Price-to-rent
- 4.2×
Monthly cashflow live
- Estimated rent
- $1,354 high interval (Pro) →
- Mortgage (P&I)
- −$362
- Tax from tax record
- −$63 /mo · $757/yr
- Insurance
- −$29
- HOA
- −$189
- Vacancy / Maint / Mgmt
- −$284
- Net cashflow
- $427
Break-even live
UW: 25.0% down · 7.5% · 30yr · 1.5% tax · 5.0% vac · 8.0% maint · 8.0% mgmt
Financing live
Cash to close
- Down payment
- $17,250
- Closing costs
- $2,070
- Reserves months
- —
- Total cash needed
- —
Loan-product check · same deal, 3 products live
Conventional
25% down · 7.5% · 30yr
- Down + closing
- —
- Monthly P&I
- —
- Monthly cashflow
- —
- DSCR
- —
- Eligible?
- —
Personal DTI + credit; lowest rate.
DSCR
20% down · 8.5% · 30yr
- Down + closing
- —
- Monthly P&I
- —
- Monthly cashflow
- —
- DSCR
- —
- Eligible?
- —
No personal income docs; deal must DSCR.
Hard money
10% down · 12.0% · 12mo
- Down + closing
- —
- Monthly P&I
- —
- Monthly cashflow
- —
- DSCR
- —
- Eligible?
- —
Short-term bridge; refi at stabilization.
Rent comps 33 comps
| Address | Beds | Baths | Sqft | Rent | $/sqft | DOM | Units | Dist |
|---|---|---|---|---|---|---|---|---|
| 1335 Cactus Ave Columbia, SC | 3.0 | 2.0 | 1155 | $1,450 | $1.26 | 14d | 1 | 0.06mi |
| 135 Hunters Grove Dr Columbia, SC | 3.0 | 2.5 | 1428 | $1,595 | $1.12 | 21d | 1 | 0.16mi |
| 217 Wynn Way Unit B Columbia, SC | 2.0 | 1.5 | 1160 | $1,095 | $0.94 | 19d | 1 | 0.29mi |
| 4248 Donavan Dr Columbia, SC | 3.0 | 2.0 | 1231 | $1,586 | $1.29 | 19d | 1 | 0.51mi |
| 1473 Haviland Cir Columbia, SC | 3.0 | 2.0 | 1425 | $1,499 | $1.05 | 11d | 1 | 0.52mi |
| 846 Piney Grove Rd Columbia, SC | 3.0 | 2.5 | 1400 | $1,495 | $1.07 | 23d | 1 | 0.53mi |
| 51 Heritage Village Ln Unit 1 Columbia, SC | 2.0 | 2.0 | 1150 | $1,400 | $1.22 | 23d | 1 | 0.81mi |
| 169 Brook Pines Dr Columbia, SC | 1.0–2.0 | 1.0 | 700 | $1,185 | $1.69 | 11d | 26 | 0.89mi |
| 14 Heritage Village Ln Columbia, SC | 2.0 | 2.0 | 1100 | $2,150 | $1.95 | 23d | 1 | 0.93mi |
| 800 Beatty Rd Columbia, SC | 1.0–3.0 | 1.0–1.5 | 930 | $1,074 | $1.15 | 23d | 1 | 0.96mi |
| 265 Timber Ct Columbia, SC | 3.0 | 1.5 | 1000 | $1,495 | $1.50 | 21d | 1 | 0.98mi |
| 405 Hickory Hill Dr Unit 405 Columbia, SC | 3.0 | 1.5 | 1400 | $1,400 | $1.00 | 23d | 1 | 0.99mi |
| 801 Chinquapin Rd Columbia, SC | 1.0–2.0 | 1.0–1.5 | 729 | $1,200 | $1.64 | 3d | 7 | 1.05mi |
| 171 Winding Chestnut Dr Columbia, SC | 3.0 | 2.5 | 1335 | $1,975 | $1.48 | 23d | 1 | 1.13mi |
| 1008 Creekside Way Unit 1 Columbia, SC | 2.0 | 2.0 | 1150 | $1,295 | $1.13 | 11d | 1 | 1.13mi |
| 1002 Creekside Way Columbia, SC | 2.0 | 2.0 | 1200 | $1,350 | $1.12 | 14d | 1 | 1.14mi |
| 6007 Village Creek Dr Unit 6007 Columbia, SC | 2.0 | 2.0 | 1300 | $1,195 | $0.92 | 23d | 1 | 1.18mi |
| 240 Jamil Rd #3 Columbia, SC | 2.0 | 1.5 | 1027 | $1,250 | $1.22 | 23d | 1 | 1.25mi |
| 240 Jamil Rd Columbia, SC | 2.0 | 1.5 | 1013 | $1,172 | $1.16 | 3d | 2 | 1.25mi |
| 1211 Metze Rd Unit G3 Columbia, SC | 2.0 | 2.0 | 826 | $1,100 | $1.33 | 21d | 1 | 1.25mi |
| 3609 Juneau Rd Unit A4 Columbia, SC | 2.0 | 2.0 | 1000 | $1,195 | $1.20 | 19d | 1 | 1.29mi |
| 3500 Fernandina Rd Columbia, SC | 1.0–2.0 | 1.0–1.5 | 1011 | $1,350 | $1.34 | 23d | 5 | 1.31mi |
| 3609 Juneau Rd Unit B28 Columbia, SC | 2.0 | 2.0 | 1000 | $995 | $0.99 | 23d | 1 | 1.32mi |
| 3609 Juneau Rd Unit F 74 Columbia, SC | 2.0 | 2.0 | 1000 | $1,145 | $1.15 | 2d | 1 | 1.34mi |
| 3609 Juneau Rd Unit 3609 F-73 Columbia, SC | 2.0 | 2.0 | 1000 | $1,195 | $1.20 | 23d | 1 | 1.34mi |
| 3609 Juneau Rd Unit F73 Columbia, SC | 2.0 | 2.0 | 1000 | $1,255 | $1.25 | 21d | 1 | 1.34mi |
| 1212 Metze Rd Columbia, SC | 1.0–3.0 | 1.0–2.0 | 1026 | $1,125 | $1.10 | 23d | 13 | 1.37mi |
| 3406 Fernandina Rd Columbia, SC | 2.0 | 2.0 | 1008 | $1,245 | $1.24 | 23d | 1 | 1.39mi |
| 121 Manorwood Ct Unit C Columbia, SC | 2.0 | 1.5 | 1120 | $1,095 | $0.98 | 23d | 1 | 1.41mi |
| 408 Foxfire Dr Columbia, SC | 1.0–3.0 | 1.0–2.0 | 1016 | $1,092 | $1.08 | 3d | 7 | 1.44mi |
| 100 Fairforest Rd Columbia, SC | 2.0 | 1.5 | 1150 | $1,224 | $1.06 | 3d | 3 | 1.45mi |
| 3300 Kay St Columbia, SC | 2.0 | 2.5 | 1200 | $1,350 | $1.12 | 14d | 19 | 1.45mi |
| 105 Manorwood Ct Columbia, SC | 2.0 | 1.5 | 1000 | $1,150 | $1.15 | 23d | 1 | 1.46mi |
HOA detail condo
- Monthly dues
- $189 · $2,268/yr
- Likely covers
- security
- Assessments
- None detected in remarks — confirm with the listing agent.
Listing history 25 events
-
2026-06-18days on market $69,000 Active 73 DOM
-
2026-06-17days on market $69,000 Active 72 DOM
-
2026-06-16days on market $69,000 Active 71 DOM
-
2026-06-15days on market $69,000 Active 70 DOM
-
2026-06-14days on market $69,000 Active 68 DOM
-
2026-06-10days on market $69,000 Active 65 DOM
-
2026-06-09days on market $69,000 Active 64 DOM
-
2026-06-08days on market $69,000 Active 63 DOM
-
2026-06-07days on market $69,000 Active 62 DOM
-
2026-06-03days on market $69,000 Active 58 DOM
-
2026-06-03days on market $69,000 Active 57 DOM
-
2026-06-01days on market $69,000 Active 56 DOM
-
2026-05-31days on market $69,000 Active 55 DOM
-
2026-04-06$69,000 Active
-
2026-04-01historical
-
2025-06-27price $73,500
-
2025-04-21status Active
-
2025-04-20historical
-
2025-04-01status Active
-
2025-03-29historical
-
2025-02-01status Active
-
2025-02-01historical
-
2024-11-11status Active
-
2024-11-11historical
-
2024-06-12$78,500 Active
ⓘ Source: listings_history table (triggers on properties + properties_extension) + one-shot
backfill from property_details.listing_events for pre-trigger history.
Tax reassessment forecast SC · Resets to sale price
- Current annual tax
- $757 · $63/mo
- Projected year-2 tax
- $757 · $63/mo
- Expected delta
- $0/yr ($0/mo · 0.0%)
ⓘ Screening estimate from a state-policy table — verify with the county assessor before closing.
Climate risk First Street
- Flood 1/10 Low FEMA zone X (unshaded) · 0% chance over 30 yrs
- Wildfire 1/10 Low
- Heat 6/10 Major 7 d/yr ≥108°F today · 16 d/yr by 30 yrs out
- Wind 6/10 Major 64% chance of damaging wind over 30 yrs
- Air quality 3/10 Moderate 2 unhealthy d/yr today · 3 by 30 yrs out
Nearby sold comps map
Loading sold comps map…
Walkable amenities ~0.75 mi
Loading nearby amenities…
Taxation est. · year 1
- Rental income
- $16,253
- − Mortgage interest
- −$3,865
- − Property taxes
- −$757
- − Insurance
- −$345
- − Repairs & maintenance
- −$1,300
- − Management
- −$1,300
- − HOA
- −$2,268
- − Depreciation
- −$2,007
- Taxable income
- $4,411
- Est. tax owed @ 24.0%
- −$1,059
- After-tax cash flow
- $4,070/yr
For passive investors: Depreciation is non-cash, so a rental often shows a tax loss while cash-flowing — sheltering income. Rental losses are passive: they offset passive income freely, and up to $25,000/yr can offset ordinary (W-2) income if you actively participate and your MAGI is under $100k (phasing out to $0 by $150k); unused losses carry forward. On sale, claimed depreciation is recaptured at up to 25%, and gains may owe capital-gains tax (a 1031 exchange can defer both). Figures are a year-1 estimate at your 24.0% rate — not tax advice; consult a CPA.
Schools (NCES district)
- District
- Richland 01
- NCES district ID
- 4503360
- Math proficiency
- 26% ▼ -7.00%
- Reading proficiency
- 36% ▼ -5.00%
- Median HH income
- $38,931
- Composite
- 25.94/100
- National rank
- #7335
- State rank
- #54 of 80 in SC
Livability — St. Andrews
No livability data for this city. (Only ~50 U.S. cities are tracked.)
Census & demographics
- Census place
- St. Andrews, SC
- County
- Richland County · 389,530 people
- City population
- 40,504
- Metro
- Columbia, SC
- Population (ZIP)
- 39,962
- Household income
- $50,871
- Rent vs Own
- Severe rent burden
- 2859.0
Population outlook (Richland County) Hauer SSP2
- Today (2025)
- 459,667 people
- By 2030
- 487,524 · +6.1%
- By 2040
- 542,035 · +17.9%
- By 2050
- 595,371 · +29.5%
- By 2075
- 732,998 · +59.5%
- By 2100
- 820,415 · +78.5%
Race, ethnicity, and origin ACS 2023
- Neighborhood character
- Diverse neighborhood (Simpson 0.58)
- Race & ethnicity
- Black 55% White 34% Two or more races 6% Hispanic / Latino 4% Asian 2%
- Common ancestry
- Arab 2% Lithuanian 2% Slovak 1%
- Foreign-born
- 7% · Canada
- Languages at home
- 91% English-only · Spanish 3%
Political lean MEDSL · Richland
- 2024 margin
- Solid D (+34.6) · D 66.4% · R 31.8% · Other 1.8%
- 2008→2024 swing
- +5.7pp toward D · 2008: 28.9pp · 2024: 34.6pp
- All cycles
- 2024: D+34.6 2020: D+38.3 2016: D+32.9 2012: D+33.3 2008: D+28.9
Not yet ingested
- Civics
- —
Market trends
- HPI YoY
- ▼ -107.61%
- Current HPI
- 226.2564
- Rent YoY
- ▲ 5.00%
- Metro
- Columbia, SC
- State GDP YoY
- ▲ 4.51%
- F500 in state
- 2
Industry mix (Fortune 500 HQ in SC)
| Industry | F500 HQs | Revenue |
|---|---|---|
| Packaging | 1 | $7B |
|
||
Price history
-12.1% since first listed12 events — show timeline
- 2026-04-06 Listed $69,000 Consolidated MLS
- 2026-04-01 Delisted — Consolidated MLS
- 2025-06-27 Price Changed $73,500 Consolidated MLS
- 2025-04-21 Relisted — Consolidated MLS
- 2025-04-20 Delisted — Consolidated MLS
- 2025-04-01 Relisted — Consolidated MLS
- 2025-03-29 Delisted — Consolidated MLS
- 2025-02-01 Relisted — Consolidated MLS
- 2025-02-01 Delisted — Consolidated MLS
- 2024-11-11 Relisted — Consolidated MLS
- 2024-11-11 Delisted — Consolidated MLS
- 2024-06-12 Listed $78,500 Consolidated MLS
Property tax history
+9.3%/yrLatest (2025): $757 · +2.4% YoY. Source: county tax records.
Cash-flow waterfall
monthlySold comps — $/sqft
last 12 mo · ≤1 miLoading sold comps…