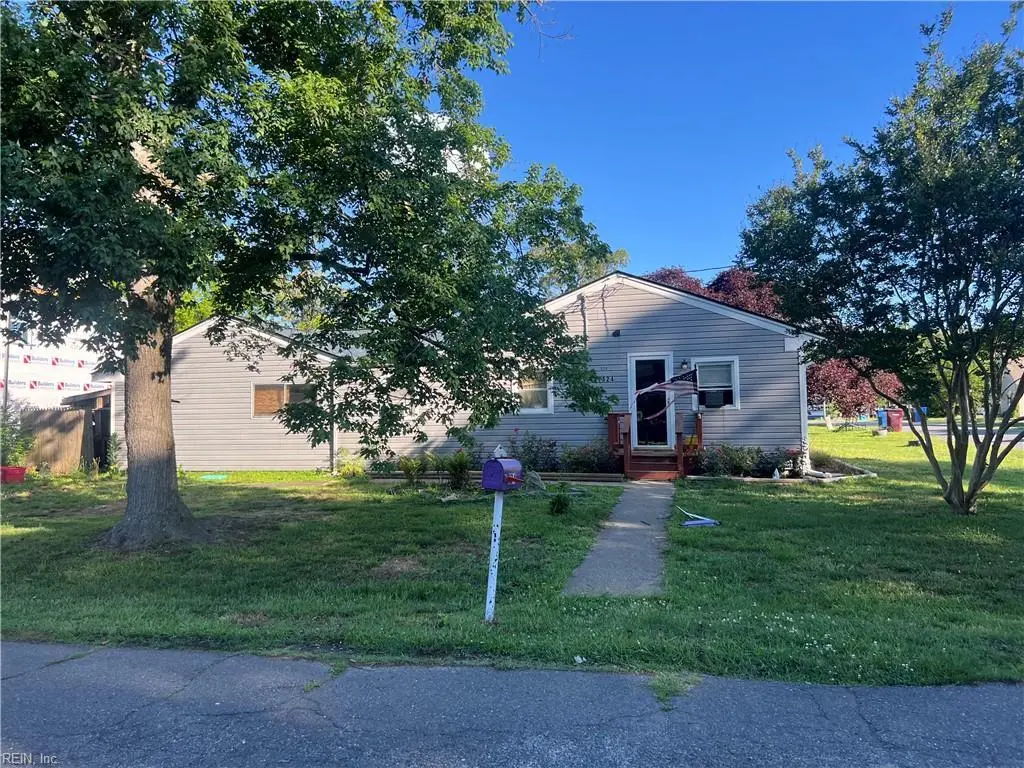
124 Taxus St · Chesapeake, VA
Flood risk 1/10 · Minimal
- FEMA flood zone
- X (unshaded)
- Chance of flooding over 30 yrs
- 0.0%
- Est. flood insurance / yr
- $507 – $1,088
Fire risk 2/10 · Minimal
- Est. fire insurance / yr
- $666 – $1,236
Heat risk 8/10 · Major
- Hot days now (above 107°F)
- 7 days/yr
- Hot days in 30 yrs
- 16 days/yr
Wind risk 8/10 · Major
- Chance of severe wind over 30 yrs
- 80.0%
Air-quality risk 1/10 · Minimal
- Unhealthy air days now
- 0 days/yr
- Unhealthy air days in 30 yrs
- 0 days/yr
Risk factors via First Street. Map © Google.
Why this score? — see what drove the B grade
The composite is a weighted blend of 9 inputs, each scored 0–100. Each bar is that input's sub-score; the figure is the points it added to the 100-point composite (weight × sub-score).
- Cash flow +30.0/30.0
- DSCR +10.0/10.0
- 1% rule +9.2/10.0
- ARV discount +7.5/15.0
- Schools +5.8/10.0
- Rent growth +4.4/5.0
- Livability +3.5/5.0
- Condition / age +2.5/5.0
- Appreciation +0.0/10.0
$150,000
🖨 Deal sheet 📄 Offer letter ✓ Due diligence
Listing remarks
Being sold as-is, where-is.
Key facts
- 2 garage spots
- Built 1947
Property features AI
Finance
- HOA & community: No HOA fees reported
Exterior
- Parking: Attached 2-car garage; Off-street parking; Street parking
- Utilities: City/County water; City/County sewer; Gas water heater
- Home design: Detached ranch; Single-story (1 living level); Simple ownership
- Construction: Vinyl siding; Asphalt shingle roof; Crawl and slab foundation; Built as a ranch (single story)
- Exterior features: Corner lot; Partial fence; Storage shed
Interior
- Kitchen: Dishwasher; Gas range; Refrigerator
- Bedrooms: Master bedroom (first floor); Bedroom (first floor); First-floor bedroom with full bathroom
- Flooring: Carpet; Laminate
- Bathrooms: 1 full bathroom
- Heating & cooling: Natural gas heating; Window/wall air conditioning
- Interior features: Ceiling fan; Pantry
- Laundry & utility: Washer hookup; Dryer hookup; Utility room
Neighborhood map
What this means for you Summary
Snapshot
- This is a 3-bed/1.0-bath single-family listed at $150k.
Deal economics
- At list price, monthly cash flow is $631 ($8k/yr) — positive.
- The deal already cash-flows at list — no discount required.
- Meets the 1% rule at list price ($2k rent vs $150k).
- Cap rate 11.3% vs local median 3.7% in Chesapeake — top-decile yield for the area; either an underpriced asset or a hidden risk that comps aren't pricing in. Stress-test before assuming the spread holds.
Location & tenants
- Location reads 70/100 on livability (#236 in VA) — a middle-class / working-renter tenant base. Strengths: employment A+, housing A+; Watch: crime C-, cost of living C-, amenities F.
- Chesapeake City Public School District (suburban): math 58% / reading 74% proficiency, ranked #31 of 131 in VA (top 24%) — acceptable for families but not a draw, mixed tenant base, ~2y average lease.
- Zoned schools: Deep Creek Elementary (math 66% / reading 72%, grade A-, #351 of 1,108 statewide, top 32%, 763 students, 45% FRL); Oscar F. Smith High (math 63% / reading 75%, grade B, #170 of 319 statewide, top 55%, 2,291 students, 70% FRL) — zoned schools average 57% FRL vs 28% district-wide (30 pts higher); higher-poverty schools than district average — tighter screening recommended.
- Market conditions: Rents rising fast (+7.8%/yr); 282 active listings in the ZIP; 7 comparable units currently listed for rent nearby; rentals leasing fast (median 3d on market — plan ~1-2 weeks tenant-placement turnaround); solid renter incomes; 597 units permitted in Chesapeake city in 2024 (0 in 5+ unit buildings).
- This rent runs 30% of the median local income ($84k/yr) — at the standard rent-burdened threshold; future hikes will face affordability resistance.
Forward outlook
- Local home prices are declining (-3.0%/yr); year-one equity from $1k of loan paydown is wiped out by about $4k of value loss. Plan a longer hold.
- Chesapeake County population projected at +21% by 2050 — long-run rental-demand tailwind backs the buy-and-hold thesis.
- At projected returns (-3.0% appreciation + 7.8% rent growth), your $42k cash investment doubles in ~6 years — after that, you're playing with house money.
Negotiation context
- Only 1 days on market — expect competitive offers; lowballing is unlikely to land.
- 2 sale attempts since 10y ago with the ask held roughly flat each time — persistent listings suggest the price (not the market) is what's stuck; bring a comps-based counter.
Risks & watch-outs
- Watch-outs: built in 1947 — expect roof / HVAC / electrical / plumbing capex.
- Climate carrying-cost: severe wind risk, 80% chance of damaging wind over 30y; extreme-heat days projected 7→16/yr by 2055 (HVAC capex compounding) — expect insurance premiums to compound above CPI over the hold.
Questions for the listing agent
- Built in 1947 — when were the roof, HVAC, electrical panel, plumbing, and water heater last replaced?
- Is there a deadline driving the sale (1031 exchange, divorce, estate, relocation)? That informs how much negotiation room exists.
- Schools are A-rated — typically a magnet for longer-tenancy family renters. What's the average tenant stay here, and is there a school-zone premium baked into asking?
- What's the average days-on-market for RENTAL listings here right now (not sales)? A rising rental-DOM trend means longer vacancies and softer asking-rent achievability than the comps imply.
- What's the recent tenant-quality profile in this submarket — average credit score on applications, eviction rate, late-payment / NSF rate, and stable-employment percentage? A property-management company in the area should have these aggregated.
- How much new for-sale + rental construction is in the pipeline within 1–3 miles? Heavy new supply typically softens prices + rents 12–24 months out; constrained supply supports both.
Investment metrics
- 1% rule
- 1.42% ✓
- Cap rate
- 11.34%
- Cash-on-cash
- 18.02%
- DSCR
- 1.80
- GRM
- 5.9
CMA / ARV
No comps found within radius.
Projected returns pro-forma
-3.0% appreciation · 7.78% rent growth · sell at horizon
- IRR
- 15.0%
- Equity multiple
- 1.64×
- Total profit
- $26,685
- Equity at exit
- $22,365
- IRR
- 27.1%
- Equity multiple
- 3.95×
- Total profit
- $123,943
- Equity at exit
- $12,969
Cash invested: $42,000 (down + closing). Projections, not guarantees.
Landlord ↔ Tenant lean methodology
- Overall (STATE)
- 55 Moderately Landlord-Leaning
- State Virginia
- 55 Moderately Landlord-Leaning · D+2
- County
- — inherits STATE
- City
- — inherits STATE
ZIP-level market 23320
- Rents YoY
- 7.8%
- Active inventory
- 282
- Price-to-rent
- 5.9×
Monthly cashflow live
- Estimated rent
- $2,136 high interval (Pro) →
- Mortgage (P&I)
- −$787
- Tax from tax record
- −$208 /mo · $2,493/yr
- Insurance
- −$62
- HOA
- −$0
- Vacancy / Maint / Mgmt
- −$449
- Net cashflow
- $631
Break-even live
UW: 25.0% down · 7.5% · 30yr · 1.5% tax · 5.0% vac · 8.0% maint · 8.0% mgmt
Financing live
Cash to close
- Down payment
- $37,500
- Closing costs
- $4,500
- Reserves months
- —
- Total cash needed
- —
Loan-product check · same deal, 3 products live
Conventional
25% down · 7.5% · 30yr
- Down + closing
- —
- Monthly P&I
- —
- Monthly cashflow
- —
- DSCR
- —
- Eligible?
- —
Personal DTI + credit; lowest rate.
DSCR
20% down · 8.5% · 30yr
- Down + closing
- —
- Monthly P&I
- —
- Monthly cashflow
- —
- DSCR
- —
- Eligible?
- —
No personal income docs; deal must DSCR.
Hard money
10% down · 12.0% · 12mo
- Down + closing
- —
- Monthly P&I
- —
- Monthly cashflow
- —
- DSCR
- —
- Eligible?
- —
Short-term bridge; refi at stabilization.
Rent comps 7 comps
| Address | Beds | Baths | Sqft | Rent | $/sqft | DOM | Units | Dist |
|---|---|---|---|---|---|---|---|---|
| 124 Fairwind Dr Chesapeake, VA | 1.0–2.0 | 1.0–2.0 | 983 | $2,137 | $2.17 | 2d | 8 | 0.39mi |
| 420 Acorn Grove Ln Chesapeake, VA | 1.0–2.0 | 1.0 | 935 | $1,600 | $1.71 | 1d | 2 | 0.45mi |
| 651 Ridge Cir Chesapeake, VA | 2.0 | 2.5 | 1254 | $1,900 | $1.52 | 23d | 1 | 1.11mi |
| 301 Oak Lake Way Chesapeake, VA | 1.0–2.0 | 1.0–2.0 | 1007 | $2,019 | $2.00 | 3d | 11 | 1.26mi |
| 627 Creekside Ct Chesapeake, VA | 2.0 | 2.5 | 1334 | $1,995 | $1.50 | 2d | 1 | 1.32mi |
| 767 Creekside Cres Unit 1 Chesapeake, VA | 2.0 | 2.5 | 1188 | $2,200 | $1.85 | 23d | 1 | 1.36mi |
| 218 Fireweed Ct Chesapeake, VA | 2.0 | 2.5 | 1144 | $1,850 | $1.62 | 20d | 1 | 1.43mi |
Listing history 4 events
-
2026-05-29$150,000 Active
-
2016-08-02soldstatus $150,000
-
2016-06-15status Under Contract
-
2016-06-03$160,000 Active
ⓘ Source: listings_history table (triggers on properties + properties_extension) + one-shot
backfill from property_details.listing_events for pre-trigger history.
Tax reassessment forecast VA · Resets to sale price
- Current annual tax
- $2,493 · $208/mo
- Projected year-2 tax
- $2,493 · $208/mo
- Expected delta
- $0/yr ($0/mo · 0.0%)
ⓘ Screening estimate from a state-policy table — verify with the county assessor before closing.
Climate risk First Street
- Flood 1/10 Low FEMA zone X (unshaded) · 0% chance over 30 yrs
- Wildfire 2/10 Low
- Heat 8/10 Severe 7 d/yr ≥107°F today · 16 d/yr by 30 yrs out
- Wind 8/10 Severe 80% chance of damaging wind over 30 yrs
- Air quality 1/10 Low 0 unhealthy d/yr today · 0 by 30 yrs out
Nearby sold comps map
Loading sold comps map…
Walkable amenities ~0.75 mi
Loading nearby amenities…
Taxation est. · year 1
- Rental income
- $25,635
- − Mortgage interest
- −$8,402
- − Property taxes
- −$2,493
- − Insurance
- −$750
- − Repairs & maintenance
- −$2,051
- − Management
- −$2,051
- − Depreciation
- −$4,364
- Taxable income
- $5,525
- Est. tax owed @ 24.0%
- −$1,326
- After-tax cash flow
- $6,244/yr
For passive investors: Depreciation is non-cash, so a rental often shows a tax loss while cash-flowing — sheltering income. Rental losses are passive: they offset passive income freely, and up to $25,000/yr can offset ordinary (W-2) income if you actively participate and your MAGI is under $100k (phasing out to $0 by $150k); unused losses carry forward. On sale, claimed depreciation is recaptured at up to 25%, and gains may owe capital-gains tax (a 1031 exchange can defer both). Figures are a year-1 estimate at your 24.0% rate — not tax advice; consult a CPA.
Schools (NCES district)
- District
- Chesapeake City Public School District
- NCES district ID
- 5100810
- Math proficiency
- 58% ▼ -29.00%
- Reading proficiency
- 74% ▼ -7.00%
- Median HH income
- $69,356
- Composite
- 57.84/100
- National rank
- #1047
- State rank
- #31 of 131 in VA
Livability — Chesapeake
- Score
- 70/100
- State rank
- #236
- US rank
- #7942
Category grades
Schools grade is shown separately in the Schools card above.
Census & demographics
- Census place
- Chesapeake, VA
- County
- Chesapeake City · 253,091 people
- City population
- 253,091
- Metro
- Virginia Beach-Norfolk-Newport News, VA-NC
- Population (ZIP)
- 59,108
- Household income
- $84,305
- Rent vs Own
- Severe rent burden
- 2714.0
Population outlook (Chesapeake County) Hauer SSP2
- Today (2025)
- 263,804 people
- By 2030
- 276,798 · +4.9%
- By 2040
- 299,906 · +13.7%
- By 2050
- 318,284 · +20.7%
- By 2075
- 362,137 · +37.3%
- By 2100
- 372,225 · +41.1%
Race, ethnicity, and origin ACS 2023
- Neighborhood character
- Diverse neighborhood (Simpson 0.66)
- Race & ethnicity
- White 49% Black 29% Hispanic / Latino 10% Two or more races 8% Asian 5%
- Hispanic origin (detail)
- Mexican 3% Puerto Rican 1%
- Common ancestry
- Lithuanian 2% Romanian 2% Italian 2%
- Foreign-born
- 9% · Canada
- Languages at home
- 89% English-only · Spanish 6% Tagalog/Filipino 2% French/Haitian/Cajun 1%
Political lean MEDSL · Chesapeake
- 2024 margin
- Toss-up / Even · D 51.3% · R 47.5% · Other 1.2%
- 2008→2024 swing
- +2.5pp toward D · 2008: 1.3pp · 2024: 3.8pp
- All cycles
- 2024: D+3.8 2020: D+6.5 2016: R+1.3 2012: D+1.1 2008: D+1.3
Not yet ingested
- Civics
- —
Market trends
- HPI YoY
- ▼ -241.43%
- Current HPI
- 285.5792
- Rent YoY
- ▲ 7.78%
- Metro
- Virginia Beach-Norfolk-Newport News, VA-NC
- State GDP YoY
- ▲ 2.40%
- F500 in state
- 50
Industry mix (Fortune 500 HQ in VA)
| Industry | F500 HQs | Revenue |
|---|---|---|
| Aerospace / Defense | 4 | $236B |
|
||
| Technology / Defense | 3 | $32B |
|
||
| Financial Services | 2 | $176B |
|
||
| Utilities | 2 | $27B |
|
||
| Insurance | 2 | $25B |
|
||
| Technology | 2 | $15B |
|
||
Price history
-6.2% since first listed4 events — show timeline
- 2026-05-29 Listed $150,000 REINMLS
- 2016-08-02 Sold (Public Records) $150,000 Public Records
- 2016-06-15 Pending — REINMLS
- 2016-06-03 Listed $160,000 REINMLS
Property tax history
+2.8%/yrLatest (2025): $2,493 · +14.5% YoY. Source: county tax records.
Cash-flow waterfall
monthlySold comps — $/sqft
last 12 mo · ≤1 miLoading sold comps…