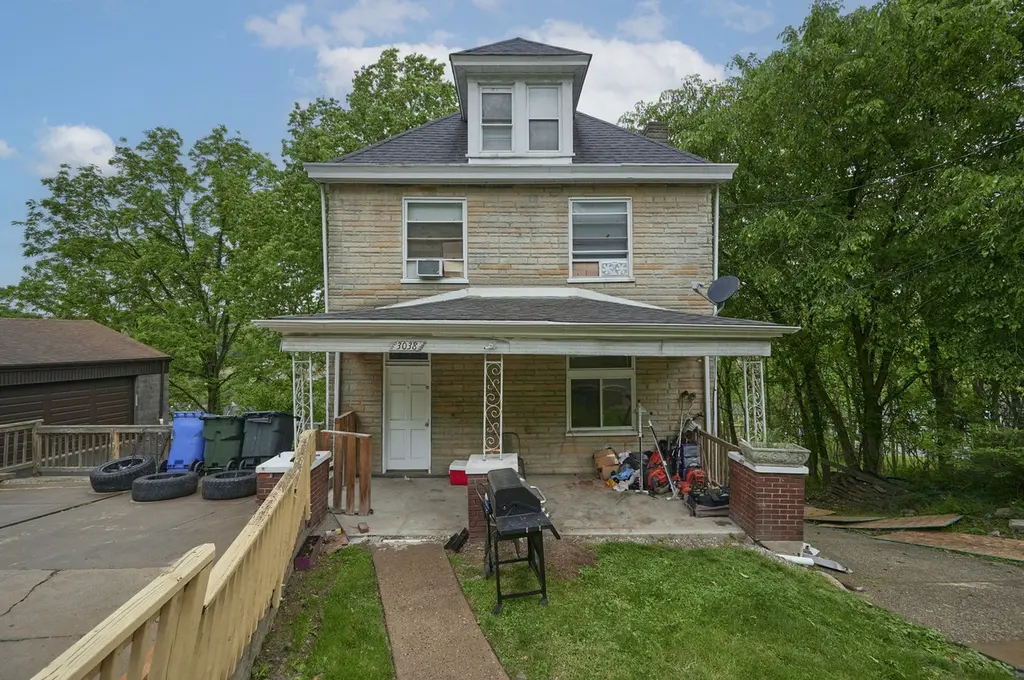
3038 Provost Rd · Whitehall, PA
Flood risk 1/10 · Minimal
- FEMA flood zone
- X (unshaded)
- Chance of flooding over 30 yrs
- 0.0%
- Est. flood insurance / yr
- $473 – $860
Fire risk 1/10 · Minimal
- Est. fire insurance / yr
- $511 – $949
Heat risk 3/10 · Minor
- Hot days now (above 96°F)
- 7 days/yr
- Hot days in 30 yrs
- 17 days/yr
Wind risk 2/10 · Minimal
- Chance of severe wind over 30 yrs
- —
Air-quality risk 3/10 · Minor
- Unhealthy air days now
- 3 days/yr
- Unhealthy air days in 30 yrs
- 5 days/yr
Risk factors via First Street. Map © Google.
Why this score? — see what drove the B- grade
The composite is a weighted blend of 9 inputs, each scored 0–100. Each bar is that input's sub-score; the figure is the points it added to the 100-point composite (weight × sub-score).
- Cash flow +28.7/30.0
- DSCR +10.0/10.0
- ARV discount +7.5/15.0
- 1% rule +6.8/10.0
- Livability +4.5/5.0
- Schools +4.0/10.0
- Rent growth +3.6/5.0
- Condition / age +2.5/5.0
- Appreciation +0.0/10.0
$135,000
🖨 Deal sheet 📄 Offer letter ✓ Due diligence
Listing remarks MLS
This property is being sold as-is. Cash Only buyers. Buyer is responsible for all transfer stamps and dye test if required. Property has new 150 Amp Electrical Service. This is an exceptional housing value. Buyers will have to provide proof of funds. To schedule a tour please call Listing Agent
Key facts
- Off street parking
- Bonus rooms
- 0.3 acre lot
Tags
Property features AI
Finance
- Financial info: Assessed value listed as $15,000; Annual taxes listed as $553
Exterior
- Parking: Off-street parking
- Home design: Two-story residence; Resale property
- Exterior features: Lot dimensions approximately 59 x 130 feet
Interior
- Bathrooms: Two full bathrooms
- Interior features: Basement present
Neighborhood map
What this means for you Summary
Snapshot
- This is a 3-bed/1.0-bath single-family listed at $135k.
Deal economics
- At list price, monthly cash flow is $450 ($5k/yr) — positive.
- The deal already cash-flows at list — no discount required.
- Meets the 1% rule at list price ($2k rent vs $135k).
- Recommended offer: $133k (1.5% below list) — sets the bar for market timing.
- Cap rate 10.3% vs local median 3.0% in Whitehall — top-decile yield for the area; either an underpriced asset or a hidden risk that comps aren't pricing in. Stress-test before assuming the spread holds.
Location & tenants
- Location reads 90/100 on livability (#17 in PA, #82 nationally) — a professional / high-income tenant draw. Strengths: crime A+, commute A+, cost of living A+.
- Baldwin-Whitehall SD (suburban): math 34% / reading 58% proficiency, ranked #246 of 539 in PA (top 46%) — families likely to look elsewhere, expect single-tenant / working-renter base with shorter leases.
- Market conditions: Rents rising fast (+4.3%/yr); 117 active listings in the ZIP; 12 comparable units currently listed for rent nearby; rentals at typical pace (median 20d on market — plan ~3-4 weeks tenant-placement turnaround); solid renter incomes; 2,996 units permitted in Allegheny County in 2024 (1,588 in 5+ unit buildings).
Forward outlook
- Local home prices are declining (-3.0%/yr); year-one equity from $933 of loan paydown is wiped out by about $4k of value loss. Plan a longer hold.
- At projected returns (-3.0% appreciation + 4.3% rent growth), your $38k cash investment doubles in ~8 years — after that, you're playing with house money.
Negotiation context
- It's been on market 16 days — a 2% lower offer ($133k) is reasonable based on typical stale-listing flexibility.
- 3 sale attempts since 25y ago; this cycle's ask has dropped $15k (10%) from the opening price — seller is motivated, your offer sets the floor, not the list.
- Current owner paid $66k; list at $135k implies a 105% gain — meaningful room to come down on a strong offer.
Risks & watch-outs
- Watch-outs: built in 1940 — expect roof / HVAC / electrical / plumbing capex.
Questions for the listing agent
- Built in 1940 — when were the roof, HVAC, electrical panel, plumbing, and water heater last replaced?
- Is there a deadline driving the sale (1031 exchange, divorce, estate, relocation)? That informs how much negotiation room exists.
- Schools are B-rated — typically a magnet for longer-tenancy family renters. What's the average tenant stay here, and is there a school-zone premium baked into asking?
- What's the average days-on-market for RENTAL listings here right now (not sales)? A rising rental-DOM trend means longer vacancies and softer asking-rent achievability than the comps imply.
- What's the recent tenant-quality profile in this submarket — average credit score on applications, eviction rate, late-payment / NSF rate, and stable-employment percentage? A property-management company in the area should have these aggregated.
- How much new for-sale + rental construction is in the pipeline within 1–3 miles? Heavy new supply typically softens prices + rents 12–24 months out; constrained supply supports both.
Investment metrics
- 1% rule
- 1.18% ✓
- Cap rate
- 10.29%
- Cash-on-cash
- 14.28%
- DSCR
- 1.64
- GRM
- 7.1
CMA / ARV
- ARV (on-the-fly)
- $287,976
- Comps found
- 12
Show comp detail 12 sales within ~0.75 mi
| Address | Dist | Beds/Ba | Sqft | Sold | Price | $/sf | Match |
|---|---|---|---|---|---|---|---|
| 92 Skyvue Dr | 0.26mi | 4/2.5 (+1) | 1,700 (-0%) | 4mo | $305,000 | $179 | 73 |
| 3121 May St | 0.49mi | 3/1.0 | 1,660 (-3%) | 3mo | $220,000 | $133 | 70 |
| 4345 E Barlind Dr | 0.52mi | 3/3.0 | 1,706 (+0%) | 11mo | $325,000 | $191 | 58 |
| 100 Skyvue Dr | 0.28mi | 3/2.0 | 1,468 (-14%) | 8mo | $133,000 | $91 | 53 |
| 4372 Frank St | 0.44mi | 3/2.0 | 1,538 (-10%) | 9mo | $260,000 | $169 | 52 |
| 4266 Seton St | 0.51mi | 3/2.0 | 1,587 (-7%) | 11mo | $255,000 | $161 | 52 |
| 3017 Home Ave | 0.56mi | 3/1.0 | 1,500 (-12%) | 9mo | $181,000 | $121 | 47 |
| 317 Greenlee Rd | 0.74mi | 4/1.5 (+1) | 1,754 (+3%) | 10mo | $210,000 | $120 | 45 |
| 4517 W Brightview Ave | 0.48mi | 4/2.0 (+1) | 1,896 (+11%) | 7mo | $330,000 | $174 | 44 |
| 4431 E Lawnview Ave | 0.65mi | 4/2.0 (+1) | 1,852 (+9%) | 3mo | $330,000 | $178 | 44 |
| 3099 Mcroberts Rd | 0.38mi | 2/2.0 (-1) | 1,462 (-14%) | 10mo | $193,000 | $132 | 42 |
| 1300 Martha St | 0.60mi | 4/3.0 (+1) | 1,909 (+12%) | 7mo | $376,000 | $197 | 33 |
Match score weights: distance 35% · size 25% · config 20% · recency 20%. Top-matched comps best support the ARV.
Projected returns pro-forma
-3.0% appreciation · 4.33% rent growth · sell at horizon
- IRR
- 6.0%
- Equity multiple
- 1.24×
- Total profit
- $8,884
- Equity at exit
- $20,129
- IRR
- 16.4%
- Equity multiple
- 2.42×
- Total profit
- $53,536
- Equity at exit
- $11,672
Cash invested: $37,800 (down + closing). Projections, not guarantees.
Landlord ↔ Tenant lean methodology
- Overall (STATE)
- 62 Landlord-Friendly
- State Pennsylvania
- 62 Landlord-Friendly · EVEN
- County
- — inherits STATE
- City
- — inherits STATE
ZIP-level market 15227
- Home prices YoY
- -27.5%
- Rents YoY
- 4.3%
- Active inventory
- 117
- Price-to-rent
- 7.1×
Monthly cashflow live
- Estimated rent
- $1,595 high interval (Pro) →
- Mortgage (P&I)
- −$708
- Tax from tax record
- −$46 /mo · $553/yr
- Insurance
- −$56
- HOA
- −$0
- Vacancy / Maint / Mgmt
- −$335
- Net cashflow
- $450
Break-even live
UW: 25.0% down · 7.5% · 30yr · 1.5% tax · 5.0% vac · 8.0% maint · 8.0% mgmt
Financing live
Cash to close
- Down payment
- $33,750
- Closing costs
- $4,050
- Reserves months
- —
- Total cash needed
- —
Loan-product check · same deal, 3 products live
Conventional
25% down · 7.5% · 30yr
- Down + closing
- —
- Monthly P&I
- —
- Monthly cashflow
- —
- DSCR
- —
- Eligible?
- —
Personal DTI + credit; lowest rate.
DSCR
20% down · 8.5% · 30yr
- Down + closing
- —
- Monthly P&I
- —
- Monthly cashflow
- —
- DSCR
- —
- Eligible?
- —
No personal income docs; deal must DSCR.
Hard money
10% down · 12.0% · 12mo
- Down + closing
- —
- Monthly P&I
- —
- Monthly cashflow
- —
- DSCR
- —
- Eligible?
- —
Short-term bridge; refi at stabilization.
Rent comps 12 comps
| Address | Beds | Baths | Sqft | Rent | $/sqft | DOM | Units | Dist |
|---|---|---|---|---|---|---|---|---|
| 100 White Hampton Ln Pittsburgh, PA | 1.0–2.0 | 1.0–2.0 | 867 | $1,720 | $1.98 | 1d | 19 | 0.49mi |
| 103 Paddock Ln Pittsburgh, PA | 3.0 | 2.0 | 2100 | $2,299 | $1.09 | 2d | 1 | 0.55mi |
| 453 Greenlee Rd Pittsburgh, PA | 3.0 | 1.0 | 1176 | $1,495 | $1.27 | 43d | 1 | 0.57mi |
| 1310 Martha St Pittsburgh, PA | 3.0 | 1.0 | 1061 | $1,050 | $0.99 | 12d | 1 | 0.58mi |
| 2355 Glenbury St Pittsburgh, PA | 4.0 | 2.0 | 1350 | $2,300 | $1.70 | 4d | 1 | 1.04mi |
| 3224 Bookman Ave Unit 1 Pittsburgh, PA | 2.0 | 2.0 | 1207 | $1,550 | $1.28 | 43d | 1 | 1.09mi |
| 4588 E Willock Rd Pittsburgh, PA | 3.0 | 1.5 | 1500 | $1,500 | $1.00 | 4d | 1 | 1.27mi |
| 2811 Brownsville Rd Unit 4 Brentwood, PA | 2.0 | 1.0 | 1250 | $995 | $0.80 | 43d | 1 | 1.28mi |
| 2823 Clermont Ave Pittsburgh, PA | 3.0 | 1.0 | 1354 | $1,490 | $1.10 | 20d | 1 | 1.32mi |
| 416 Jacobson Dr Brentwood, PA | 2.0 | 1.0 | 1150 | $1,050 | $0.91 | 23d | 1 | 1.37mi |
| 2721 Pyramid Ave Pittsburgh, PA | 3.0 | 1.0 | 1560 | $1,550 | $0.99 | 7d | 1 | 1.38mi |
| 2769 Churchview Ave Unit 9 Pittsburgh, PA | 2.0 | 1.0 | 1200 | $1,095 | $0.91 | 43d | 1 | 1.48mi |
Listing history 11 events
-
2026-06-18days on market $135,000 Active 16 DOM
-
2026-06-17days on market $135,000 Active 15 DOM
-
2026-06-16pricedays on market $135,000 Active 14 DOM
-
2026-06-15days on market $150,000 Active 13 DOM
-
2026-06-13days on market $150,000 Active 11 DOM
-
2026-06-13days on market $150,000 Active 10 DOM
-
2026-06-09days on market $150,000 Active 7 DOM
-
2026-06-08days on market $150,000 Active 6 DOM
-
2026-06-07days on market $150,000 Active 5 DOM
-
2026-06-03remarks 316-char remark
-
2026-06-03$150,000 Active 1 DOM
ⓘ Source: listings_history table (triggers on properties + properties_extension) + one-shot
backfill from property_details.listing_events for pre-trigger history.
Tax reassessment forecast PA · Partial reset (capped growth)
- Current annual tax
- $553 · $46/mo
- Projected year-2 tax
- $1,343 · $112/mo
- Expected delta
- +$790/yr (+$66/mo · 142.9%)
ⓘ Screening estimate from a state-policy table — verify with the county assessor before closing.
Climate risk First Street
- Flood 1/10 Low FEMA zone X (unshaded) · 0% chance over 30 yrs
- Wildfire 1/10 Low
- Heat 3/10 Moderate 7 d/yr ≥96°F today · 17 d/yr by 30 yrs out
- Wind 2/10 Low
- Air quality 3/10 Moderate 3 unhealthy d/yr today · 5 by 30 yrs out
Nearby sold comps map
Loading sold comps map…
Walkable amenities ~0.75 mi
Loading nearby amenities…
Taxation est. · year 1
- Rental income
- $19,140
- − Mortgage interest
- −$7,562
- − Property taxes
- −$553
- − Insurance
- −$675
- − Repairs & maintenance
- −$1,531
- − Management
- −$1,531
- − Depreciation
- −$3,927
- Taxable income
- $3,361
- Est. tax owed @ 24.0%
- −$807
- After-tax cash flow
- $4,591/yr
For passive investors: Depreciation is non-cash, so a rental often shows a tax loss while cash-flowing — sheltering income. Rental losses are passive: they offset passive income freely, and up to $25,000/yr can offset ordinary (W-2) income if you actively participate and your MAGI is under $100k (phasing out to $0 by $150k); unused losses carry forward. On sale, claimed depreciation is recaptured at up to 25%, and gains may owe capital-gains tax (a 1031 exchange can defer both). Figures are a year-1 estimate at your 24.0% rate — not tax advice; consult a CPA.
Schools (NCES district)
- District
- Baldwin-Whitehall SD
- NCES district ID
- 4202970
- Math proficiency
- 34% ▼ -20.00%
- Reading proficiency
- 58% ▼ -14.00%
- Median HH income
- $54,368
- Composite
- 39.79/100
- National rank
- #3880
- State rank
- #246 of 539 in PA
Livability — Whitehall
- Score
- 90/100
- State rank
- #17
- US rank
- #82
Category grades
Schools grade is shown separately in the Schools card above.
Census & demographics
- Census place
- Whitehall, PA
- County
- Allegheny County · 1,022,028 people
- City population
- 29,451
- Metro
- Pittsburgh, PA
- Population (ZIP)
- 28,460
- Household income
- $75,448
- Rent vs Own
- Severe rent burden
- 780.0
Population outlook (Allegheny County) Hauer SSP2
- Today (2025)
- 1,250,282 people
- By 2030
- 1,256,482 · +0.5%
- By 2040
- 1,256,318 · +0.5%
- By 2050
- 1,244,169 · -0.5%
- By 2075
- 1,197,693 · -4.2%
- By 2100
- 1,093,187 · -12.6%
Race, ethnicity, and origin ACS 2023
- Neighborhood character
- Predominantly White (80%)
- Race & ethnicity
- White 80% Black 7% Asian 6% Two or more races 5% Hispanic / Latino 1%
- Common ancestry
- Romanian 9% Scotch-Irish 2% Slovak 1%
- Foreign-born
- 9% · India, Canada, China
- Languages at home
- 89% English-only · Other Indo-European 6% Other Asian/Pacific 1% French/Haitian/Cajun 1%
Political lean MEDSL · Allegheny
- 2024 margin
- Strong D (+20.3) · D 59.7% · R 39.4%
- 2008→2024 swing
- +4.8pp toward D · 2008: 15.5pp · 2024: 20.3pp
- All cycles
- 2024: D+20.3 2020: D+20.4 2016: D+16.4 2012: D+14.4 2008: D+15.5
Not yet ingested
- Civics
- —
Market trends
- HPI YoY
- ▼ -92.53%
- Current HPI
- 243.6383
- Rent YoY
- ▲ 4.33%
- Metro
- Pittsburgh, PA
- State GDP YoY
- ▲ 1.68%
- F500 in state
- 34
Industry mix (Fortune 500 HQ in PA)
| Industry | F500 HQs | Revenue |
|---|---|---|
| Healthcare | 2 | $309B |
|
||
| Insurance | 2 | $27B |
|
||
| Telecommunications / Media | 1 | $124B |
|
||
| Industrial Distribution | 1 | $22B |
|
||
| Financial Services | 1 | $20B |
|
||
| Chemicals / Materials | 1 | $18B |
|
||
Price history
+114.6% since first listed5 events — show timeline
- 2026-06-02 Listed $150,000 West Penn MLS
- 2011-03-16 Listed $29,900 West Penn MLS
- 2001-08-31 Sold (Public Records) $65,900 Public Records
- 2001-08-29 Sold (MLS) $65,900 West Penn MLS
- 2001-05-08 Listed $69,900 West Penn MLS
Property tax history
+3.0%/yrLatest (2026): $553 · +0.0% YoY. Source: county tax records.
Cash-flow waterfall
monthlySold comps — $/sqft
last 12 mo · ≤1 miLoading sold comps…