 Fourplex
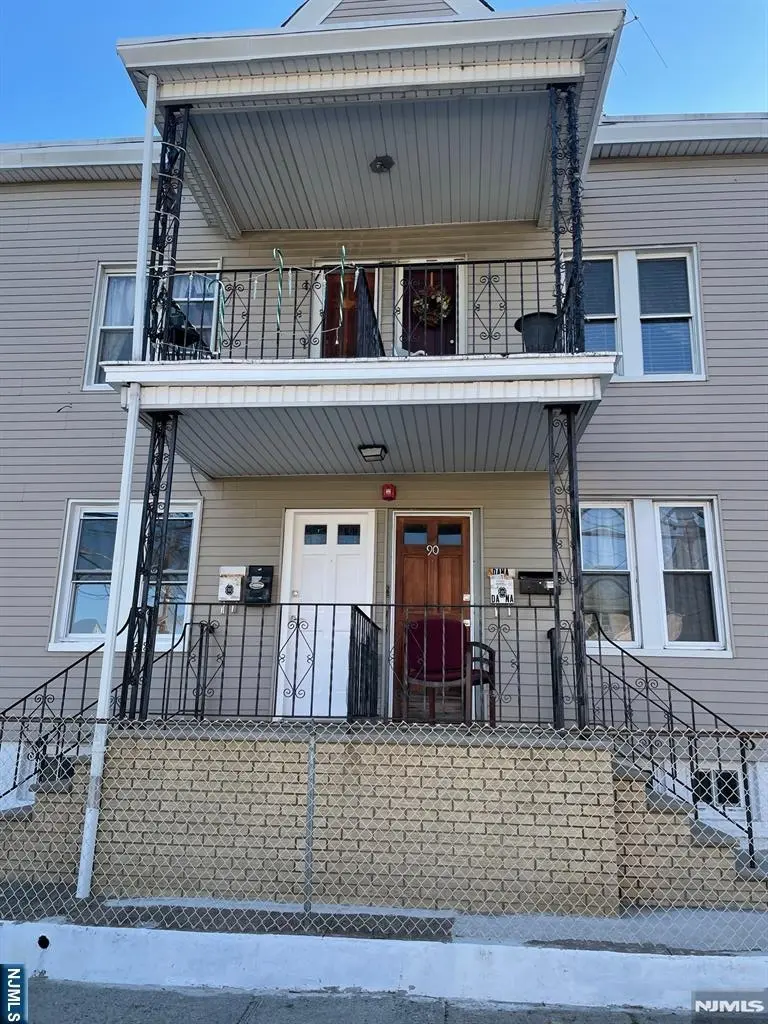
90-92 3rd Ave · Paterson, NJ
Flood risk 1/10 · Minimal
- FEMA flood zone
- X (unshaded)
- Chance of flooding over 30 yrs
- 0.0%
- Est. flood insurance / yr
- $507 – $1,088
Fire risk 1/10 · Minimal
- Est. fire insurance / yr
- $526 – $976
Heat risk 7/10 · Major
- Hot days now (above 100°F)
- 7 days/yr
- Hot days in 30 yrs
- 15 days/yr
Wind risk 5/10 · Moderate
- Chance of severe wind over 30 yrs
- 26.0%
Air-quality risk 4/10 · Minor
- Unhealthy air days now
- 3 days/yr
- Unhealthy air days in 30 yrs
- 5 days/yr
Risk factors via First Street. Map © Google.
Why this score? — see what drove the C- grade
The composite is a weighted blend of 9 inputs, each scored 0–100. Each bar is that input's sub-score; the figure is the points it added to the 100-point composite (weight × sub-score).
- Cash flow +18.2/30.0
- ARV discount +7.5/15.0
- Appreciation +6.9/10.0
- DSCR +5.7/10.0
- 1% rule +4.9/10.0
- Condition / age +3.8/5.0
- Livability +3.5/5.0
- Rent growth +2.5/5.0
- Schools +1.3/10.0
$899,000
🖨 Deal sheet 📄 Offer letter ✓ Due diligence
Multi-family units
County records classify this as Multi-Family (2-4 Unit). Listing-text estimate: 4 units. confirmed
Listing remarks
Exceptional investment opportunity! This well-maintained 4-family property offers strong income potential in a highly desirable section of Paterson, just 3 blocks from Fair Lawn. Each of the four units features 2 bedrooms and 1 full bath, making it ideal for steady rental demand. The property also includes an unfinished basement with excellent potential—perfect for future finishing or possible owner-occupancy (subject to approvals). A 2-car garage provides additional income, as it is currently rented, and the oversized lot offers ample space and flexibility. One unit has been recently updated, adding immediate value for the next owner. Conveniently located just 2 blocks f
Key facts
- Recently updated
- Unfinished basement
- 2 car garage
Tags
Property features AI
Finance
- Financial info: Annual taxes listed
Exterior
- Parking: Two-car garage
- Utilities: Natural gas available and connected; Electricity connected
- Home design: Residential income property; Multi-family
Interior
- Bathrooms: Four full bathrooms
- Interior features: Total of 20 rooms
- Laundry & utility: No in-unit laundry
Neighborhood map
What this means for you Summary
Snapshot
- This is a 4 × 2-bed/1.0-bath units multifamily listed at $899k. Condition is rated good.
Deal economics
- At list price, monthly cash flow is $805 ($10k/yr) — positive. Per door: $201/mo.
- The deal already cash-flows at list — no discount required.
- To meet the 1% rule (rent ≥ 1% of price), the offer needs to be $888k (1.2% below list).
- Recommended offer: $845k (6.0% below list) — sets the bar for market timing.
- Cap rate 7.4% vs local median 3.4% in Paterson — top-decile yield for the area; either an underpriced asset or a hidden risk that comps aren't pricing in. Stress-test before assuming the spread holds.
Location & tenants
- Location reads 69/100 on livability (#293 in NJ) — a middle-class / working-renter tenant base. Strengths: amenities A+, commute A+, health & safety A; Watch: schools D, employment D, crime F.
- Paterson Public School District (suburban): math 6% / reading 26% proficiency, ranked #458 of 472 in NJ (top 97%) — low school quality limits family demand, transient renter base, plan for 1-2y turnover; 83% free/reduced lunch — lower-income household profile, screen leases tightly.
- Market conditions: 13 active listings in the ZIP; 860 units permitted in Passaic County in 2024 (614 in 5+ unit buildings).
Forward outlook
- In year one you build about $40k of equity ($6k loan paydown + $34k appreciation (3.8% local appreciation)).
- Passaic County population projected at +5% by 2050 — modest demand growth; plan on rents tracking national, not racing it.
- At projected returns (3.8% appreciation + 3.0% rent growth), your $252k cash investment doubles in ~5 years — after that, you're playing with house money.
- By year 2, paydown + projected appreciation supports a ~$65k cash-out refi (75% LTV) — recoverable capital for the next deal without selling this one.
Negotiation context
- It's been on market 71 days — a 6% lower offer ($845k) is reasonable based on typical stale-listing flexibility.
- 2 sale attempts with the ask held roughly flat each time — persistent listings suggest the price (not the market) is what's stuck; bring a comps-based counter.
Risks & watch-outs
- Climate carrying-cost: moderate wind risk, 26% chance of damaging wind over 30y; extreme-heat days projected 7→15/yr by 2055 (HVAC capex compounding) — expect insurance premiums to compound above CPI over the hold.
Questions for the listing agent
- It's been on market 71 days. Have you received any prior offers? Is the seller open to a 6% concession, seller financing, or rate buy-down credit?
- Can we see the unit-by-unit rent roll, current vacancy, and any below-market leases? What's the average tenancy length?
- What capital expenditures (roof, boiler, parking lot, exteriors) have been made in the last 5 years, and what's planned in the next 2?
- Why hasn't it sold? Are there any deal-killer items the seller is aware of (foundation, flood, title, zoning, code violations)?
- Is there a deadline driving the sale (1031 exchange, divorce, estate, relocation)? That informs how much negotiation room exists.
- Schools are D-rated, which usually means shorter tenancies and higher turnover. Who's the typical renter profile here, and what's been the actual vacancy rate?
- Crime grade is F in this area — have there been break-ins, vandalism, or insurance claims at this property in the last 3 years? What carrier currently insures it and at what premium?
- What's the average days-on-market for RENTAL listings here right now (not sales)? A rising rental-DOM trend means longer vacancies and softer asking-rent achievability than the comps imply.
- What's the recent tenant-quality profile in this submarket — average credit score on applications, eviction rate, late-payment / NSF rate, and stable-employment percentage? A property-management company in the area should have these aggregated.
- How much new apartment / multifamily construction is in the pipeline within 1–3 miles? Heavy new supply (>2% of stock underway) typically softens rents 12–24 months out; light construction supports rent growth.
Investment metrics
- 1% rule
- 0.99% ✗
- Cap rate
- 7.37%
- Cash-on-cash
- 3.84%
- DSCR
- 1.17
- GRM
- 8.4
CMA / ARV
No comps found within radius.
Show comp detail 8 sales within ~0.75 mi
| Address | Dist | Beds/Ba | Sqft | Sold | Price | $/sf | Match |
|---|---|---|---|---|---|---|---|
| 22 2nd St | 0.17mi | 8/4.0 | — | 11mo | $750,000 | — | 71 |
| 129-131 E 22nd St | 0.08mi | 8/4.0 | — | 17mo | $700,000 | — | 69 |
| 17 E 15th St | 0.32mi | 9/5.5 (+1) | — | 9mo | $750,000 | — | 54 |
| 263-267 E 25th St | 0.48mi | 7/3.0 (-1) | — | 3mo | $825,000 | — | 54 |
| 266-268 E 17th St | 0.60mi | 8/5.0 | — | 9mo | $850,000 | — | 48 |
| 140 Lincoln Ave | 0.68mi | 8/4.0 | — | 15mo | $749,000 | — | 44 |
| 262-264 E 17th St | 0.59mi | 8/5.0 | — | 19mo | $830,000 | — | 40 |
| 25 York St | 0.73mi | 7/3.0 (-1) | — | 6mo | $670,000 | — | 39 |
Match score weights: distance 35% · size 25% · config 20% · recency 20%. Top-matched comps best support the ARV.
Projected returns pro-forma
3.8% appreciation · 3.0% rent growth · sell at horizon
- IRR
- 13.2%
- Equity multiple
- 1.79×
- Total profit
- $198,472
- Equity at exit
- $445,488
- IRR
- 14.6%
- Equity multiple
- 3.34×
- Total profit
- $588,666
- Equity at exit
- $720,518
Cash invested: $251,720 (down + closing). Projections, not guarantees.
Landlord ↔ Tenant lean methodology
- Overall (STATE)
- 21 Tenant-Leaning
- State New Jersey
- 21 Tenant-Leaning · D+6
- County
- — inherits STATE
- City
- — inherits STATE
ZIP-level market 07514
- Home prices YoY
- 1.1%
- Active inventory
- 13
- Price-to-rent
- 33.7×
Monthly cashflow live
- Estimated rent
- $8,883 high interval (Pro) →
- Mortgage (P&I)
- −$4,714
- Tax est. 1.5%
- −$1,124 /mo · $13,485/yr
- Insurance
- −$375
- HOA
- −$0
- Vacancy / Maint / Mgmt
- −$1,865
- Net cashflow
- $805
Break-even live
4-unit breakdown (identical units grouped — click to expand)
| Units | Beds | Baths | Est. rent |
|---|---|---|---|
| 4× units | 2 | 1 | $8,884 |
| #1 | 2 | 1 | $2,221 |
| #2 | 2 | 1 | $2,221 |
| #3 | 2 | 1 | $2,221 |
| #4 | 2 | 1 | $2,221 |
| Total (4 units) | $8,883 | ||
UW: 25.0% down · 7.5% · 30yr · 1.5% tax · 5.0% vac · 8.0% maint · 8.0% mgmt
Financing live
Cash to close
- Down payment
- $224,750
- Closing costs
- $26,970
- Reserves months
- —
- Total cash needed
- —
Loan-product check · same deal, 3 products live
Conventional
25% down · 7.5% · 30yr
- Down + closing
- —
- Monthly P&I
- —
- Monthly cashflow
- —
- DSCR
- —
- Eligible?
- —
Personal DTI + credit; lowest rate.
DSCR
20% down · 8.5% · 30yr
- Down + closing
- —
- Monthly P&I
- —
- Monthly cashflow
- —
- DSCR
- —
- Eligible?
- —
No personal income docs; deal must DSCR.
Hard money
10% down · 12.0% · 12mo
- Down + closing
- —
- Monthly P&I
- —
- Monthly cashflow
- —
- DSCR
- —
- Eligible?
- —
Short-term bridge; refi at stabilization.
Listing history 17 events
-
2026-06-18days on market $899,000 Active 71 DOM
-
2026-06-17days on market $899,000 Active 70 DOM
-
2026-06-16days on market $899,000 Active 69 DOM
-
2026-06-15days on market $899,000 Active 68 DOM
-
2026-06-13days on market $899,000 Active 66 DOM
-
2026-06-13days on market $899,000 Active 65 DOM
-
2026-06-09days on market $899,000 Active 62 DOM
-
2026-06-08days on market $899,000 Active 61 DOM
-
2026-06-07days on market $899,000 Active 60 DOM
-
2026-06-04days on market $899,000 Active 57 DOM
-
2026-06-03days on market $899,000 Active 56 DOM
-
2026-06-02days on market $899,000 Active 55 DOM
-
2026-06-01days on market $899,000 Active 54 DOM
-
2026-05-31days on market $899,000 Active 53 DOM
-
2026-05-20status Active
-
2026-04-23historical Active Under Contract - Attorney Review
-
2026-04-08$899,000 Active
ⓘ Source: listings_history table (triggers on properties + properties_extension) + one-shot
backfill from property_details.listing_events for pre-trigger history.
Climate risk First Street
- Flood 1/10 Low FEMA zone X (unshaded) · 0% chance over 30 yrs
- Wildfire 1/10 Low
- Heat 7/10 Severe 7 d/yr ≥100°F today · 15 d/yr by 30 yrs out
- Wind 5/10 Major 26% chance of damaging wind over 30 yrs
- Air quality 4/10 Moderate 3 unhealthy d/yr today · 5 by 30 yrs out
Nearby sold comps map
Loading sold comps map…
Walkable amenities ~0.75 mi
Loading nearby amenities…
Taxation est. · year 1
- Rental income
- $106,596
- − Mortgage interest
- −$50,358
- − Property taxes
- −$13,485
- − Insurance
- −$4,495
- − Repairs & maintenance
- −$8,528
- − Management
- −$8,528
- − Depreciation
- −$26,153
- Taxable loss
- −$4,950
- Est. tax savings @ 24.0%
- +$1,188
- After-tax cash flow
- $10,845/yr
For passive investors: Depreciation is non-cash, so a rental often shows a tax loss while cash-flowing — sheltering income. Rental losses are passive: they offset passive income freely, and up to $25,000/yr can offset ordinary (W-2) income if you actively participate and your MAGI is under $100k (phasing out to $0 by $150k); unused losses carry forward. On sale, claimed depreciation is recaptured at up to 25%, and gains may owe capital-gains tax (a 1031 exchange can defer both). Figures are a year-1 estimate at your 24.0% rate — not tax advice; consult a CPA.
Condition & rehab AI · 11 photos
This 4-family property is in good condition with no major repairs needed. It has recently been updated and is ready for immediate rental or resale.
Value-add opportunities
- Both Painting the exterior and interior walls — Fresh paint can enhance the curb appeal and interior aesthetics, making the property more attractive to potential buyers and renters.
- Both Updating the flooring — Fresh flooring can improve the overall look and feel of the property, making it more appealing to potential buyers and renters.
Renovation cost estimate screening
Value-add ROI direction
- Both Painting the exterior and interior walls — Fresh paint can enhance the curb appeal and interior aesthetics, making the property more attractive to potential buyers and renters. ↑
- Both Updating the flooring — Fresh flooring can improve the overall look and feel of the property, making it more appealing to potential buyers and renters. ↑
ⓘ Cost ranges are severity-bucket heuristics (US national rule-of-thumb). Get contractor quotes + a written scope before underwriting a rehab budget.
Schools (NCES district)
- District
- Paterson Public School District
- NCES district ID
- 3412690
- Math proficiency
- 6% ▼ -12.00%
- Reading proficiency
- 26% ▼ -4.00%
- Median HH income
- $34,365
- Composite
- 13.02/100
- National rank
- #9568
- State rank
- #458 of 472 in NJ
Livability — Paterson
- Score
- 69/100
- State rank
- #293
- US rank
- #8763
Category grades
Schools grade is shown separately in the Schools card above.
Census & demographics
- Census place
- Paterson, NJ
- City population
- 85,452
- Population (ZIP)
- 18,912
Population outlook (Passaic County) Hauer SSP2
- Today (2025)
- 525,915 people
- By 2030
- 532,160 · +1.2%
- By 2040
- 543,670 · +3.4%
- By 2050
- 554,326 · +5.4%
- By 2075
- 584,728 · +11.2%
- By 2100
- 598,978 · +13.9%
Race, ethnicity, and origin ACS 2023
- Neighborhood character
- Majority Hispanic (62%)
- Race & ethnicity
- Hispanic / Latino 62% Black 32% Two or more races 8% White 4% Asian 1%
- Hispanic origin (detail)
- Mexican 4% Puerto Rican 4% Dominican 40%
- Foreign-born
- 51% · Canada, Jamaica, Guatemala
- Languages at home
- 39% English-only · Spanish 55% Korean 1% Other Indo-European 1%
Political lean MEDSL · Passaic
- 2024 margin
- Toss-up / Even · D 46.9% · R 49.8% · Other 3.3%
- 2008→2024 swing
- -24.6pp toward R · 2008: 21.7pp · 2024: -2.9pp
- All cycles
- 2024: R+2.9 2020: D+16.5 2016: D+21.8 2012: D+27.3 2008: D+21.7
Not yet ingested
- Civics
- —
Market trends
- HPI YoY
- ▲ 3.80%
- Current HPI
- 340.3835
- Rent YoY
- —
- Metro
- —
- State GDP YoY
- ▲ 2.05%
- F500 in state
- 34
Industry mix (Fortune 500 HQ in NJ)
| Industry | F500 HQs | Revenue |
|---|---|---|
| Consumer Goods | 3 | $31B |
|
||
| Pharmaceuticals | 2 | $153B |
|
||
| Technology | 2 | $21B |
|
||
| Insurance | 2 | $20B |
|
||
| Healthcare | 2 | $19B |
|
||
| Financial Services | 1 | $70B |
|
||
Price history
3 events — show timeline
- 2026-05-20 Relisted — NJMLS
- 2026-04-23 Contingent — NJMLS
- 2026-04-08 Listed $899,000 NJMLS
Cash-flow waterfall
monthlySold comps — $/sqft
last 12 mo · ≤1 miLoading sold comps…