 🏗️ New Construction
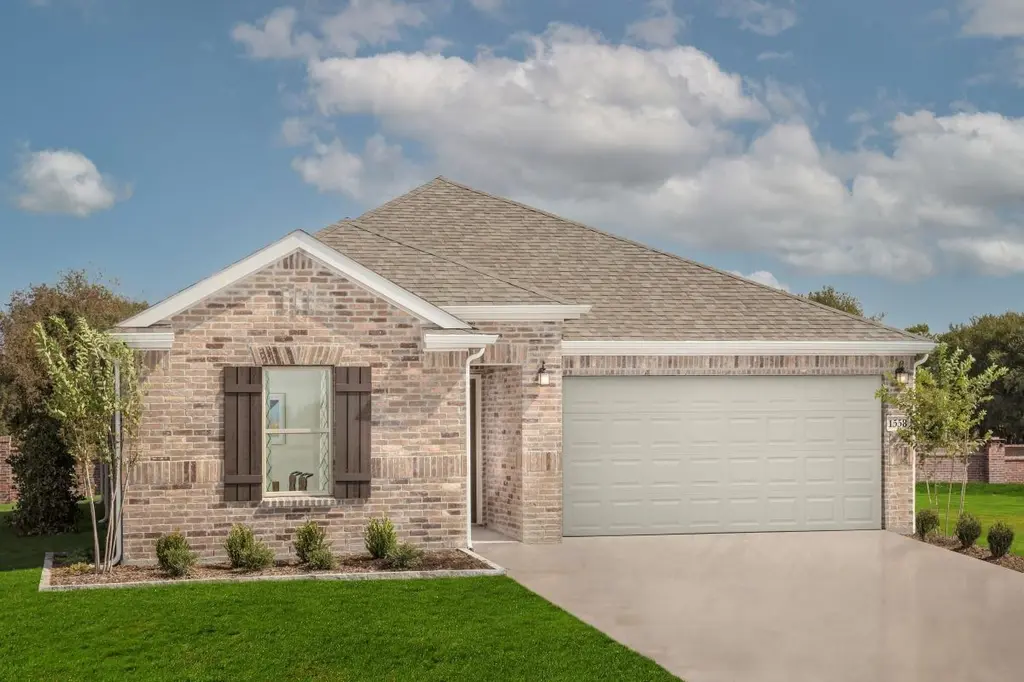
Plan 1491 Modeled Plan · Princeton, TX
Flood risk No data
- FEMA flood zone
- —
- Chance of flooding over 30 yrs
- —
- Est. flood insurance / yr
- —
Fire risk No data
- Est. fire insurance / yr
- —
Heat risk No data
- Hot days now (above threshold)
- —
- Hot days in 30 yrs
- —
Wind risk No data
- Chance of severe wind over 30 yrs
- —
Air-quality risk No data
- Unhealthy air days now
- —
- Unhealthy air days in 30 yrs
- —
Risk factors via First Street. Map © Google.
Why this score? — see what drove the F grade
The composite is a weighted blend of 9 inputs, each scored 0–100. Each bar is that input's sub-score; the figure is the points it added to the 100-point composite (weight × sub-score).
- ARV discount +7.5/15.0
- Cash flow +5.3/30.0
- Schools +4.2/10.0
- Livability +3.1/5.0
- Condition / age +2.5/5.0
- Rent growth +2.2/5.0
- 1% rule +1.0/10.0
- DSCR +0.0/10.0
- Appreciation +0.0/10.0
$254,995
🖨 Deal sheet (PDF) 📄 Offer letter ✓ Due diligence
Listing remarks
* Walk-in closet at primary bedroom * Dual-sink vanity at primary bathroom * Low-e windows * Stainless steel kitchen appliances * Smart thermostat * Tankless water heater * Spacious great room * Kitchen island * Granite kitchen countertops * Kitchen tile backsplash * Dedicated laundry room * ENERGY STAR® certified home * Playground * Near local schools * Close to popular restaurants * Commuter-friendly location * Near entertainment and leisure * Picnic areas
Key facts
- Walk-in closet
- Low-e windows
- Dual-sink vanity
Tags
Property features AI
Finance
- Other: Active listing; Virtual tour available
- Financial info: List price $259,995
Exterior
- Parking: 2-car garage (2 total parking spaces)
- Home design: Single-family plan (Plan 1491 Modeled); Located in Princeton, TX
- Construction: New construction (modeled plan)
- Exterior features: Modeled new construction home (Plan 1491); Living area approximately 1491
Interior
- Kitchen: Includes standard kitchen appliances
- Bedrooms: 3 bedrooms
- Bathrooms: 2 full bathrooms
- Interior features: Open living area
- Laundry & utility: Laundry area (details not provided)
Neighborhood map
What this means for you Summary
Snapshot
- This is a 3-bed/2.0-bath single-family listed at $255k.
Deal economics
- At list price, monthly cash flow is $-729 ($-9k/yr) — negative.
- To cash-flow at today's rent, offer at most $226k (11.4% below list).
- To meet the 1% rule (rent ≥ 1% of price), the offer needs to be $198k (22.5% below list).
- Recommended offer: $198k (22.5% below list) — sets the bar for 1% rule.
Location & tenants
- Location reads 62/100 on livability (#969 in TX) — a middle-class / working-renter tenant base. Strengths: employment A+, housing A+, cost of living A; Watch: schools C-, amenities F, commute F.
- Princeton ISD (suburban): math 51% / reading 47% proficiency, ranked #188 of 826 in TX (top 23%) — families likely to look elsewhere, expect single-tenant / working-renter base with shorter leases.
- Market conditions: Rents soft (-1.0%/yr); 1409 active listings in the ZIP; 40 comparable units currently listed for rent nearby; rentals at typical pace (median 23d on market — plan ~3-4 weeks tenant-placement turnaround); solid renter incomes; 19,194 units permitted in Collin County in 2024 (3,988 in 5+ unit buildings).
Forward outlook
- Local home prices are declining (-3.0%/yr); year-one equity from $2k of loan paydown is wiped out by about $10k of value loss. Plan a longer hold.
- Collin County population projected at +60% by 2050 — long-run rental-demand tailwind backs the buy-and-hold thesis.
Negotiation context
- It's been on market 15 days — a 2% lower offer ($251k) is reasonable based on typical stale-listing flexibility.
Questions for the listing agent
- What do current leases actually rent for vs. the listed asking? Can we see a recent rent roll and the last 12 months of T-12 income?
- Is there a deadline driving the sale (1031 exchange, divorce, estate, relocation)? That informs how much negotiation room exists.
- The area grade is low — what's the realistic commute time and amenity access for the typical tenant pool here? Any planned neighborhood developments (good or bad) we should know about?
- What's the average days-on-market for RENTAL listings here right now (not sales)? A rising rental-DOM trend means longer vacancies and softer asking-rent achievability than the comps imply.
- What's the recent tenant-quality profile in this submarket — average credit score on applications, eviction rate, late-payment / NSF rate, and stable-employment percentage? A property-management company in the area should have these aggregated.
- How much new for-sale + rental construction is in the pipeline within 1–3 miles? Heavy new supply typically softens prices + rents 12–24 months out; constrained supply supports both.
Investment metrics
- 1% rule
- 0.60% ✗
- Cap rate
- 3.65%
- Cash-on-cash
- -9.43%
- DSCR
- 0.58
- GRM
- 14.0
CMA / ARV
- ARV (median comp)
- $331,374
- List price
- $254,995
- Delta
- -21.54%
- Verdict
- UNDERPRICED
- Comps
- 20 within 1.0 mi
Show comp detail 12 sales within ~0.75 mi
| Address | Dist | Beds/Ba | Sqft | Sold | Price | $/sf | Match |
|---|---|---|---|---|---|---|---|
| 1426 Kingsbridge Dr | 0.08mi | 3/2.0 | 1,491 (0%) | 19mo | $340,602 | $228 | 81 |
| 777 Saxony Dr | 0.39mi | 3/2.0 | 1,491 (0%) | 3mo | $279,955 | $188 | 79 |
| 418 Boroughbridge Dr | 0.15mi | 3/2.0 | 1,567 (+5%) | 17mo | $335,249 | $214 | 70 |
| 622 Windsor Dr | 0.27mi | 3/2.0 | 1,567 (+5%) | 17mo | $343,293 | $219 | 65 |
| 412 Princewood Dr | 0.08mi | 3/2.0 | 1,675 (+12%) | 18mo | $325,995 | $195 | 61 |
| 649 Saxony Dr | 0.30mi | 4/2.0 (+1) | 1,675 (+12%) | 10mo | $299,990 | $179 | 52 |
| 663 Saxony Dr | 0.31mi | 4/2.0 (+1) | 1,675 (+12%) | 10mo | $302,772 | $181 | 52 |
| 677 Jupe Way | 0.32mi | 4/2.0 (+1) | 1,675 (+12%) | 9mo | $317,630 | $190 | 52 |
| 721 Saxony Dr | 0.35mi | 4/2.0 (+1) | 1,675 (+12%) | 8mo | $316,000 | $189 | 52 |
| 523 Oxford Loop | 0.53mi | 4/2.0 (+1) | 1,608 (+8%) | 19mo | $234,900 | $146 | 41 |
| 417 Harvard Dr | 0.68mi | 3/2.0 | 1,332 (-11%) | 16mo | $239,500 | $180 | 37 |
| 808 Sicily Blvd | 0.62mi | 4/2.5 (+1) | 1,674 (+12%) | 13mo | $391,949 | $234 | 33 |
Match score weights: distance 35% · size 25% · config 20% · recency 20%. Top-matched comps best support the ARV.
Projected returns pro-forma
-3.0% appreciation · 0.0% rent growth · sell at horizon
- IRR
- -36.4%
- Equity multiple
- -0.14×
- Total profit
- $-105,904
- Equity at exit
- $49,409
- IRR
- -73.8%
- Equity multiple
- -0.88×
- Total profit
- $-174,281
- Equity at exit
- $28,651
Cash invested: $92,785 (down + closing). Projections, not guarantees.
Landlord ↔ Tenant lean methodology
- Overall (STATE)
- 87 Strongly Landlord-Friendly
- State Texas
- 87 Strongly Landlord-Friendly · R+5
- County
- — inherits STATE
- City
- — inherits STATE
ZIP-level market 75407
- Home prices YoY
- -30.3%
- Rents YoY
- -1.0%
- Active inventory
- 1409
- Price-to-rent
- 10.8×
Monthly cashflow live
- Estimated rent
- $1,976 high interval (Pro) →
- Mortgage (P&I)
- −$1,738
- Tax est. 1.5%
- −$414 /mo · $4,971/yr
- Insurance
- −$138
- HOA
- −$0
- Vacancy / Maint / Mgmt
- −$415
- Net cashflow
- $-729
Break-even live
Sensitivity live
| Price | -10% $-500 | -5% $-615 | +0% $-729 | +5% $-844 | +10% $-958 |
|---|---|---|---|---|---|
| Rent | -10% $-885 | -5% $-807 | +0% $-729 | +5% $-651 | +10% $-573 |
| Rate | -1.0pp $-562 | -0.5pp $-645 | base $-729 | +0.5pp $-815 | +1.0pp $-902 |
UW: 25.0% down · 7.5% · 30yr · 1.5% tax · 5.0% vac · 8.0% maint · 8.0% mgmt
Financing live
Cash to close
- Down payment
- $82,843
- Closing costs
- $9,941
- Reserves months
- —
- Total cash needed
- —
Loan-product check · same deal, 3 products live
Conventional
25% down · 7.5% · 30yr
- Down + closing
- —
- Monthly P&I
- —
- Monthly cashflow
- —
- DSCR
- —
- Eligible?
- —
Personal DTI + credit; lowest rate.
DSCR
20% down · 8.5% · 30yr
- Down + closing
- —
- Monthly P&I
- —
- Monthly cashflow
- —
- DSCR
- —
- Eligible?
- —
No personal income docs; deal must DSCR.
Hard money
10% down · 12.0% · 12mo
- Down + closing
- —
- Monthly P&I
- —
- Monthly cashflow
- —
- DSCR
- —
- Eligible?
- —
Short-term bridge; refi at stabilization.
Rent comps 40 comps
| Address | Beds | Baths | Sqft | Rent | $/sqft | DOM | Units | Dist |
|---|---|---|---|---|---|---|---|---|
| 353 Princewood Dr Princeton, TX | 4.0 | 2.0 | 1753 | $1,950 | $1.11 | 45d | 1 | 0.00mi |
| 461 Princewood Dr Princeton, TX | 3.0 | 2.0 | 1749 | $1,750 | $1.00 | 25d | 1 | 0.09mi |
| 622 Saxony Dr Princeton, TX | 3.0 | 2.0 | 1567 | $2,000 | $1.28 | 45d | 1 | 0.24mi |
| 649 Saxony Dr Princeton, TX | 4.0 | 2.0 | 1674 | $2,100 | $1.25 | 14d | 1 | 0.26mi |
| 649 Saxony Dr Princeton, TX | 4.0 | 2.0 | 1674 | $2,100 | $1.25 | 0d | 1 | 0.26mi |
| 200 Cole St Princeton, TX | 1.0–3.0 | 1.0–2.0 | 960 | $1,799 | $1.87 | 45d | 23 | 0.35mi |
| 200 Cole St Princeton, TX | 1.0–2.0 | 1.0–2.0 | 838 | $1,263 | $1.51 | 0d | 8 | 0.35mi |
| 149 Princeton Xrds Princeton, TX | 1.0–3.0 | 1.0–2.0 | 980 | $1,889 | $1.93 | 0d | 22 | 0.35mi |
| 250 N Boorman Ln Princeton, TX | 1.0–3.0 | 1.0–2.0 | 936 | $4,619 | $4.93 | 0d | 1 | 0.40mi |
| 899 E Hazelwood St Princeton, TX | 1.0–3.0 | 1.0–2.0 | 989 | $1,780 | $1.80 | 0d | 13 | 0.43mi |
| 1823 Dahlia Way Princeton, TX | 4.0 | 2.0 | 1803 | $1,950 | $1.08 | 8d | 1 | 0.48mi |
| 1707 Cotton Blossom Ln Princeton, TX | 4.0 | 2.0 | 1811 | $2,095 | $1.16 | 6d | 1 | 0.48mi |
| 263 Honeysuckle Ln Princeton, TX | 4.0 | 2.0 | 1800 | $1,850 | $1.03 | 45d | 1 | 0.51mi |
| 219 Golden Sands Ln Princeton, TX | 4.0 | 2.0 | 1800 | $1,795 | $1.00 | 18d | 1 | 0.52mi |
| 305 Turquoise Ln Princeton, TX | 4.0 | 2.0 | 1811 | $1,850 | $1.02 | 14d | 1 | 0.52mi |
| 313 Sweet Pea Ln Princeton, TX | 4.0 | 2.0 | 1802 | $1,900 | $1.05 | 4d | 1 | 0.54mi |
| 1911 Lilac Dr Princeton, TX | 4.0 | 2.0 | 1811 | $1,900 | $1.05 | 0d | 1 | 0.56mi |
| 1917 Lilac Dr Princeton, TX | 4.0 | 2.0 | 1850 | $2,045 | $1.11 | 45d | 1 | 0.57mi |
| 306 Golden Sands Ln Princeton, TX | 4.0 | 2.5 | 1811 | $1,995 | $1.10 | 45d | 1 | 0.58mi |
| 291 Wandering Stream Way Princeton, TX | 4.0 | 2.0 | 1803 | $1,875 | $1.04 | 45d | 1 | 0.58mi |
| 514 E Hazelwood St Unit B Princeton, TX | 3.0 | 2.0 | 1380 | $1,475 | $1.07 | 8d | 1 | 0.60mi |
| 514 E Hazelwood St Princeton, TX | 3.0 | 2.0 | 1380 | $1,475 | $1.07 | 0d | 1 | 0.60mi |
| 514 E Hazelwood St Princeton, TX | 3.0 | 2.0 | 1380 | $1,475 | $1.07 | 25d | 1 | 0.60mi |
| 514 E Hazelwood St Unit B Princeton, TX | 3.0 | 2.0 | 1380 | $1,495 | $1.08 | 45d | 1 | 0.60mi |
| 264 Moonstone Way Princeton, TX | 4.0 | 2.0 | 1803 | $1,795 | $1.00 | 16d | 1 | 0.60mi |
| 512 E Hazelwood St Unit A Princeton, TX | 3.0 | 2.0 | 1295 | $1,349 | $1.04 | 45d | 1 | 0.60mi |
| 1712 Sandalwood Way Princeton, TX | 4.0 | 2.0 | 1803 | $1,795 | $1.00 | 25d | 1 | 0.61mi |
| 502 E Hazelwood St Princeton, TX | 3.0 | 2.0 | 1295 | $1,550 | $1.20 | 45d | 1 | 0.62mi |
| 304 Wandering Stream Way Princeton, TX | 4.0 | 2.0 | 1803 | $1,875 | $1.04 | 45d | 1 | 0.63mi |
| 280 Moonstone Way Princeton, TX | 4.0 | 2.0 | 1800 | $1,900 | $1.06 | 6d | 1 | 0.67mi |
| 281 Moonstone Way Princeton, TX | 4.0 | 2.0 | 1803 | $1,895 | $1.05 | 14d | 1 | 0.69mi |
| 414 E Hazelwood St Princeton, TX | 3.0 | 2.0 | 1328 | $1,595 | $1.20 | 25d | 1 | 0.73mi |
| 846 Breakwater Dr Princeton, TX | 3.0 | 2.5 | 1824 | $2,000 | $1.10 | 0d | 1 | 0.73mi |
| 846 Breakwater Dr Princeton, TX | 3.0 | 2.5 | 1824 | $2,000 | $1.10 | 4d | 1 | 0.73mi |
| 882 Breakwater Dr Princeton, TX | 4.0 | 2.5 | 1824 | $2,250 | $1.23 | 23d | 1 | 0.76mi |
| 605 Grenada Lake Dr Princeton, TX | 3.0 | 2.0 | 1563 | $1,925 | $1.23 | 16d | 1 | 0.76mi |
| 803 Table Rock St Princeton, TX | 4.0 | 2.5 | 1683 | $1,850 | $1.10 | 45d | 1 | 0.77mi |
| 325 Allenwood Dr Princeton, TX | 3.0 | 1.5 | 1008 | $1,900 | $1.88 | 45d | 1 | 0.80mi |
| 865 Table Rock St Princeton, TX | 3.0 | 2.0 | 1563 | $2,050 | $1.31 | 23d | 1 | 0.82mi |
| 366 Lake Erie Dr Princeton, TX | 4.0 | 2.5 | 1824 | $1,990 | $1.09 | 25d | 1 | 0.85mi |
Listing history 36 events
-
2026-06-21pricedays on market $254,995 Active 15 DOM
-
2026-06-18days on market $259,995 Active 12 DOM
-
2026-06-17days on market $259,995 Active 11 DOM
-
2026-06-16days on market $259,995 Active 10 DOM
-
2026-06-15days on market $259,995 Active 9 DOM
-
2026-06-13days on market $259,995 Active 7 DOM
-
2026-06-13days on market $259,995 Active 6 DOM
-
2026-06-09days on market $259,995 Active 3 DOM
-
2026-06-08days on market $259,995 Active 2 DOM
-
2026-06-07remarks 497-char remark
-
2026-06-07days on market $259,995 Active 1 DOM
-
2026-06-04days on market $259,995 Active 874 DOM
-
2026-06-03days on market $259,995 Active 873 DOM
-
2026-06-02days on market $259,995 Active 872 DOM
-
2026-06-01days on market $259,995 Active 871 DOM
-
2026-05-31days on market $259,995 Active 870 DOM
-
2026-05-18price $259,995 501-char remark
-
2026-01-31price $260,995 501-char remark
-
2025-12-17price $280,995 501-char remark
-
2025-11-19price $285,995 501-char remark
-
2025-10-04price $290,995 501-char remark
-
2025-09-17price $280,995 501-char remark
-
2025-08-14price $270,995 501-char remark
-
2025-07-22price $267,995 501-char remark
-
2025-07-16price $264,995 501-char remark
-
2025-03-31price $263,995 501-char remark
-
2025-02-22price $273,995 501-char remark
-
2024-11-04price $298,995 501-char remark
-
2024-09-11price $297,995 501-char remark
-
2024-07-13price $307,995 501-char remark
-
2024-05-03price $317,995 501-char remark
-
2024-03-13price $316,995 501-char remark
-
2024-02-25price $314,995 501-char remark
-
2024-02-03price $312,995 501-char remark
-
2024-01-25price $309,995 501-char remark
-
2024-01-13$307,995 Active 501-char remark
ⓘ Source: listings_history table (triggers on properties + properties_extension) + one-shot
backfill from property_details.listing_events for pre-trigger history.
Nearby sold comps map
Loading sold comps map…
Walkable amenities ~0.75 mi
Loading nearby amenities…
Taxation est. · year 1
- Rental income
- $23,708
- − Mortgage interest
- −$18,562
- − Property taxes
- −$4,971
- − Insurance
- −$1,657
- − Repairs & maintenance
- −$1,897
- − Management
- −$1,897
- − Depreciation
- −$9,640
- Taxable loss
- −$14,915
- Est. tax savings @ 24.0%
- +$3,579
- After-tax cash flow
- $-5,172/yr
For passive investors: Depreciation is non-cash, so a rental often shows a tax loss while cash-flowing — sheltering income. Rental losses are passive: they offset passive income freely, and up to $25,000/yr can offset ordinary (W-2) income if you actively participate and your MAGI is under $100k (phasing out to $0 by $150k); unused losses carry forward. On sale, claimed depreciation is recaptured at up to 25%, and gains may owe capital-gains tax (a 1031 exchange can defer both). Figures are a year-1 estimate at your 24.0% rate — not tax advice; consult a CPA.
Schools (NCES district)
- District
- Princeton ISD
- NCES district ID
- 4835850
- Math proficiency
- 51% ▼ -8.00%
- Reading proficiency
- 47% ▬ 0.00%
- Median HH income
- $54,827
- Composite
- 42.44/100
- National rank
- #3226
- State rank
- #188 of 826 in TX
Livability — Princeton
- Score
- 62/100
- State rank
- #969
- US rank
- #17215
Category grades
Schools grade is shown separately in the Schools card above.
Census & demographics
- Census place
- Princeton, TX
- County
- Collin County · 1,159,394 people
- City population
- 34,171
- Metro
- Dallas-Fort Worth-Arlington, TX
- Population (ZIP)
- 34,171
- Household income
- $100,037
- Rent vs Own
- Severe rent burden
- 368.0
Population outlook (Collin County) Hauer SSP2
- Today (2025)
- 1,210,074 people
- By 2030
- 1,358,201 · +12.2%
- By 2040
- 1,654,061 · +36.7%
- By 2050
- 1,937,359 · +60.1%
- By 2075
- 2,567,039 · +112.1%
- By 2100
- 2,952,048 · +144.0%
Race, ethnicity, and origin ACS 2023
- Neighborhood character
- Diverse neighborhood (Simpson 0.66)
- Race & ethnicity
- White 47% Hispanic / Latino 30% Black 17% Two or more races 10% Asian 4% Native American 1%
- Hispanic origin (detail)
- Mexican 26%
- Common ancestry
- Lithuanian 2% Romanian 1% Russian 1%
- Foreign-born
- 15% · Canada, China, Mexico
- Languages at home
- 70% English-only · Spanish 22% Other Indo-European 2% Other Asian/Pacific 1%
Political lean MEDSL · Collin
- 2024 margin
- R (+11.1) · D 43.1% · R 54.3% · Other 2.6%
- 2008→2024 swing
- +14.4pp toward D · 2008: -25.6pp · 2024: -11.1pp
- All cycles
- 2024: R+11.1 2020: R+4.3 2016: R+17.0 2012: R+31.6 2008: R+25.6
Not yet ingested
- Civics
- —
Market trends
- HPI YoY
- ▼ -103.99%
- Current HPI
- 238.9373
- Rent YoY
- ▼ -1.02%
- Metro
- Dallas-Fort Worth-Arlington, TX
- State GDP YoY
- ▲ 3.95%
- F500 in state
- 110
Industry mix (Fortune 500 HQ in TX)
| Industry | F500 HQs | Revenue |
|---|---|---|
| Energy | 16 | $1,198B |
|
||
| Technology | 5 | $198B |
|
||
| Engineering / Construction | 4 | $72B |
|
||
| Energy Services | 3 | $60B |
|
||
| Utilities | 3 | $41B |
|
||
| Healthcare | 2 | $330B |
|
||
Cash-flow waterfall
monthlySold comps — $/sqft
last 12 mo · ≤1 miLoading sold comps…