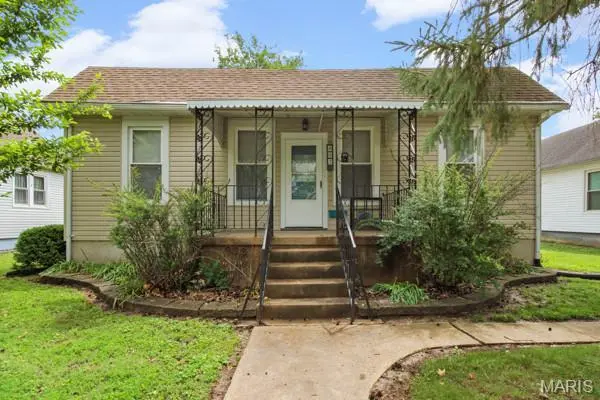
402 N Taylor Ave · Crystal City, MO
Flood risk 1/10 · Minimal
- FEMA flood zone
- X (unshaded)
- Chance of flooding over 30 yrs
- 0.0%
- Est. flood insurance / yr
- $507 – $1,088
Fire risk 3/10 · Minor
- Est. fire insurance / yr
- $1,054 – $1,958
Heat risk 5/10 · Moderate
- Hot days now (above 107°F)
- 7 days/yr
- Hot days in 30 yrs
- 20 days/yr
Wind risk 2/10 · Minimal
- Chance of severe wind over 30 yrs
- 1.0%
Air-quality risk 1/10 · Minimal
- Unhealthy air days now
- 0 days/yr
- Unhealthy air days in 30 yrs
- 0 days/yr
Risk factors via First Street. Map © Google.
Why this score? — see what drove the D- grade
The composite is a weighted blend of 9 inputs, each scored 0–100. Each bar is that input's sub-score; the figure is the points it added to the 100-point composite (weight × sub-score).
- Cash flow +12.3/30.0
- ARV discount +7.5/15.0
- DSCR +3.7/10.0
- Schools +3.7/10.0
- Livability +3.6/5.0
- Rent growth +2.5/5.0
- Condition / age +2.5/5.0
- 1% rule +2.4/10.0
- Appreciation +0.0/10.0
$210,000
🖨 Deal sheet (PDF) 📄 Offer letter ✓ Due diligence
Listing remarks MLS
Contract first day on market fell thru no fault with house or seller! Very cute and extremely well maintained 3 bedroom home in great community. Move right in! Exterior is maintenance free with a large, level, fenced yard and a 1 car detached garage with GDO. Living room has original mill work and laminate wood floors. There are 3 bedroom. Although one is small it would make a great office or nursery! Main floor laundry too! Kitchen walks out to a small enclosed porch that leads to back yard. A really great house at a really great price!!!
Key facts
- 8,886 sq ft lot
- Garage
- Built 1956
Property features AI
Finance
- Other: Lot size approximately 0.204 acre; Above-grade living area reported as 1,059 (source: assessor)
- Financial info: Lease not considered; Seller may consider concessions
Exterior
- Parking: One-car garage
- Utilities: Public water; Public sewer; Electricity (Ameren); Electricity connected; Water connected; Sewer connected
- Home design: Single-family residence; One story
- Construction: Block construction; Vinyl siding; Blown-in insulation; Architectural shingle roof
- Exterior features: Back yard fencing; Private lot; Shed(s)
Interior
- Bedrooms: Three bedrooms on the main level
- Bathrooms: One full bathroom (main level)
- Heating & cooling: Natural gas heating; Central air conditioning
- Interior features: Central air; Natural gas heating; Block basement
Neighborhood map
What this means for you Summary
Snapshot
- This is a 3-bed/1.0-bath other listed at $210k.
Deal economics
- At list price, monthly cash flow is $-38 ($-460/yr) — negative.
- To cash-flow at today's rent, offer at most $203k (3.2% below list).
- To meet the 1% rule (rent ≥ 1% of price), the offer needs to be $156k (25.7% below list).
- Recommended offer: $156k (25.7% below list) — sets the bar for 1% rule.
- Cap rate 6.1% vs local median 3.6% in Crystal City — top-decile yield for the area; either an underpriced asset or a hidden risk that comps aren't pricing in. Stress-test before assuming the spread holds.
Location & tenants
- Location reads 71/100 on livability (#119 in MO) — a middle-class / working-renter tenant base. Strengths: cost of living A+, housing A+; Watch: amenities F, commute F.
- Crystal City 47 (suburban): math 31% / reading 54% proficiency, ranked #113 of 324 in MO (top 35%) — families likely to look elsewhere, expect single-tenant / working-renter base with shorter leases.
- Zoned schools: Crystal City Elem. (math 32% / reading 52%, grade F, #481 of 1,115 statewide, top 46%, 318 students, 50% FRL); Crystal City High (math 27% / reading 57%, grade F, #218 of 521 statewide, top 45%, 224 students, 42% FRL).
- Market conditions: 17 active listings in the ZIP; 3 comparable units currently listed for rent nearby; rentals at typical pace (median 24d on market — plan ~3-4 weeks tenant-placement turnaround); 807 units permitted in Jefferson County in 2024 (104 in 5+ unit buildings).
Forward outlook
- Local home prices are declining (-3.0%/yr); year-one equity from $1k of loan paydown is wiped out by about $6k of value loss. Plan a longer hold.
Negotiation context
- It's been on market 32 days — a 3% lower offer ($204k) is reasonable based on typical stale-listing flexibility.
- 2 sale attempts since 13y ago; this cycle's ask has dropped $15k (7%) from the opening price — seller is motivated, your offer sets the floor, not the list.
Risks & watch-outs
- Watch-outs: built in 1956 — expect roof / HVAC / electrical / plumbing capex.
- Climate carrying-cost: extreme-heat days projected 7→20/yr by 2055 (HVAC capex compounding) — expect insurance premiums to compound above CPI over the hold.
Questions for the listing agent
- What do current leases actually rent for vs. the listed asking? Can we see a recent rent roll and the last 12 months of T-12 income?
- It's been on market 32 days. Have you received any prior offers? Is the seller open to a 26% concession, seller financing, or rate buy-down credit?
- Built in 1956 — when were the roof, HVAC, electrical panel, plumbing, and water heater last replaced?
- Is there a deadline driving the sale (1031 exchange, divorce, estate, relocation)? That informs how much negotiation room exists.
- Schools are D-rated, which usually means shorter tenancies and higher turnover. Who's the typical renter profile here, and what's been the actual vacancy rate?
- The area grade is low — what's the realistic commute time and amenity access for the typical tenant pool here? Any planned neighborhood developments (good or bad) we should know about?
- What's the average days-on-market for RENTAL listings here right now (not sales)? A rising rental-DOM trend means longer vacancies and softer asking-rent achievability than the comps imply.
- What's the recent tenant-quality profile in this submarket — average credit score on applications, eviction rate, late-payment / NSF rate, and stable-employment percentage? A property-management company in the area should have these aggregated.
- How much new for-sale + rental construction is in the pipeline within 1–3 miles? Heavy new supply typically softens prices + rents 12–24 months out; constrained supply supports both.
Investment metrics
- 1% rule
- 0.74% ✗
- Cap rate
- 6.07%
- Cash-on-cash
- -0.78%
- DSCR
- 0.97
- GRM
- 11.2
CMA / ARV
No comps found within radius.
Projected returns pro-forma
-3.0% appreciation · 3.0% rent growth · sell at horizon
- IRR
- -17.6%
- Equity multiple
- 0.38×
- Total profit
- $-36,558
- Equity at exit
- $31,312
- IRR
- -9.8%
- Equity multiple
- 0.40×
- Total profit
- $-35,333
- Equity at exit
- $18,157
Cash invested: $58,800 (down + closing). Projections, not guarantees.
Landlord ↔ Tenant lean methodology
- Overall (STATE)
- 81 Strongly Landlord-Friendly
- State Missouri
- 81 Strongly Landlord-Friendly · R+10
- County
- — inherits STATE
- City
- — inherits STATE
ZIP-level market 63019
- Home prices YoY
- -28.1%
- Active inventory
- 17
- Price-to-rent
- 11.2×
Monthly cashflow live
- Estimated rent
- $1,559 medium interval (Pro) →
- Mortgage (P&I)
- −$1,101
- Tax from tax record
- −$82 /mo · $978/yr
- Insurance
- −$88
- HOA
- −$0
- Vacancy / Maint / Mgmt
- −$327
- Net cashflow
- $-38
Break-even live
Sensitivity live
| Price | -10% $81 | -5% $21 | +0% $-38 | +5% $-98 | +10% $-157 |
|---|---|---|---|---|---|
| Rent | -10% $-162 | -5% $-100 | +0% $-38 | +5% $23 | +10% $85 |
| Rate | -1.0pp $67 | -0.5pp $15 | base $-38 | +0.5pp $-93 | +1.0pp $-148 |
UW: 25.0% down · 7.5% · 30yr · 1.5% tax · 5.0% vac · 8.0% maint · 8.0% mgmt
Financing live
Cash to close
- Down payment
- $52,500
- Closing costs
- $6,300
- Reserves months
- —
- Total cash needed
- —
Loan-product check · same deal, 3 products live
Conventional
25% down · 7.5% · 30yr
- Down + closing
- —
- Monthly P&I
- —
- Monthly cashflow
- —
- DSCR
- —
- Eligible?
- —
Personal DTI + credit; lowest rate.
DSCR
20% down · 8.5% · 30yr
- Down + closing
- —
- Monthly P&I
- —
- Monthly cashflow
- —
- DSCR
- —
- Eligible?
- —
No personal income docs; deal must DSCR.
Hard money
10% down · 12.0% · 12mo
- Down + closing
- —
- Monthly P&I
- —
- Monthly cashflow
- —
- DSCR
- —
- Eligible?
- —
Short-term bridge; refi at stabilization.
Rent comps 3 comps
| Address | Beds | Baths | Sqft | Rent | $/sqft | DOM | Units | Dist |
|---|---|---|---|---|---|---|---|---|
| 100 Ozark Dr Crystal City, MO | 3.0 | 1.0 | 1064 | $1,500 | $1.41 | 25d | 1 | 0.46mi |
| 535 S Adams St Festus, MO | 2.0 | 1.0 | 977 | $1,300 | $1.33 | 0d | 1 | 0.93mi |
| 102 Doctrine Dr Festus, MO | 3.0 | 2.0 | 1350 | $2,199 | $1.63 | 23d | 1 | 1.29mi |
Listing history 21 events
-
2026-06-21days on market $210,000 Active 32 DOM
-
2026-06-21days on market $210,000 Active 31 DOM
-
2026-06-18days on market $210,000 Active 29 DOM
-
2026-06-17days on market $210,000 Active 28 DOM
-
2026-06-16days on market $210,000 Active 27 DOM
-
2026-06-15days on market $210,000 Active 26 DOM
-
2026-06-13days on market $210,000 Active 24 DOM
-
2026-06-12days on market $210,000 Active 23 DOM
-
2026-06-09days on market $210,000 Active 20 DOM
-
2026-06-08days on market $210,000 Active 19 DOM
-
2026-06-07days on market $210,000 Active 18 DOM
-
2026-06-07pricedays on market $210,000 Active 17 DOM
-
2026-06-04days on market $225,000 Active 14 DOM
-
2026-06-02days on market $225,000 Active 13 DOM
-
2026-06-01days on market $225,000 Active 12 DOM
-
2026-05-31days on market $225,000 Active 11 DOM
-
2026-05-20$225,000 Active
-
2026-05-18historical $225,000
-
2013-09-17soldstatus
-
2013-08-29soldstatus 553-char remark
Show marketing remark (553 chars)
Contract first day on market fell thru no fault with house or seller! Very cute and extremely well maintained 3 bedroom home in great community. Move right in! Exterior is maintenance free with a large, level, fenced yard and a 1 car detached garage with GDO. Living room has original mill work and laminate wood floors. There are 3 bedroom. Although one is small it would make a great office or nursery! Main floor laundry too! Kitchen walks out to a small enclosed porch that leads to back yard. A really great house at a really great price!!!
-
2013-07-12$70,000 553-char remark
Show marketing remark (553 chars)
Contract first day on market fell thru no fault with house or seller! Very cute and extremely well maintained 3 bedroom home in great community. Move right in! Exterior is maintenance free with a large, level, fenced yard and a 1 car detached garage with GDO. Living room has original mill work and laminate wood floors. There are 3 bedroom. Although one is small it would make a great office or nursery! Main floor laundry too! Kitchen walks out to a small enclosed porch that leads to back yard. A really great house at a really great price!!!
ⓘ Source: listings_history table (triggers on properties + properties_extension) + one-shot
backfill from property_details.listing_events for pre-trigger history.
Tax reassessment forecast MO · Resets to sale price
- Current annual tax
- $978 · $82/mo
- Projected year-2 tax
- $2,037 · $170/mo
- Expected delta
- +$1,059/yr (+$88/mo · 108.2%)
ⓘ Screening estimate from a state-policy table — verify with the county assessor before closing.
Climate risk First Street
- Flood 1/10 Low FEMA zone X (unshaded) · 0% chance over 30 yrs
- Wildfire 3/10 Moderate
- Heat 5/10 Major 7 d/yr ≥107°F today · 20 d/yr by 30 yrs out
- Wind 2/10 Low 100% chance of damaging wind over 30 yrs
- Air quality 1/10 Low 0 unhealthy d/yr today · 0 by 30 yrs out
Nearby sold comps map
Loading sold comps map…
Walkable amenities ~0.75 mi
Loading nearby amenities…
Taxation est. · year 1
- Rental income
- $18,713
- − Mortgage interest
- −$11,763
- − Property taxes
- −$978
- − Insurance
- −$1,050
- − Repairs & maintenance
- −$1,497
- − Management
- −$1,497
- − Depreciation
- −$6,109
- Taxable loss
- −$4,181
- Est. tax savings @ 24.0%
- +$1,004
- After-tax cash flow
- $544/yr
For passive investors: Depreciation is non-cash, so a rental often shows a tax loss while cash-flowing — sheltering income. Rental losses are passive: they offset passive income freely, and up to $25,000/yr can offset ordinary (W-2) income if you actively participate and your MAGI is under $100k (phasing out to $0 by $150k); unused losses carry forward. On sale, claimed depreciation is recaptured at up to 25%, and gains may owe capital-gains tax (a 1031 exchange can defer both). Figures are a year-1 estimate at your 24.0% rate — not tax advice; consult a CPA.
Schools (NCES district)
- District
- Crystal City 47
- NCES district ID
- 2910380
- Math proficiency
- 31% ▼ -7.00%
- Reading proficiency
- 54% ▼ -3.00%
- Median HH income
- $50,257
- Composite
- 36.5/100
- National rank
- #4649
- State rank
- #113 of 324 in MO
Livability — Crystal City
- Score
- 71/100
- State rank
- #119
- US rank
- #7294
Category grades
Schools grade is shown separately in the Schools card above.
Census & demographics
- Census place
- Crystal City, MO
- City population
- 4,490
- Population (ZIP)
- 4,490
Population outlook (Jefferson County) Hauer SSP2
- Today (2025)
- 235,088 people
- By 2030
- 238,365 · +1.4%
- By 2040
- 240,156 · +2.2%
- By 2050
- 234,651 · -0.2%
- By 2075
- 214,569 · -8.7%
- By 2100
- 179,697 · -23.6%
Race, ethnicity, and origin ACS 2023
- Neighborhood character
- Predominantly White (86%)
- Race & ethnicity
- White 86% Two or more races 9% Black 4%
- Common ancestry
- Lithuanian 9% Serbian 3% Italian 2%
- Foreign-born
- 1%
- Languages at home
- 99% English-only · Tagalog/Filipino 1%
Political lean MEDSL · Jefferson
- 2024 margin
- Solid R (+36.7) · D 31.0% · R 67.7% · Other 1.3%
- 2008→2024 swing
- -39.3pp toward R · 2008: 2.5pp · 2024: -36.7pp
- All cycles
- 2024: R+36.7 2020: R+33.9 2016: R+35.3 2012: R+12.7 2008: D+2.5
Not yet ingested
- Civics
- —
Market trends
- HPI YoY
- ▼ -84.19%
- Current HPI
- 215.1127
- Rent YoY
- —
- Metro
- —
- State GDP YoY
- ▲ 1.84%
- F500 in state
- 20
Industry mix (Fortune 500 HQ in MO)
| Industry | F500 HQs | Revenue |
|---|---|---|
| Healthcare | 1 | $163B |
|
||
| Insurance | 1 | $21B |
|
||
| Industrial Technology | 1 | $17B |
|
||
| Retail | 1 | $16B |
|
||
| Industrial Distribution | 1 | $10B |
|
||
| Utilities | 1 | $9B |
|
||
Price history
+221.4% since first listed5 events — show timeline
- 2026-05-20 Listed $225,000 MARIS as Distributed by MLS Grid
- 2026-05-18 Coming Soon $225,000 MARIS as Distributed by MLS Grid
- 2013-09-17 Sold (Public Records) — Public Records
- 2013-08-29 Sold (MLS) — MARIS as Distributed by MLS Grid
- 2013-07-12 Listed $70,000 MARIS as Distributed by MLS Grid
Property tax history
+2.8%/yrLatest (2025): $978 · +6.9% YoY. Source: county tax records.
Cash-flow waterfall
monthlySold comps — $/sqft
last 12 mo · ≤1 miLoading sold comps…