 🏗️ New Construction
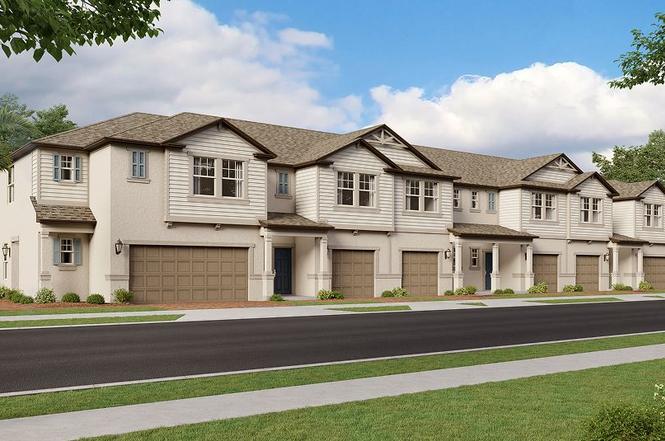
Mulberry Plan · Connerton, FL
Flood risk 1/10 · Minimal
- FEMA flood zone
- A
- Chance of flooding over 30 yrs
- 0.0%
- Est. flood insurance / yr
- $1,009 – $1,996
Fire risk 6/10 · Moderate
- Est. fire insurance / yr
- $947 – $1,759
Heat risk 10/10 · Severe
- Hot days now (above 109°F)
- 7 days/yr
- Hot days in 30 yrs
- 27 days/yr
Wind risk 9/10 · Severe
- Chance of severe wind over 30 yrs
- 99.0%
Air-quality risk 2/10 · Minimal
- Unhealthy air days now
- 1 days/yr
- Unhealthy air days in 30 yrs
- 1 days/yr
Risk factors via First Street. Map © Google.
Why this score? — see what drove the C grade
The composite is a weighted blend of 9 inputs, each scored 0–100. Each bar is that input's sub-score; the figure is the points it added to the 100-point composite (weight × sub-score).
- Cash flow +22.2/30.0
- ARV discount +7.5/15.0
- DSCR +7.1/10.0
- 1% rule +5.8/10.0
- Schools +4.3/10.0
- Appreciation +4.2/10.0
- Livability +3.3/5.0
- Rent growth +2.5/5.0
- Condition / age +2.5/5.0
$272,490
🖨 Deal sheet (PDF) 📄 Offer letter ✓ Due diligence
Listing remarks
A porch leads into the first level of this two-story townhome where the family room, dining room and kitchen are situated among an open floorplan that maximizes the footprint of the interior. A lanai at the back is the perfect spot to enjoy a morning cup of coffee. Three bedrooms, all situated upstairs, complete this home.
Key facts
- Open floorplan
- Lanai
- Garage
Tags
Property features AI
Finance
- Other: Listing status: Active
- Financial info: List price: $281,190
Exterior
- Parking: 1 garage space (1 total parking space)
- Home design: New construction plan: Mulberry; Inventory type: Plan
- Exterior features: Address: 20421 Rose Cottage Way, Land O Lakes, FL 34637
Interior
- Bedrooms: 3 bedrooms
- Bathrooms: 2 full bathrooms and 1 half bathroom (2.5 total)
- Interior features: Open floor plan (Mulberry plan); Living area approximately 1601
Neighborhood map
What this means for you Summary
Snapshot
- This is a 3-bed/2.5-bath townhouse listed at $272k.
Deal economics
- At list price, monthly cash flow is $319 ($4k/yr) — positive.
- The deal already cash-flows at list — no discount required.
- Meets the 1% rule at list price ($3k rent vs $272k).
- Recommended offer: $240k (12.0% below list) — sets the bar for market timing.
- Cap rate 8.3% vs local median 4.3% in Connerton — top-decile yield for the area; either an underpriced asset or a hidden risk that comps aren't pricing in. Stress-test before assuming the spread holds.
Location & tenants
- Location reads 66/100 on livability (#596 in FL) — a middle-class / working-renter tenant base. Strengths: crime A+, employment A+, housing A+; Watch: schools D+, amenities F, commute F.
- Pasco (suburban): math 50% / reading 52% proficiency, ranked #32 of 73 in FL (top 44%) — acceptable for families but not a draw, mixed tenant base, ~2y average lease.
- Market conditions: 285 active listings in the ZIP; 7 comparable units currently listed for rent nearby; rentals at typical pace (median 16d on market — plan ~3-4 weeks tenant-placement turnaround); high-income renter base; 6,765 units permitted in Pasco County in 2024 (1,250 in 5+ unit buildings).
- This rent runs 31% of the median local income ($115k/yr) — at the standard rent-burdened threshold; future hikes will face affordability resistance.
Forward outlook
- Local home prices are declining (-1.5%/yr); year-one equity from $2k of loan paydown is wiped out by about $4k of value loss. Plan a longer hold.
- Pasco County population projected at +29% by 2050 — long-run rental-demand tailwind backs the buy-and-hold thesis.
Negotiation context
- It's been on market 274 days — a 12% lower offer ($240k) is reasonable based on typical stale-listing flexibility.
Risks & watch-outs
- Watch-outs: flood insurance adds $125/mo.
- Climate carrying-cost: in FEMA flood zone A (mandatory federal flood insurance); severe wind risk, 99% chance of damaging wind over 30y; major wildfire risk; extreme-heat days projected 7→27/yr by 2055 (HVAC capex compounding) — expect insurance premiums to compound above CPI over the hold.
Questions for the listing agent
- It's been on market 274 days. Have you received any prior offers? Is the seller open to a 12% concession, seller financing, or rate buy-down credit?
- What's the actual annual flood-insurance premium (NFIP or private), and is the property in a SFHA with mandatory coverage?
- Why hasn't it sold? Are there any deal-killer items the seller is aware of (foundation, flood, title, zoning, code violations)?
- Is there a deadline driving the sale (1031 exchange, divorce, estate, relocation)? That informs how much negotiation room exists.
- Schools are D-rated, which usually means shorter tenancies and higher turnover. Who's the typical renter profile here, and what's been the actual vacancy rate?
- What's the average days-on-market for RENTAL listings here right now (not sales)? A rising rental-DOM trend means longer vacancies and softer asking-rent achievability than the comps imply.
- What's the recent tenant-quality profile in this submarket — average credit score on applications, eviction rate, late-payment / NSF rate, and stable-employment percentage? A property-management company in the area should have these aggregated.
- How much new for-sale + rental construction is in the pipeline within 1–3 miles? Heavy new supply typically softens prices + rents 12–24 months out; constrained supply supports both.
Investment metrics
- 1% rule
- 1.08% ✓
- Cap rate
- 8.25%
- Cash-on-cash
- 6.99%
- DSCR
- 1.31
- GRM
- 7.7
CMA / ARV
No comps found within radius.
Projected returns pro-forma
-1.54% appreciation · 3.0% rent growth · sell at horizon
- IRR
- -2.1%
- Equity multiple
- 0.91×
- Total profit
- $-6,610
- Equity at exit
- $58,803
- IRR
- 5.3%
- Equity multiple
- 1.48×
- Total profit
- $36,531
- Equity at exit
- $55,985
Cash invested: $76,297 (down + closing). Projections, not guarantees.
Landlord ↔ Tenant lean methodology
- Overall (STATE)
- 87 Strongly Landlord-Friendly
- State Florida
- 87 Strongly Landlord-Friendly · R+3
- County
- — inherits STATE
- City
- — inherits STATE
ZIP-level market 34637
- Home prices YoY
- -1.2%
- Active inventory
- 285
- Price-to-rent
- 7.7×
Monthly cashflow live
- Estimated rent
- $2,946 high interval (Pro) →
- Mortgage (P&I)
- −$1,429
- Tax est. 1.5%
- −$341 /mo · $4,087/yr
- Insurance
- −$114
- Flood insurance flood zone
- −$125 /mo · $1,502/yr
- HOA
- −$0
- Vacancy / Maint / Mgmt
- −$619
- Net cashflow
- $319
Break-even live
Sensitivity live
| Price | -10% $508 | -5% $414 | +0% $319 | +5% $225 | +10% $131 |
|---|---|---|---|---|---|
| Rent | -10% $87 | -5% $203 | +0% $319 | +5% $436 | +10% $552 |
| Rate | -1.0pp $457 | -0.5pp $389 | base $319 | +0.5pp $249 | +1.0pp $177 |
UW: 25.0% down · 7.5% · 30yr · 1.5% tax · 5.0% vac · 8.0% maint · 8.0% mgmt
Financing live
Cash to close
- Down payment
- $68,122
- Closing costs
- $8,175
- Reserves months
- —
- Total cash needed
- —
Loan-product check · same deal, 3 products live
Conventional
25% down · 7.5% · 30yr
- Down + closing
- —
- Monthly P&I
- —
- Monthly cashflow
- —
- DSCR
- —
- Eligible?
- —
Personal DTI + credit; lowest rate.
DSCR
20% down · 8.5% · 30yr
- Down + closing
- —
- Monthly P&I
- —
- Monthly cashflow
- —
- DSCR
- —
- Eligible?
- —
No personal income docs; deal must DSCR.
Hard money
10% down · 12.0% · 12mo
- Down + closing
- —
- Monthly P&I
- —
- Monthly cashflow
- —
- DSCR
- —
- Eligible?
- —
Short-term bridge; refi at stabilization.
Rent comps 7 comps
| Address | Beds | Baths | Sqft | Rent | $/sqft | DOM | Units | Dist |
|---|---|---|---|---|---|---|---|---|
| 8710 Preston Woods Ct Land O Lakes, FL | 3.0 | 2.0 | 1684 | $2,850 | $1.69 | 18d | 1 | 0.90mi |
| 20191 Sabal Palm Ct Land O' Lakes, FL | 1.0–3.0 | 1.0–2.5 | 1404 | $3,338 | $2.38 | 0d | 21 | 1.30mi |
| 21030 Green Wing Ct Land O Lakes, FL | 4.0 | 2.5 | 1945 | $2,185 | $1.12 | 25d | 1 | 1.39mi |
| 21818 Lyonia Ln Land O Lakes, FL | 3.0 | 2.5 | 1601 | $2,250 | $1.41 | 15d | 1 | 1.45mi |
| 21831 Adriatic Ln Land O Lakes, FL | 3.0 | 3.0 | 1601 | $1,995 | $1.25 | 0d | 1 | 1.49mi |
| 21831 Adriatic Ln Land O Lakes, FL | 3.0 | 3.0 | 1601 | $1,995 | $1.25 | 5d | 1 | 1.49mi |
| 9750 Campanula Ct Land O Lakes, FL | 3.0 | 2.5 | 2208 | $2,700 | $1.22 | 25d | 1 | 1.49mi |
Listing history 14 events
-
2026-06-18days on market $272,490 Active 274 DOM
-
2026-06-17days on market $272,490 Active 273 DOM
-
2026-06-16days on market $272,490 Active 272 DOM
-
2026-06-15price $272,490 Active 271 DOM
-
2026-06-15pricedays on market $272,390 Active 271 DOM
-
2026-06-13pricedays on market $271,390 Active 269 DOM
-
2026-06-09days on market $271,290 Active 265 DOM
-
2026-06-08days on market $271,290 Active 264 DOM
-
2026-06-07pricedays on market $271,290 Active 263 DOM
-
2026-06-04days on market $271,190 Active 260 DOM
-
2026-06-03days on market $271,190 Active 259 DOM
-
2026-06-02pricedays on market $271,190 Active 258 DOM
-
2026-06-01days on market $281,190 Active 257 DOM
-
2026-05-31days on market $281,190 Active 256 DOM
ⓘ Source: listings_history table (triggers on properties + properties_extension) + one-shot
backfill from property_details.listing_events for pre-trigger history.
Climate risk First Street
- Flood 1/10 Low FEMA zone A · 0% chance over 30 yrs
- Wildfire 6/10 Major
- Heat 10/10 Extreme 7 d/yr ≥109°F today · 27 d/yr by 30 yrs out
- Wind 9/10 Extreme 99% chance of damaging wind over 30 yrs
- Air quality 2/10 Low 1 unhealthy d/yr today · 1 by 30 yrs out
Nearby sold comps map
Loading sold comps map…
Walkable amenities ~0.75 mi
Loading nearby amenities…
Taxation est. · year 1
- Rental income
- $35,357
- − Mortgage interest
- −$15,264
- − Property taxes
- −$4,087
- − Insurance
- −$2,865
- − Repairs & maintenance
- −$2,829
- − Management
- −$2,829
- − Depreciation
- −$7,927
- Taxable loss
- −$443
- Est. tax savings @ 24.0%
- +$106
- After-tax cash flow
- $3,939/yr
For passive investors: Depreciation is non-cash, so a rental often shows a tax loss while cash-flowing — sheltering income. Rental losses are passive: they offset passive income freely, and up to $25,000/yr can offset ordinary (W-2) income if you actively participate and your MAGI is under $100k (phasing out to $0 by $150k); unused losses carry forward. On sale, claimed depreciation is recaptured at up to 25%, and gains may owe capital-gains tax (a 1031 exchange can defer both). Figures are a year-1 estimate at your 24.0% rate — not tax advice; consult a CPA.
Schools (NCES district)
- District
- Pasco
- NCES district ID
- 1201530
- Math proficiency
- 50% ▼ -10.00%
- Reading proficiency
- 52% ▼ -5.00%
- Median HH income
- $45,039
- Composite
- 43.14/100
- National rank
- #3074
- State rank
- #32 of 73 in FL
Livability — Connerton
- Score
- 66/100
- State rank
- #596
- US rank
- #11437
Category grades
Schools grade is shown separately in the Schools card above.
Census & demographics
- Census place
- Connerton, FL
- County
- Pasco County · 524,098 people
- City population
- 11,398
- Metro
- Tampa-St. Petersburg-Clearwater, FL
- Population (ZIP)
- 13,049
- Household income
- $115,214
- Rent vs Own
- Severe rent burden
- 96.0
Population outlook (Pasco County) Hauer SSP2
- Today (2025)
- 570,045 people
- By 2030
- 605,844 · +6.3%
- By 2040
- 674,806 · +18.4%
- By 2050
- 736,022 · +29.1%
- By 2075
- 862,900 · +51.4%
- By 2100
- 906,364 · +59.0%
Race, ethnicity, and origin ACS 2023
- Neighborhood character
- Predominantly White (70%)
- Race & ethnicity
- White 70% Hispanic / Latino 16% Two or more races 10% Black 7% Asian 5%
- Hispanic origin (detail)
- Mexican 1% Puerto Rican 10% Cuban 1%
- Common ancestry
- Romanian 5% Italian 3% Iranian 2%
- Foreign-born
- 8% · Canada
- Languages at home
- 85% English-only · Spanish 8% Other Indo-European 4% Tagalog/Filipino 1%
Political lean MEDSL · Pasco
- 2024 margin
- Strong R (+25.2) · D 36.9% · R 62.1% · Other 1.0%
- 2008→2024 swing
- -21.6pp toward R · 2008: -3.6pp · 2024: -25.2pp
- All cycles
- 2024: R+25.2 2020: R+20.1 2016: R+21.6 2012: R+6.7 2008: R+3.6
Not yet ingested
- Civics
- —
Market trends
- HPI YoY
- ▼ -1.54%
- Current HPI
- 126.1415
- Rent YoY
- —
- Metro
- Tampa-St. Petersburg-Clearwater, FL
- State GDP YoY
- ▲ 3.28%
- F500 in state
- 36
Industry mix (Fortune 500 HQ in FL)
| Industry | F500 HQs | Revenue |
|---|---|---|
| Industrial Technology | 2 | $29B |
|
||
| Insurance | 2 | $17B |
|
||
| Retail | 1 | $60B |
|
||
| Technology Distribution | 1 | $58B |
|
||
| Homebuilding | 1 | $35B |
|
||
| Technology Manufacturing | 1 | $35B |
|
||
Cash-flow waterfall
monthlySold comps — $/sqft
last 12 mo · ≤1 miLoading sold comps…