10749 New haven St · Los Angeles, CA
Flood risk 8/10 · Major
- FEMA flood zone
- X (unshaded)
- Chance of flooding over 30 yrs
- 0.78%
- Est. flood insurance / yr
- $507 – $1,088
Fire risk 5/10 · Moderate
- Est. fire insurance / yr
- $659 – $1,223
Heat risk 7/10 · Major
- Hot days now (above 96°F)
- 7 days/yr
- Hot days in 30 yrs
- 21 days/yr
Wind risk 1/10 · Minimal
- Chance of severe wind over 30 yrs
- —
Air-quality risk 5/10 · Moderate
- Unhealthy air days now
- 7 days/yr
- Unhealthy air days in 30 yrs
- 9 days/yr
Risk factors via First Street. Map © Google.
Why this score? — see what drove the B- grade
The composite is a weighted blend of 9 inputs, each scored 0–100. Each bar is that input's sub-score; the figure is the points it added to the 100-point composite (weight × sub-score).
- Cash flow +22.3/30.0
- ARV discount +15.0/15.0
- 1% rule +7.3/10.0
- DSCR +7.1/10.0
- Condition / age +4.0/5.0
- Schools +3.6/10.0
- Livability +3.4/5.0
- Rent growth +2.4/5.0
- Appreciation +0.0/10.0
$199,000
🖨 Deal sheet 📄 Offer letter ✓ Due diligence
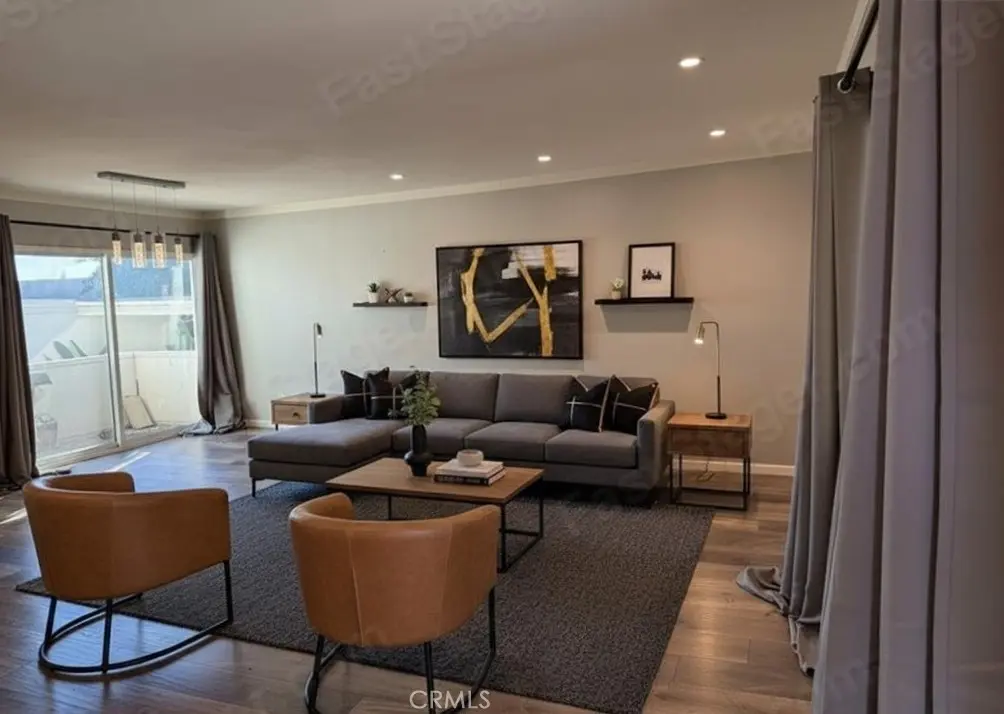
Listing remarks
Priced aggressively for CASH offers only, no financing available! One of the LARGEST 1-bedroom floor plans in the entire Orpheum Gardens co-op! Top-floor corner unit with no one above, tons of natural light flooding the entire space, and peaceful tree-top views from your private balcony. Move-in ready with vinyl plank floors, granite counters, newer stainless appliances, recessed lighting, updated electrical wiring, newer windows, and efficient wall-unit A/C. Assigned 1 parking spot, sparkling community pool + table tennis for fun weekends. Low monthly HOA fee of only $238 covers water, trash, and all exterior maintenance. Pet-friendly and perfectly located just minutes to the 5/170/210 fre
Key facts
- Private balcony
- Recessed lighting
- Vinyl plank floors
Tags
Property features AI
Finance
- Other: Lease considered
- Financial info: Land lease
- HOA & community: Part of an association (The Orpheum, Inc.); Monthly association fee of $238; Association amenities include pool
Exterior
- Parking: One garage space; One total parking space
- Utilities: Public sewer; District/public water
- Home design: Multi-family property; Attached unit; Two-story building; Part of a stock cooperative; Total of 33 units in the complex
- Construction: Property data from assessor (year built source: Assessor); One common wall
- Exterior features: Community pool; Sidewalks; 0–1 unit/acre lot characteristic
Interior
- Bedrooms: One bedroom on the main level
- Bathrooms: One full bathroom
- Heating & cooling: Wall/window cooling
- Interior features: Two-level interior; Entry on main level; Living room
- Laundry & utility: Laundry area inside
Neighborhood map
What this means for you Summary
Snapshot
- This is a 1-bed/1.0-bath single-family listed at $199k. Condition is rated good.
Deal economics
- At list price, monthly cash flow is $261 ($3k/yr) — positive.
- The deal already cash-flows at list — no discount required.
- Meets the 1% rule at list price ($2k rent vs $199k).
- Recommended offer: $193k (3.0% below list) — sets the bar for market timing.
- Cap rate 8.3% vs local median 2.1% in Los Angeles — top-decile yield for the area; either an underpriced asset or a hidden risk that comps aren't pricing in. Stress-test before assuming the spread holds.
Location & tenants
- Location reads 68/100 on livability (#273 in CA) — a middle-class / working-renter tenant base. Strengths: amenities A+, commute A+, employment B; Watch: health & safety C-, schools D+, crime F.
- Los Angeles Unified (urban): math 29% / reading 54% proficiency, ranked #223 of 517 in CA (top 43%) — families likely to look elsewhere, expect single-tenant / working-renter base with shorter leases; 67% free/reduced lunch — lower-income household profile, screen leases tightly.
- Market conditions: Rents soft (-0.5%/yr); 78 active listings in the ZIP; 15 comparable units currently listed for rent nearby; rentals lingering (median 44d on market — plan ~5-8 weeks vacancy on turnover, expect pricing pressure); 73% of comp listings sitting > 30 days — soft ceiling on asking rent; solid renter incomes; 19,697 units permitted in Los Angeles County in 2024 (9,426 in 5+ unit buildings).
- This rent runs 38% of the median local income ($78k/yr) — at the standard rent-burdened threshold; future hikes will face affordability resistance.
Forward outlook
- Local home prices are declining (-3.0%/yr); year-one equity from $1k of loan paydown is wiped out by about $6k of value loss. Plan a longer hold.
- Los Angeles County population projected at +9% by 2050 — modest demand growth; plan on rents tracking national, not racing it.
Negotiation context
- It's been on market 44 days — a 3% lower offer ($193k) is reasonable based on typical stale-listing flexibility.
- 2 sale attempts; this cycle's ask is 10053% above the opening price — seller raised mid-cycle; expect resistance to lowballs.
Risks & watch-outs
- Watch-outs: flood insurance adds $66/mo.
- Climate carrying-cost: severe flood risk; moderate wildfire risk; extreme-heat days projected 7→21/yr by 2055 (HVAC capex compounding) — expect insurance premiums to compound above CPI over the hold.
Questions for the listing agent
- It's been on market 44 days. Have you received any prior offers? Is the seller open to a 3% concession, seller financing, or rate buy-down credit?
- Built in 1965 — when were the roof, HVAC, electrical panel, plumbing, and water heater last replaced?
- What's the actual annual flood-insurance premium (NFIP or private), and is the property in a SFHA with mandatory coverage?
- What does the HOA fee cover, when was the last increase, and are there any pending special assessments or reserve-fund shortfalls?
- Is there a deadline driving the sale (1031 exchange, divorce, estate, relocation)? That informs how much negotiation room exists.
- Schools are D-rated, which usually means shorter tenancies and higher turnover. Who's the typical renter profile here, and what's been the actual vacancy rate?
- Crime grade is F in this area — have there been break-ins, vandalism, or insurance claims at this property in the last 3 years? What carrier currently insures it and at what premium?
- What's the average days-on-market for RENTAL listings here right now (not sales)? A rising rental-DOM trend means longer vacancies and softer asking-rent achievability than the comps imply.
- What's the recent tenant-quality profile in this submarket — average credit score on applications, eviction rate, late-payment / NSF rate, and stable-employment percentage? A property-management company in the area should have these aggregated.
- How much new for-sale + rental construction is in the pipeline within 1–3 miles? Heavy new supply typically softens prices + rents 12–24 months out; constrained supply supports both.
Investment metrics
- 1% rule
- 1.23% ✓
- Cap rate
- 8.27%
- Cash-on-cash
- 7.05%
- DSCR
- 1.31
- GRM
- 6.8
CMA / ARV
- ARV (median comp)
- $378,418
- List price
- $199,000
- Delta
- -47.41%
- Verdict
- UNDERPRICED
- Comps
- 18 within 1.0 mi
Show comp detail 4 sales within ~0.75 mi
| Address | Dist | Beds/Ba | Sqft | Sold | Price | $/sf | Match |
|---|---|---|---|---|---|---|---|
| 10817 Cantara St | 0.49mi | 2/1.0 (+1) | 854 (+12%) | 1mo | $670,000 | $785 | 51 |
| 10952 Penrose St | 0.33mi | 2/1.0 (+1) | 692 (-9%) | 23mo | $500,000 | $723 | 44 |
| 8326 Wheatland Ave | 0.40mi | 2/1.0 (+1) | 660 (-14%) | 22mo | $573,000 | $868 | 36 |
| 10821 Crockett St | 0.43mi | 2/2.0 (+1) | 648 (-15%) | 14mo | $648,000 | $1,000 | 34 |
Match score weights: distance 35% · size 25% · config 20% · recency 20%. Top-matched comps best support the ARV.
Projected returns pro-forma
-3.0% appreciation · 0.0% rent growth · sell at horizon
- IRR
- -11.6%
- Equity multiple
- 0.59×
- Total profit
- $-22,605
- Equity at exit
- $29,672
- IRR
- -8.6%
- Equity multiple
- 0.55×
- Total profit
- $-25,198
- Equity at exit
- $17,206
Cash invested: $55,720 (down + closing). Projections, not guarantees.
Landlord ↔ Tenant lean methodology
- Overall (CITY)
- 0 Strongly Tenant-Friendly
- State California
- 18 Strongly Tenant-Friendly · D+13
- County
- — inherits STATE
- City Los Angeles
- 0 Strongly Tenant-Friendly · D+22
ZIP-level market 91352
- Rents YoY
- -0.5%
- Active inventory
- 78
- Price-to-rent
- 6.8×
Monthly cashflow live
- Estimated rent
- $2,456 high interval (Pro) →
- Mortgage (P&I)
- −$1,044
- Tax est. 1.5%
- −$249 /mo · $2,985/yr
- Insurance
- −$83
- Flood insurance flood zone
- −$66 /mo · $798/yr
- HOA
- −$238
- Vacancy / Maint / Mgmt
- −$516
- Net cashflow
- $261
Break-even live
UW: 25.0% down · 7.5% · 30yr · 1.5% tax · 5.0% vac · 8.0% maint · 8.0% mgmt
Financing live
Cash to close
- Down payment
- $49,750
- Closing costs
- $5,970
- Reserves months
- —
- Total cash needed
- —
Loan-product check · same deal, 3 products live
Conventional
25% down · 7.5% · 30yr
- Down + closing
- —
- Monthly P&I
- —
- Monthly cashflow
- —
- DSCR
- —
- Eligible?
- —
Personal DTI + credit; lowest rate.
DSCR
20% down · 8.5% · 30yr
- Down + closing
- —
- Monthly P&I
- —
- Monthly cashflow
- —
- DSCR
- —
- Eligible?
- —
No personal income docs; deal must DSCR.
Hard money
10% down · 12.0% · 12mo
- Down + closing
- —
- Monthly P&I
- —
- Monthly cashflow
- —
- DSCR
- —
- Eligible?
- —
Short-term bridge; refi at stabilization.
Rent comps 15 comps
| Address | Beds | Baths | Sqft | Rent | $/sqft | DOM | Units | Dist |
|---|---|---|---|---|---|---|---|---|
| 10938 Olinda St Sun Valley, CA | 2.0 | 2.0 | 800 | $2,700 | $3.38 | 10d | 1 | 0.20mi |
| 8747 Lehigh Ave Sun Valley, CA | 1.0 | 1.0 | 650 | $2,200 | $3.38 | 43d | 1 | 0.36mi |
| 8206 Wheatland Ave Sun Valley, CA | 1.0 | 1.0 | 550 | $1,800 | $3.27 | 43d | 1 | 0.58mi |
| 10503 Cantara St Sun Valley, CA | 2.0 | 2.0 | 1000 | $3,500 | $3.50 | 43d | 1 | 0.64mi |
| 10817 White St Sun Valley, CA | 2.0 | 1.0 | 750 | $1,895 | $2.53 | 43d | 1 | 0.67mi |
| 8372 Vine Valley Dr Sun Valley, CA | 2.0 | 2.0 | 740 | $2,500 | $3.38 | 43d | 1 | 0.72mi |
| 11038 Arminta St Sun Valley, CA | 2.0–3.0 | 1.0–2.0 | 975 | $2,350 | $2.41 | 2d | 3 | 0.99mi |
| 7834 Claybeck Ave Sun Valley, CA | 2.0 | 1.0 | 850 | $2,850 | $3.35 | 43d | 1 | 1.32mi |
| 11554 Arminta St North Hollywood, CA | 2.0 | 2.0 | 800 | $3,395 | $4.24 | 7d | 1 | 1.37mi |
| 7847 Beck Ave North Hollywood, CA | 2.0 | 1.0 | 675 | $2,500 | $3.70 | 22d | 1 | 1.38mi |
| 7847 Beck Ave North Hollywood, CA | 2.0 | 1.0 | 675 | $2,500 | $3.70 | 43d | 1 | 1.38mi |
| 7632 Kraft Ave North Hollywood, CA | 1.0 | 1.0 | 800 | $2,190 | $2.74 | 43d | 1 | 1.45mi |
| 7436 Cleon Ave Sun Valley, CA | 2.0 | 1.0 | 620 | $2,350 | $3.79 | 43d | 1 | 1.46mi |
| 7780 Shadyspring Pl Unit B Burbank, CA | 1.0 | 1.0 | 650 | $2,600 | $4.00 | 43d | 1 | 1.50mi |
| 7425 Vineland Ave Unit 7425-07 Sun Valley, CA | 1.0 | 1.0 | 650 | $1,500 | $2.31 | 43d | 1 | 1.50mi |
HOA detail
- Monthly dues
- $238 · $2,856/yr
- Likely covers
- watertrashelectricexterior maint.pool
Listing history 14 events
-
2026-06-18days on market $199,000 Active 44 DOM
-
2026-06-17days on market $199,000 Active 43 DOM
-
2026-06-16days on market $199,000 Active 42 DOM
-
2026-06-15days on market $199,000 Active 41 DOM
-
2026-06-13days on market $199,000 Active 39 DOM
-
2026-06-09days on market $199,000 Active 35 DOM
-
2026-06-08days on market $199,000 Active 34 DOM
-
2026-06-07days on market $199,000 Active 33 DOM
-
2026-06-04days on market $199,000 Active 30 DOM
-
2026-06-03days on market $199,000 Active 29 DOM
-
2026-06-02days on market $199,000 Active 28 DOM
-
2026-06-01days on market $199,000 Active 27 DOM
-
2026-05-31days on market $199,000 Active 26 DOM
-
2026-05-05$199,000 Active 841-char remark
ⓘ Source: listings_history table (triggers on properties + properties_extension) + one-shot
backfill from property_details.listing_events for pre-trigger history.
Climate risk First Street
- Flood 8/10 Severe FEMA zone X (unshaded) · 78% chance over 30 yrs
- Wildfire 5/10 Major
- Heat 7/10 Severe 7 d/yr ≥96°F today · 21 d/yr by 30 yrs out
- Wind 1/10 Low
- Air quality 5/10 Major 7 unhealthy d/yr today · 9 by 30 yrs out
Nearby sold comps map
Loading sold comps map…
Walkable amenities ~0.75 mi
Loading nearby amenities…
Taxation est. · year 1
- Rental income
- $29,477
- − Mortgage interest
- −$11,147
- − Property taxes
- −$2,985
- − Insurance
- −$1,792
- − Repairs & maintenance
- −$2,358
- − Management
- −$2,358
- − HOA
- −$2,856
- − Depreciation
- −$5,789
- Taxable income
- $191
- Est. tax owed @ 24.0%
- −$46
- After-tax cash flow
- $3,085/yr
For passive investors: Depreciation is non-cash, so a rental often shows a tax loss while cash-flowing — sheltering income. Rental losses are passive: they offset passive income freely, and up to $25,000/yr can offset ordinary (W-2) income if you actively participate and your MAGI is under $100k (phasing out to $0 by $150k); unused losses carry forward. On sale, claimed depreciation is recaptured at up to 25%, and gains may owe capital-gains tax (a 1031 exchange can defer both). Figures are a year-1 estimate at your 24.0% rate — not tax advice; consult a CPA.
Condition & rehab AI · 13 photos
This move-in ready townhouse in Orpheum Gardens offers a spacious 1-bedroom floor plan with vinyl plank floors, granite counters, and newer appliances. The low HOA fee and pet-friendly environment make it an attractive option for both buyers and renters.
Value-add opportunities
- Both landscaping — improves curb appeal and adds value
- Both furniture — enhances living space and makes it more inviting
Renovation cost estimate screening
Value-add ROI direction
- Both landscaping — improves curb appeal and adds value ↑
- Both furniture — enhances living space and makes it more inviting ↑
ⓘ Cost ranges are severity-bucket heuristics (US national rule-of-thumb). Get contractor quotes + a written scope before underwriting a rehab budget.
Schools (NCES district)
- District
- Los Angeles Unified
- NCES district ID
- 0622710
- Math proficiency
- 29% ▼ -4.00%
- Reading proficiency
- 54% ▲ 10.00%
- Median HH income
- $50,403
- Composite
- 35.67/100
- National rank
- #4875
- State rank
- #223 of 517 in CA
Livability — Los Angeles
- Score
- 68/100
- State rank
- #273
- US rank
- #9237
Category grades
Schools grade is shown separately in the Schools card above.
Census & demographics
- Census place
- Los Angeles, CA
- County
- Los Angeles County · 9,444,647 people
- City population
- 3,838,149
- Metro
- Los Angeles-Long Beach-Anaheim, CA
- Population (ZIP)
- 46,899
- Household income
- $78,239
- Rent vs Own
- Severe rent burden
- 2063.0
Population outlook (Los Angeles County) Hauer SSP2
- Today (2025)
- 10,940,515 people
- By 2030
- 11,256,481 · +2.9%
- By 2040
- 11,729,929 · +7.2%
- By 2050
- 11,948,407 · +9.2%
- By 2075
- 11,818,114 · +8.0%
- By 2100
- 10,842,928 · -0.9%
Race, ethnicity, and origin ACS 2023
- Neighborhood character
- Predominantly Hispanic (68%)
- Race & ethnicity
- Hispanic / Latino 68% Two or more races 30% White 23% Asian 5% Black 2% Native American 1%
- Hispanic origin (detail)
- Mexican 51%
- Foreign-born
- 46% · Canada, South Korea, Vietnam
- Languages at home
- 20% English-only · Spanish 61% Other Indo-European 13% Tagalog/Filipino 2%
Political lean MEDSL · Los Angeles
- 2024 margin
- Solid D (+32.9) · D 64.8% · R 31.9% · Other 3.3%
- 2008→2024 swing
- -7.4pp toward R · 2008: 40.4pp · 2024: 32.9pp
- All cycles
- 2024: D+32.9 2020: D+44.2 2016: D+48.0 2012: D+40.0 2008: D+40.4
Not yet ingested
- Civics
- —
Market trends
- HPI YoY
- ▼ -927.76%
- Current HPI
- 470.8252
- Rent YoY
- ▼ -0.53%
- Metro
- Los Angeles-Long Beach-Anaheim, CA
- State GDP YoY
- ▲ 3.21%
- F500 in state
- 116
Industry mix (Fortune 500 HQ in CA)
| Industry | F500 HQs | Revenue |
|---|---|---|
| Technology | 27 | $1,492B |
|
||
| Financial Services | 3 | $174B |
|
||
| Retail | 3 | $44B |
|
||
| Insurance | 3 | $26B |
|
||
| Media / Entertainment | 2 | $115B |
|
||
| Pharmaceuticals / Biotech | 2 | $62B |
|
||
Price history
-99.0% since first listed2 events — show timeline
- 2026-05-30 Listed for Rent $1,960 CRMLS
- 2026-05-05 Listed $199,000 CRMLS
Cash-flow waterfall
monthlySold comps — $/sqft
last 12 mo · ≤1 miLoading sold comps…