 🏗️ New Construction
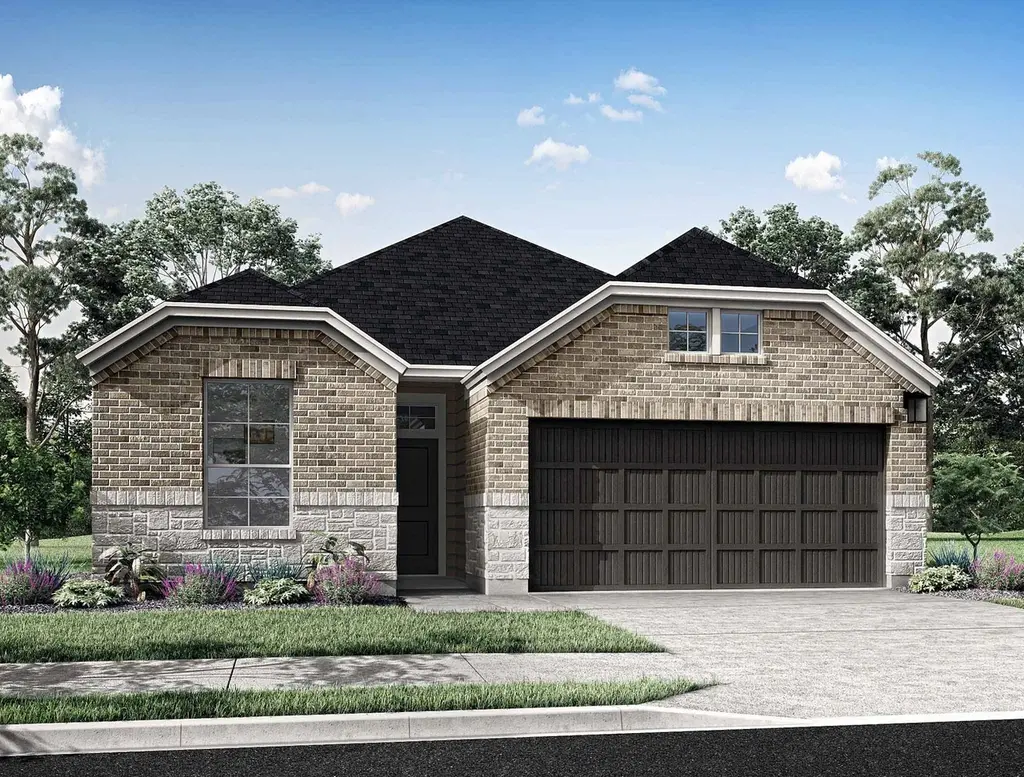
8007 Orchid Greenery Dr · Houston, TX
Flood risk 4/10 · Minor
- FEMA flood zone
- X (unshaded)
- Chance of flooding over 30 yrs
- 0.2%
- Est. flood insurance / yr
- $507 – $1,088
Fire risk 4/10 · Minor
- Est. fire insurance / yr
- $1,222 – $2,270
Heat risk 9/10 · Severe
- Hot days now (above 110°F)
- 7 days/yr
- Hot days in 30 yrs
- 22 days/yr
Wind risk 9/10 · Severe
- Chance of severe wind over 30 yrs
- 99.0%
Air-quality risk 2/10 · Minimal
- Unhealthy air days now
- 2 days/yr
- Unhealthy air days in 30 yrs
- 2 days/yr
Risk factors via First Street. Map © Google.
Why this score? — see what drove the D- grade
The composite is a weighted blend of 9 inputs, each scored 0–100. Each bar is that input's sub-score; the figure is the points it added to the 100-point composite (weight × sub-score).
- Cash flow +10.7/30.0
- ARV discount +7.5/15.0
- Schools +4.4/10.0
- Condition / age +4.0/5.0
- Livability +3.7/5.0
- 1% rule +3.4/10.0
- DSCR +3.1/10.0
- Rent growth +2.2/5.0
- Appreciation +0.0/10.0
$316,760
🖨 Deal sheet 📄 Offer letter ✓ Due diligence
Listing remarks
One-Story; 4 /2 This home offers a welcoming layout where the kitchen, dining area, and great room connect in a bright, comfortable way that feels easy to live in day to day. Architectural touches like the coffered great room ceiling and covered patio give the main living spaces extra presence, while the private primary suite and secondary bedrooms keep the home practical and well balanced. Altogether, the design feels polished, efficient, and well suited for both everyday routines and casual entertaining. MASON WOODS by Tri Pointe Homes is your oasis of luxury living and community. Amenities include a Recreation Center, Fitness Center, Resort-style pool, miles of trails, Central playgroun
Key facts
- Covered patio
- Sparkling lakes
- Resort-style pool
Tags
Property features AI
Finance
- Other: Association pool; Municipal Utility District disclosure
- HOA & community: Association: Crest Managment; Annual association fee; Association amenities: fitness center, playground, pool, trails; Community pool; Curbs
Exterior
- Parking: Attached garage; 2 garage spaces
- Security: Owned security system; Smoke detectors
- Utilities: Public water; Public sewer
- Home design: Residential property; Under construction (new construction); Slab foundation; Composition roof; Built in 2026; Concrete road access; Lot in a subdivision
- Construction: Brick construction; Built by Tri Pointe Homes
- Exterior features: Covered patio; Patio; Private yard; Deck
Interior
- Kitchen: Dishwasher; Disposal; Gas range; Microwave
- Bedrooms: 5 total rooms
- Flooring: Carpet; Plank; Tile; Vinyl
- Bathrooms: 2 full bathrooms
- Heating & cooling: Central heating (gas); Central electric air conditioning; Has heating; Has cooling; Radiant attic barrier (energy efficient)
- Interior features: Breakfast bar; Double vanity; Granite counters; High ceilings; Kitchen island; Kitchen/family room combo; Pantry; Separate shower; Tub with shower; Low emissivity windows
- Laundry & utility: Washer hookup; Electric dryer hookup; Gas dryer hookup
Neighborhood map
What this means for you Summary
Snapshot
- This is a 4-bed/2.0-bath single-family listed at $317k. Condition is rated good.
Deal economics
- At list price, monthly cash flow is $-153 ($-2k/yr) — negative.
- To cash-flow at today's rent, offer at most $298k (6.0% below list).
- To meet the 1% rule (rent ≥ 1% of price), the offer needs to be $270k (14.9% below list).
- Recommended offer: $270k (14.9% below list) — sets the bar for 1% rule.
- Cap rate 5.7% vs local median 3.2% in Houston — top-decile yield for the area; either an underpriced asset or a hidden risk that comps aren't pricing in. Stress-test before assuming the spread holds.
Location & tenants
- Location reads 74/100 on livability (#184 in TX, #4,771 nationally) — a middle-class / working-renter tenant base. Strengths: amenities A+, cost of living A+, housing A+; Watch: crime F.
- Cypress-Fairbanks ISD (suburban): math 45% / reading 52% proficiency, ranked #161 of 826 in TX (top 20%) — families likely to look elsewhere, expect single-tenant / working-renter base with shorter leases.
- Zoned schools: Rowe Middle (math 26% / reading 44%, grade F, #842 of 1,662 statewide, top 51%, 1,310 students, 80% FRL); Cypress Park H S (math 41% / reading 49%, grade D-, #643 of 1,632 statewide, top 40%, 2,960 students, 75% FRL) — zoned schools average 78% FRL vs 43% district-wide (35 pts higher); higher-poverty schools than district average — tighter screening recommended.
- Market conditions: Rents soft (-1.3%/yr); 2034 active listings in the ZIP; 22 comparable units currently listed for rent nearby; rentals lingering (median 44d on market — plan ~5-8 weeks vacancy on turnover, expect pricing pressure); 86% of comp listings sitting > 30 days — soft ceiling on asking rent; high-income renter base; 29,883 units permitted in Harris County in 2024 (8,621 in 5+ unit buildings).
Forward outlook
- Local home prices are declining (-3.0%/yr); year-one equity from $2k of loan paydown is wiped out by about $10k of value loss. Plan a longer hold.
- Harris County population projected at +47% by 2050 — long-run rental-demand tailwind backs the buy-and-hold thesis.
Negotiation context
- It's been on market 41 days — a 3% lower offer ($307k) is reasonable based on typical stale-listing flexibility.
Risks & watch-outs
- Climate carrying-cost: severe wind risk, 99% chance of damaging wind over 30y; extreme-heat days projected 7→22/yr by 2055 (HVAC capex compounding) — expect insurance premiums to compound above CPI over the hold.
Questions for the listing agent
- What do current leases actually rent for vs. the listed asking? Can we see a recent rent roll and the last 12 months of T-12 income?
- It's been on market 41 days. Have you received any prior offers? Is the seller open to a 15% concession, seller financing, or rate buy-down credit?
- What does the HOA fee cover, when was the last increase, and are there any pending special assessments or reserve-fund shortfalls?
- Is there a deadline driving the sale (1031 exchange, divorce, estate, relocation)? That informs how much negotiation room exists.
- Schools are D-rated, which usually means shorter tenancies and higher turnover. Who's the typical renter profile here, and what's been the actual vacancy rate?
- Crime grade is F in this area — have there been break-ins, vandalism, or insurance claims at this property in the last 3 years? What carrier currently insures it and at what premium?
- The area grade is low — what's the realistic commute time and amenity access for the typical tenant pool here? Any planned neighborhood developments (good or bad) we should know about?
- What's the average days-on-market for RENTAL listings here right now (not sales)? A rising rental-DOM trend means longer vacancies and softer asking-rent achievability than the comps imply.
- What's the recent tenant-quality profile in this submarket — average credit score on applications, eviction rate, late-payment / NSF rate, and stable-employment percentage? A property-management company in the area should have these aggregated.
- How much new for-sale + rental construction is in the pipeline within 1–3 miles? Heavy new supply typically softens prices + rents 12–24 months out; constrained supply supports both.
Investment metrics
- 1% rule
- 0.84% ✗
- Cap rate
- 5.72%
- Cash-on-cash
- -2.05%
- DSCR
- 0.91
- GRM
- 9.9
CMA / ARV
- ARV (median comp)
- $319,909
- List price
- $316,760
- Delta
- -0.98%
- Verdict
- FAIR
- Comps
- 20 within 1.0 mi
Show comp detail 12 sales within ~0.75 mi
| Address | Dist | Beds/Ba | Sqft | Sold | Price | $/sf | Match |
|---|---|---|---|---|---|---|---|
| 21807 Honey Scent Ln | 0.13mi | 4/2.0 | 1,840 (0%) | 1mo | $334,935 | $182 | 93 |
| 7846 Summer Solstice St | 0.22mi | 4/2.0 | 1,850 (+0%) | 0mo | $337,290 | $182 | 88 |
| 8122 Kay Harbor Dr | 0.27mi | 4/2.0 | 1,744 (-5%) | 0mo | $346,990 | $199 | 79 |
| 8214 Blue Shell Ln | 0.30mi | 4/2.0 | 1,756 (-5%) | 0mo | $324,990 | $185 | 78 |
| 21815 Coral Mist Dr | 0.15mi | 4/2.0 | 1,675 (-9%) | 1mo | $309,138 | $185 | 78 |
| 21822 Black Tulip Ln | 0.12mi | 3/2.0 (-1) | 1,631 (-11%) | 1mo | $309,605 | $190 | 70 |
| 8218 Blue Shell Ln | 0.31mi | 3/2.0 (-1) | 1,673 (-9%) | 1mo | $340,990 | $204 | 65 |
| 21815 Canyon Moon Ln | 0.31mi | 4/3.0 | 2,016 (+10%) | 1mo | $362,890 | $180 | 65 |
| 7919 Sunny Lily Loop | 0.24mi | 3/2.0 (-1) | 1,622 (-12%) | 1mo | $319,925 | $197 | 63 |
| 21918 Mystic Birch Ln | 0.40mi | 4/2.5 | 2,023 (+10%) | 0mo | $367,065 | $181 | 63 |
| 21910 Mystic Birch Ln | 0.40mi | 4/2.5 | 2,023 (+10%) | 1mo | $378,825 | $187 | 62 |
| 21722 Redwood Bluff Trl | 0.67mi | 4/3.0 | 2,023 (+10%) | 1mo | $374,890 | $185 | 48 |
Match score weights: distance 35% · size 25% · config 20% · recency 20%. Top-matched comps best support the ARV.
Projected returns pro-forma
-3.0% appreciation · 0.0% rent growth · sell at horizon
- IRR
- -23.2%
- Equity multiple
- 0.23×
- Total profit
- $-69,379
- Equity at exit
- $47,699
- IRR
- -29.1%
- Equity multiple
- -0.15×
- Total profit
- $-103,118
- Equity at exit
- $27,660
Cash invested: $89,574 (down + closing). Projections, not guarantees.
Landlord ↔ Tenant lean methodology
- Overall (STATE)
- 87 Strongly Landlord-Friendly
- State Texas
- 87 Strongly Landlord-Friendly · R+5
- County
- — inherits STATE
- City
- — inherits STATE
ZIP-level market 77433
- Home prices YoY
- -28.5%
- Rents YoY
- -1.3%
- Active inventory
- 2034
- Price-to-rent
- 9.8×
Monthly cashflow live
- Estimated rent
- $2,695 high interval (Pro) →
- Mortgage (P&I)
- −$1,678
- Tax est. 1.5%
- −$400 /mo · $4,799/yr
- Insurance
- −$133
- HOA
- −$71
- Vacancy / Maint / Mgmt
- −$566
- Net cashflow
- $-153
Break-even live
UW: 25.0% down · 7.5% · 30yr · 1.5% tax · 5.0% vac · 8.0% maint · 8.0% mgmt
Financing live
Cash to close
- Down payment
- $79,977
- Closing costs
- $9,597
- Reserves months
- —
- Total cash needed
- —
Loan-product check · same deal, 3 products live
Conventional
25% down · 7.5% · 30yr
- Down + closing
- —
- Monthly P&I
- —
- Monthly cashflow
- —
- DSCR
- —
- Eligible?
- —
Personal DTI + credit; lowest rate.
DSCR
20% down · 8.5% · 30yr
- Down + closing
- —
- Monthly P&I
- —
- Monthly cashflow
- —
- DSCR
- —
- Eligible?
- —
No personal income docs; deal must DSCR.
Hard money
10% down · 12.0% · 12mo
- Down + closing
- —
- Monthly P&I
- —
- Monthly cashflow
- —
- DSCR
- —
- Eligible?
- —
Short-term bridge; refi at stabilization.
Rent comps 22 comps
| Address | Beds | Baths | Sqft | Rent | $/sqft | DOM | Units | Dist |
|---|---|---|---|---|---|---|---|---|
| 7911 Tuscan Cypress Dr Cypress, TX | 4.0 | 3.0 | 1730 | $2,475 | $1.43 | 44d | 1 | 0.59mi |
| 7558 Magnolia Orchid Ln Cypress, TX | 4.0 | 2.5 | 1743 | $2,390 | $1.37 | 44d | 1 | 0.60mi |
| 7546 Coral Terrace Dr Cypress, TX | 3.0 | 2.5 | 2050 | $2,699 | $1.32 | 44d | 1 | 0.89mi |
| 21114 Montego Bay Dr Cypress, TX | 3.0 | 2.5 | 2124 | $2,499 | $1.18 | 44d | 1 | 0.99mi |
| 21054 Montego Breeze Ln Cypress, TX | 3.0–5.0 | 2.0–3.5 | 1935 | $2,622 | $1.35 | 13d | 21 | 1.08mi |
| 21235 Catalina Palm Dr Cypress, TX | 4.0 | 2.0 | 1756 | $2,600 | $1.48 | 44d | 1 | 1.10mi |
| 21046 Treasure Gate Ln Cypress, TX | 4.0 | 2.5 | 2489 | $3,045 | $1.22 | 44d | 1 | 1.10mi |
| 21047 Treasure Gate Ln Cypress, TX | 5.0 | 3.0 | 2461 | $2,953 | $1.20 | 44d | 1 | 1.10mi |
| 21038 Treasure Gate Ln Cypress, TX | 4.0 | 2.5 | 1804 | $2,676 | $1.48 | 44d | 1 | 1.12mi |
| 21034 Montego Breeze Ln Cypress, TX | 5.0 | 3.0 | 2461 | $2,861 | $1.16 | 44d | 1 | 1.13mi |
| 21014 Montego Breeze Ln Cypress, TX | 4.0 | 2.5 | 2489 | $2,953 | $1.19 | 44d | 1 | 1.17mi |
| 21010 Treasure Gate Ln Cypress, TX | 4.0 | 2.0 | 2157 | $2,768 | $1.28 | 44d | 1 | 1.18mi |
| 21447 FM 529 Rd Cypress, TX | 1.0–3.0 | 1.0–2.0 | 996 | $2,205 | $2.21 | 3d | 26 | 1.21mi |
| 21031 Sandestin Ridge Dr Cypress, TX | 5.0 | 3.5 | 2099 | $2,861 | $1.36 | 44d | 1 | 1.23mi |
| 21034 Shore Oak Dr Cypress, TX | 4.0 | 3.0 | 2110 | $2,950 | $1.40 | 44d | 1 | 1.25mi |
| 21454 Bluebonnet Cove Ct Katy, TX | 4.0 | 2.5 | 2320 | $2,600 | $1.12 | 44d | 1 | 1.27mi |
| 21038 Bay Village Dr Cypress, TX | 4.0 | 2.5 | 1904 | $2,491 | $1.31 | 44d | 1 | 1.28mi |
| 21815 Sunshine Cove Ln Cypress, TX | 3.0 | 2.0 | 1780 | $2,650 | $1.49 | 44d | 1 | 1.30mi |
| 21415 Bluebonnet Cove Ct Katy, TX | 4.0 | 2.5 | 2514 | $3,000 | $1.19 | 44d | 1 | 1.34mi |
| 21054 Breezeway Cove Dr Bridgeland, TX | 3.0–4.0 | 2.5–3.5 | 1784 | $3,258 | $1.83 | 3d | 41 | 1.36mi |
| 7310 Coconut Bay Dr Cypress, TX | 4.0 | 2.0 | 1620 | $2,307 | $1.42 | 44d | 1 | 1.38mi |
| 6747 Scarlet Sagebrush St Katy, TX | 3.0 | 2.0 | 1530 | $2,300 | $1.50 | 44d | 1 | 1.50mi |
HOA detail
- Monthly dues
- $71 · $852/yr
- Likely covers
- poolgym
Listing history 8 events
-
2026-06-08statusdays on market $316,760 Pending 41 DOM
-
2026-06-07days on market $316,760 Active 40 DOM
-
2026-06-04days on market $316,760 Active 37 DOM
-
2026-06-03days on market $316,760 Active 36 DOM
-
2026-06-02days on market $316,760 Active 35 DOM
-
2026-06-02days on market $316,760 Active 34 DOM
-
2026-05-31days on market $316,760 Active 33 DOM
-
2026-04-28$366,760 Active 818-char remark
ⓘ Source: listings_history table (triggers on properties + properties_extension) + one-shot
backfill from property_details.listing_events for pre-trigger history.
Climate risk First Street
- Flood 4/10 Moderate FEMA zone X (unshaded) · 20% chance over 30 yrs
- Wildfire 4/10 Moderate
- Heat 9/10 Extreme 7 d/yr ≥110°F today · 22 d/yr by 30 yrs out
- Wind 9/10 Extreme 99% chance of damaging wind over 30 yrs
- Air quality 2/10 Low 2 unhealthy d/yr today · 2 by 30 yrs out
Nearby sold comps map
Loading sold comps map…
Walkable amenities ~0.75 mi
Loading nearby amenities…
Taxation est. · year 1
- Rental income
- $32,341
- − Mortgage interest
- −$17,920
- − Property taxes
- −$4,799
- − Insurance
- −$1,600
- − Repairs & maintenance
- −$2,587
- − Management
- −$2,587
- − HOA
- −$852
- − Depreciation
- −$9,306
- Taxable loss
- −$7,310
- Est. tax savings @ 24.0%
- +$1,754
- After-tax cash flow
- $-78/yr
For passive investors: Depreciation is non-cash, so a rental often shows a tax loss while cash-flowing — sheltering income. Rental losses are passive: they offset passive income freely, and up to $25,000/yr can offset ordinary (W-2) income if you actively participate and your MAGI is under $100k (phasing out to $0 by $150k); unused losses carry forward. On sale, claimed depreciation is recaptured at up to 25%, and gains may owe capital-gains tax (a 1031 exchange can defer both). Figures are a year-1 estimate at your 24.0% rate — not tax advice; consult a CPA.
Condition & rehab AI · 6 photos
This single-story home offers a modern and well-maintained interior with a good condition score. It is move-in ready with minor maintenance items to address. The home's curb appeal and interior design make it an attractive option for both resale and rental markets.
Value-add opportunities
- Resale Paint exterior trim — Enhances curb appeal and adds a fresh look.
- Rental Replace window screens — Improves comfort and energy efficiency for tenants.
Renovation cost estimate screening
Value-add ROI direction
- Resale Paint exterior trim — Enhances curb appeal and adds a fresh look. ↑
- Rental Replace window screens — Improves comfort and energy efficiency for tenants. ↑
ⓘ Cost ranges are severity-bucket heuristics (US national rule-of-thumb). Get contractor quotes + a written scope before underwriting a rehab budget.
Schools (NCES district)
- District
- Cypress-Fairbanks ISD
- NCES district ID
- 4816110
- Math proficiency
- 45% ▼ -12.00%
- Reading proficiency
- 52% ▼ -2.00%
- Median HH income
- $72,025
- Composite
- 43.63/100
- National rank
- #2968
- State rank
- #161 of 826 in TX
Livability — Houston
- Score
- 74/100
- State rank
- #184
- US rank
- #4771
Category grades
Schools grade is shown separately in the Schools card above.
Census & demographics
- County
- Harris County · 4,702,590 people
- City population
- 3,226,434
- Metro
- Houston-The Woodlands-Sugar Land, TX
- Population (ZIP)
- 116,550
- Household income
- $143,934
- Rent vs Own
- Severe rent burden
- 1700.0
Population outlook (Harris County) Hauer SSP2
- Today (2025)
- 5,571,493 people
- By 2030
- 6,089,821 · +9.3%
- By 2040
- 7,142,806 · +28.2%
- By 2050
- 8,185,864 · +46.9%
- By 2075
- 10,574,329 · +89.8%
- By 2100
- 12,109,958 · +117.4%
Race, ethnicity, and origin ACS 2023
- Neighborhood character
- Highly diverse neighborhood (Simpson 0.73)
- Race & ethnicity
- White 39% Hispanic / Latino 27% Black 17% Two or more races 14% Asian 13%
- Hispanic origin (detail)
- Mexican 16%
- Common ancestry
- Lithuanian 2% Romanian 1% Italian 1%
- Foreign-born
- 21% · Canada, Vietnam, China
- Languages at home
- 66% English-only · Spanish 19% Other Indo-European 4% Vietnamese 4%
Political lean MEDSL · Harris
- 2024 margin
- Lean D (+5.5) · D 52.0% · R 46.4% · Other 1.6%
- 2008→2024 swing
- +3.9pp toward D · 2008: 1.6pp · 2024: 5.5pp
- All cycles
- 2024: D+5.5 2020: D+13.3 2016: D+12.4 2012: D+0.1 2008: D+1.6
Not yet ingested
- Civics
- —
Market trends
- HPI YoY
- ▼ -87.83%
- Current HPI
- 220.2136
- Rent YoY
- ▼ -1.27%
- Metro
- Houston-The Woodlands-Sugar Land, TX
- State GDP YoY
- ▲ 3.95%
- F500 in state
- 110
Industry mix (Fortune 500 HQ in TX)
| Industry | F500 HQs | Revenue |
|---|---|---|
| Energy | 16 | $1,198B |
|
||
| Technology | 5 | $198B |
|
||
| Engineering / Construction | 4 | $72B |
|
||
| Energy Services | 3 | $60B |
|
||
| Utilities | 3 | $41B |
|
||
| Healthcare | 2 | $330B |
|
||
Price history
-13.6% since first listed3 events — show timeline
- 2026-06-08 Pending — HARMLS
- 2026-05-28 Price Changed $316,760 HARMLS
- 2026-04-28 Listed $366,760 HARMLS
Cash-flow waterfall
monthlySold comps — $/sqft
last 12 mo · ≤1 miLoading sold comps…