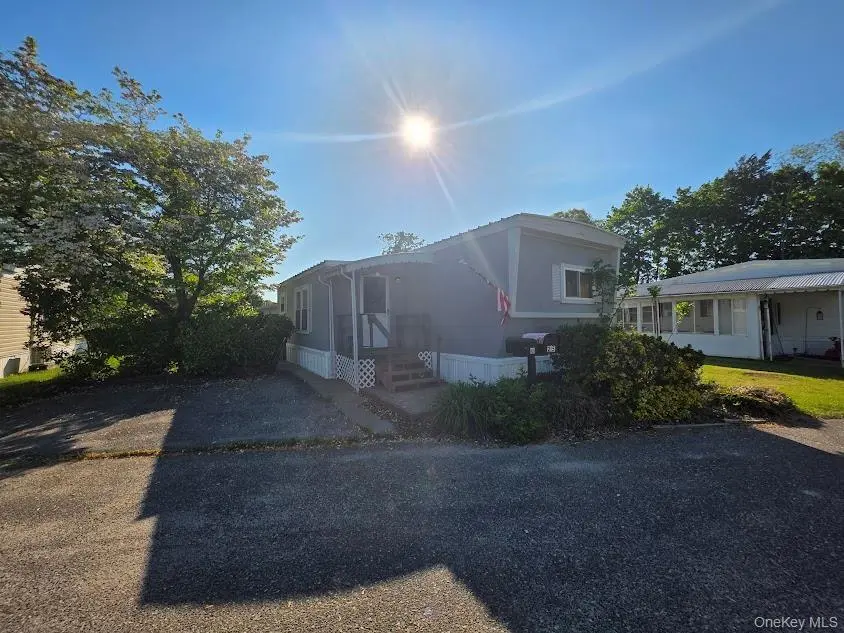
1964 River #57 · Calverton, NY
Flood risk No data
- FEMA flood zone
- —
- Chance of flooding over 30 yrs
- —
- Est. flood insurance / yr
- —
Fire risk No data
- Est. fire insurance / yr
- —
Heat risk No data
- Hot days now (above threshold)
- —
- Hot days in 30 yrs
- —
Wind risk No data
- Chance of severe wind over 30 yrs
- —
Air-quality risk No data
- Unhealthy air days now
- —
- Unhealthy air days in 30 yrs
- —
Risk factors via First Street. Map © Google.
Why this score? — see what drove the C- grade
The composite is a weighted blend of 9 inputs, each scored 0–100. Each bar is that input's sub-score; the figure is the points it added to the 100-point composite (weight × sub-score).
- Cash flow +15.0/30.0
- ARV discount +7.5/15.0
- Appreciation +6.6/10.0
- 1% rule +5.0/10.0
- DSCR +5.0/10.0
- Schools +3.6/10.0
- Livability +2.9/5.0
- Rent growth +2.5/5.0
- Condition / age +2.2/5.0
$79,995
🖨 Deal sheet 📄 Offer letter ✓ Due diligence
Listing remarks
Spacious 3-bedroom, 1.5-bath mobile home filled with charm, character, and endless potential! Offering generously sized bedrooms, bathrooms, and living spaces. This home features custom built-ins, abundant storage, and a warm inviting layout. Whether you're looking for a primary residence, investment opportunity, or a project to make your own, this property offers a fantastic foundation to bring your vision to life. Conveniently designed with plenty of room to spread out. This home is ready for its next owner to restore and personalize. Home is being sold strictly “as-is. ”
Key facts
- Custom built-ins
- Abundant storage
- Built 1969
Tags
Property features AI
Finance
- Other: Near public transit; Near shops; Located in a senior community
- HOA & community: Has association with monthly fee; Association fee covers sewer, snow removal, trash and other items
Exterior
- Parking: Driveway (no carport)
- Utilities: Electric service by PSEG; Cesspool sewer; Cable available; Electricity connected; Phone available; Sewer connected; Public trash collection; Water available
- Home design: Manufactured house / mobile home; Double wide; Single-story
- Construction: Block foundation
- Exterior features: Mailbox; Patio; Porch; Shed(s)
Interior
- Kitchen: Eat-in kitchen with breakfast bar; Dishwasher; Refrigerator
- Bedrooms: Bedrooms located on the main level
- Flooring: Carpet; Vinyl
- Bathrooms: 1 full bathroom; 1 half bathroom
- Heating & cooling: Central air; Heating: Other (see remarks)
- Interior features: First-floor bedroom; First-floor full bath; Breakfast bar; Built-in features; Eat-in kitchen; Original details; Primary bathroom; Master suite on main level; Washer/dryer hookup; Dining area
- Laundry & utility: Washer/dryer hookup in hall; Dryer included
Neighborhood map
What this means for you Summary
Snapshot
- This is a 3-bed/1.5-bath manufactured listed at $80k. Condition is rated fair.
Deal economics
- At list price, monthly cash flow is $1k ($13k/yr) — positive.
- The deal already cash-flows at list — no discount required.
- Meets the 1% rule at list price ($4k rent vs $80k).
- Recommended offer: $78k (3.0% below list) — sets the bar for market timing.
- Cap rate 22.7% vs local median 7.2% in Calverton — top-decile yield for the area; either an underpriced asset or a hidden risk that comps aren't pricing in. Stress-test before assuming the spread holds.
Location & tenants
- Location reads 58/100 on livability (#1,053 in NY) — a working-class tenant base; expect higher turnover. Watch: crime C-, employment D, amenities F.
- Riverhead Central School District (suburban): math 34% / reading 48% proficiency, ranked #489 of 590 in NY (top 83%) — families likely to look elsewhere, expect single-tenant / working-renter base with shorter leases.
- Zoned schools: Phillips Avenue School (math 17% / reading 32%, grade F, #1,846 of 2,108 statewide, top 91%, 578 students, 50% FRL); Riverhead Middle School (math 18% / reading 35%, grade F, #594 of 729 statewide, top 81%, 827 students, 57% FRL); Riverhead Senior High School (math 80% / reading 86%, grade A, #440 of 1,100 statewide, top 40%, 2,001 students, 52% FRL).
- Market conditions: 84 active listings in the ZIP; 1,366 units permitted in Suffolk County in 2024 (216 in 5+ unit buildings).
Forward outlook
- In year one you build about $3k of equity ($553 loan paydown + $3k appreciation (3.3% local appreciation)).
- Suffolk County population projected to shrink 5% by 2050 — rents likely to lag national; underwrite the cash flow, not the appreciation.
- At projected returns (3.3% appreciation + 3.0% rent growth), your $22k cash investment doubles in ~2 years — after that, you're playing with house money.
- By year 10, paydown + projected appreciation supports a ~$31k cash-out refi (75% LTV) — recoverable capital for the next deal without selling this one.
Negotiation context
- It's been on market 31 days — a 3% lower offer ($78k) is reasonable based on typical stale-listing flexibility.
Risks & watch-outs
- Watch-outs: HOA is 32% of rent.
Questions for the listing agent
- It's been on market 31 days. Have you received any prior offers? Is the seller open to a 3% concession, seller financing, or rate buy-down credit?
- Have any recent inspections been done? Can we get a copy of the seller's disclosures and any deferred-maintenance estimates?
- Built in 1969 — when were the roof, HVAC, electrical panel, plumbing, and water heater last replaced?
- What does the HOA fee cover, when was the last increase, and are there any pending special assessments or reserve-fund shortfalls?
- Is there a deadline driving the sale (1031 exchange, divorce, estate, relocation)? That informs how much negotiation room exists.
- Schools are D-rated, which usually means shorter tenancies and higher turnover. Who's the typical renter profile here, and what's been the actual vacancy rate?
- What's the average days-on-market for RENTAL listings here right now (not sales)? A rising rental-DOM trend means longer vacancies and softer asking-rent achievability than the comps imply.
- What's the recent tenant-quality profile in this submarket — average credit score on applications, eviction rate, late-payment / NSF rate, and stable-employment percentage? A property-management company in the area should have these aggregated.
- How much new for-sale + rental construction is in the pipeline within 1–3 miles? Heavy new supply typically softens prices + rents 12–24 months out; constrained supply supports both.
Investment metrics
- 1% rule
- 4.41% ✓
- Cap rate
- 22.74%
- Cash-on-cash
- 58.73%
- DSCR
- 3.61
- GRM
- 1.9
CMA / ARV
- ARV (on-the-fly)
- $79,920
- Comps found
- 1
Show comp detail 1 sale within ~0.75 mi
| Address | Dist | Beds/Ba | Sqft | Sold | Price | $/sf | Match |
|---|---|---|---|---|---|---|---|
| 658-F7 Sound Avenue Ave | 0.00mi | 2/1.0 (-1) | 720 (0%) | 9mo | $80,000 | $111 | 86 |
Match score weights: distance 35% · size 25% · config 20% · recency 20%. Top-matched comps best support the ARV.
Projected returns pro-forma
3.26% appreciation · 3.0% rent growth · sell at horizon
- IRR
- 64.2%
- Equity multiple
- 4.63×
- Total profit
- $81,317
- Equity at exit
- $37,144
- IRR
- 63.7%
- Equity multiple
- 9.54×
- Total profit
- $191,317
- Equity at exit
- $58,174
Cash invested: $22,399 (down + closing). Projections, not guarantees.
Landlord ↔ Tenant lean methodology
- Overall (STATE)
- 15 Strongly Tenant-Friendly
- State New York
- 15 Strongly Tenant-Friendly · D+10
- County
- — inherits STATE
- City
- — inherits STATE
ZIP-level market 11933
- Home prices YoY
- 0.8%
- Active inventory
- 84
- Price-to-rent
- 1.9×
Monthly cashflow live
- Estimated rent
- $3,528 medium interval (Pro) →
- Mortgage (P&I)
- −$420
- Tax est. 1.5%
- −$100 /mo · $1,200/yr
- Insurance
- −$33
- HOA
- −$1,138
- Vacancy / Maint / Mgmt
- −$741
- Net cashflow
- $1,096
Break-even live
UW: 25.0% down · 7.5% · 30yr · 1.5% tax · 5.0% vac · 8.0% maint · 8.0% mgmt
Financing live
Cash to close
- Down payment
- $19,999
- Closing costs
- $2,400
- Reserves months
- —
- Total cash needed
- —
Loan-product check · same deal, 3 products live
Conventional
25% down · 7.5% · 30yr
- Down + closing
- —
- Monthly P&I
- —
- Monthly cashflow
- —
- DSCR
- —
- Eligible?
- —
Personal DTI + credit; lowest rate.
DSCR
20% down · 8.5% · 30yr
- Down + closing
- —
- Monthly P&I
- —
- Monthly cashflow
- —
- DSCR
- —
- Eligible?
- —
No personal income docs; deal must DSCR.
Hard money
10% down · 12.0% · 12mo
- Down + closing
- —
- Monthly P&I
- —
- Monthly cashflow
- —
- DSCR
- —
- Eligible?
- —
Short-term bridge; refi at stabilization.
HOA detail
- Monthly dues
- $1,138 · $13,656/yr
Listing history 14 events
-
2026-06-18days on market $79,995 Active 31 DOM
-
2026-06-17days on market $79,995 Active 30 DOM
-
2026-06-16days on market $79,995 Active 29 DOM
-
2026-06-15days on market $79,995 Active 28 DOM
-
2026-06-13days on market $79,995 Active 26 DOM
-
2026-06-09days on market $79,995 Active 22 DOM
-
2026-06-08days on market $79,995 Active 21 DOM
-
2026-06-07days on market $79,995 Active 20 DOM
-
2026-06-04days on market $79,995 Active 17 DOM
-
2026-06-03days on market $79,995 Active 16 DOM
-
2026-06-02days on market $79,995 Active 15 DOM
-
2026-06-01days on market $79,995 Active 14 DOM
-
2026-05-31days on market $79,995 Active 13 DOM
-
2026-05-18$79,995 Active
ⓘ Source: listings_history table (triggers on properties + properties_extension) + one-shot
backfill from property_details.listing_events for pre-trigger history.
Nearby sold comps map
Loading sold comps map…
Walkable amenities ~0.75 mi
Loading nearby amenities…
Taxation est. · year 1
- Rental income
- $42,336
- − Mortgage interest
- −$4,481
- − Property taxes
- −$1,200
- − Insurance
- −$400
- − Repairs & maintenance
- −$3,387
- − Management
- −$3,387
- − HOA
- −$13,656
- − Depreciation
- −$2,327
- Taxable income
- $13,498
- Est. tax owed @ 24.0%
- −$3,240
- After-tax cash flow
- $9,916/yr
For passive investors: Depreciation is non-cash, so a rental often shows a tax loss while cash-flowing — sheltering income. Rental losses are passive: they offset passive income freely, and up to $25,000/yr can offset ordinary (W-2) income if you actively participate and your MAGI is under $100k (phasing out to $0 by $150k); unused losses carry forward. On sale, claimed depreciation is recaptured at up to 25%, and gains may owe capital-gains tax (a 1031 exchange can defer both). Figures are a year-1 estimate at your 24.0% rate — not tax advice; consult a CPA.
Condition & rehab AI · 13 photos
This 1964 manufactured home requires moderate repairs and updates to its exterior, interior, and landscaping to improve its condition and value.
Repairs flagged
- Major roof — Aerial view suggests significant damage.
- Moderate exterior siding — Weathered and faded appearance.
- Moderate paint — Faded paint on exterior and interior walls.
- Minor landscaping — Basic landscaping needs improvement.
- Minor bathroom fixtures — Dated appearance of bathroom fixtures.
- Minor flooring — Carpeted floors in living areas need updating.
Value-add opportunities
- Both Paint exterior and interior walls — Fresh paint enhances curb appeal and interior aesthetics.
- Both Replace carpeted flooring — New flooring improves living spaces and rental appeal.
- Both Landscaping and shrubbery maintenance — Improved landscaping enhances curb appeal and rental value.
- Both Replace dated bathroom fixtures — Modern fixtures improve functionality and rental appeal.
Renovation cost estimate screening
| Repair item | Severity | Est. cost |
|---|---|---|
| roof · Aerial view suggests significant damage. | Major | $15,000–50,000 |
| exterior siding · Weathered and faded appearance. | Moderate | $3,000–15,000 |
| paint · Faded paint on exterior and interior walls. | Moderate | $3,000–15,000 |
| landscaping · Basic landscaping needs improvement. | Minor | $500–3,000 |
| bathroom fixtures · Dated appearance of bathroom fixtures. | Minor | $500–3,000 |
| flooring · Carpeted floors in living areas need updating. | Minor | $500–3,000 |
| Total estimated repair cost · 6 items | $22,500–89,000 |
Value-add ROI direction
- Both Paint exterior and interior walls — Fresh paint enhances curb appeal and interior aesthetics. ↑
- Both Replace carpeted flooring — New flooring improves living spaces and rental appeal. ↑
- Both Landscaping and shrubbery maintenance — Improved landscaping enhances curb appeal and rental value. ↑
- Both Replace dated bathroom fixtures — Modern fixtures improve functionality and rental appeal. ↑
ⓘ Cost ranges are severity-bucket heuristics (US national rule-of-thumb). Get contractor quotes + a written scope before underwriting a rehab budget.
Schools (NCES district)
- District
- Riverhead Central School District
- NCES district ID
- 3624690
- Math proficiency
- 34% ▼ -4.00%
- Reading proficiency
- 48% ▲ 13.00%
- Median HH income
- $61,607
- Composite
- 36.38/100
- National rank
- #4683
- State rank
- #489 of 590 in NY
Livability — Calverton
- Score
- 58/100
- State rank
- #1053
- US rank
- #20908
Category grades
Schools grade is shown separately in the Schools card above.
Census & demographics
- Census place
- Calverton, NY
- City population
- 6,784
- Population (ZIP)
- 6,784
Population outlook (Suffolk County) Hauer SSP2
- Today (2025)
- 1,505,262 people
- By 2030
- 1,498,318 · -0.5%
- By 2040
- 1,471,101 · -2.3%
- By 2050
- 1,424,848 · -5.3%
- By 2075
- 1,337,157 · -11.2%
- By 2100
- 1,217,720 · -19.1%
Race, ethnicity, and origin ACS 2023
- Neighborhood character
- Predominantly White (79%)
- Race & ethnicity
- White 79% Hispanic / Latino 10% Black 8% Two or more races 2% Asian 1%
- Hispanic origin (detail)
- Puerto Rican 1% Dominican 4%
- Common ancestry
- Romanian 5% Lithuanian 3% Iranian 1%
- Foreign-born
- 11% · Canada, Jamaica, South Korea
- Languages at home
- 85% English-only · Spanish 10% Other Indo-European 3% German/W. Germanic 1%
Political lean MEDSL · Suffolk
- 2024 margin
- Lean R (+10.0) · D 45.0% · R 55.0%
- 2008→2024 swing
- -16.0pp toward R · 2008: 6.0pp · 2024: -10.0pp
- All cycles
- 2024: R+10.0 2020: R+0.0 2016: R+8.2 2012: D+2.9 2008: D+6.0
Not yet ingested
- Civics
- —
Market trends
- HPI YoY
- ▲ 3.26%
- Current HPI
- 397.7148
- Rent YoY
- —
- Metro
- —
- State GDP YoY
- ▲ 2.60%
- F500 in state
- 92
Industry mix (Fortune 500 HQ in NY)
| Industry | F500 HQs | Revenue |
|---|---|---|
| Financial Services | 10 | $950B |
|
||
| Consumer Goods | 9 | $162B |
|
||
| Insurance | 4 | $225B |
|
||
| Telecommunications | 2 | $144B |
|
||
| Pharmaceuticals | 2 | $112B |
|
||
| Media / Entertainment | 2 | $69B |
|
||
Price history
1 event — show timeline
- 2026-05-18 Listed $79,995 OneKey® MLS as Distributed by MLS Grid
Cash-flow waterfall
monthlySold comps — $/sqft
last 12 mo · ≤1 miLoading sold comps…