4500 Iroquois Dr · Thunderbird Bay, TX
Flood risk 1/10 · Minimal
- FEMA flood zone
- X (unshaded)
- Chance of flooding over 30 yrs
- 0.0%
- Est. flood insurance / yr
- $507 – $1,088
Fire risk 5/10 · Moderate
- Est. fire insurance / yr
- $1,222 – $2,270
Heat risk 7/10 · Major
- Hot days now (above 107°F)
- 7 days/yr
- Hot days in 30 yrs
- 23 days/yr
Wind risk 6/10 · Moderate
- Chance of severe wind over 30 yrs
- 27.0%
Air-quality risk 1/10 · Minimal
- Unhealthy air days now
- 0 days/yr
- Unhealthy air days in 30 yrs
- 0 days/yr
Risk factors via First Street. Map © Google.
Why this score? — see what drove the B grade
The composite is a weighted blend of 9 inputs, each scored 0–100. Each bar is that input's sub-score; the figure is the points it added to the 100-point composite (weight × sub-score).
- Cash flow +30.0/30.0
- 1% rule +10.0/10.0
- DSCR +10.0/10.0
- ARV discount +7.5/15.0
- Appreciation +5.1/10.0
- Schools +3.6/10.0
- Livability +2.9/5.0
- Rent growth +2.5/5.0
- Condition / age +2.5/5.0
$80,000
🖨 Deal sheet 📄 Offer letter ✓ Due diligence
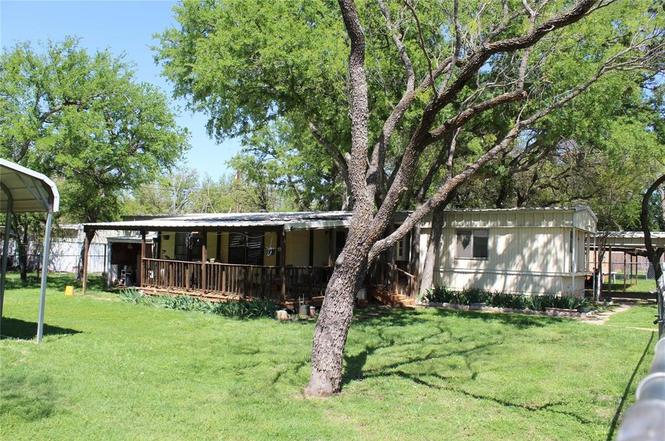
Listing remarks
This three-bedroom, two-bath single-wide home offers comfortable living on a spacious 0.379-acre property consisting of two large fenced lots. This setup provides ample room for outdoor activities, gardening, pets, or future expansions while maintaining privacy and security. The home features three bedrooms and is thoughtfully situated to maximize enjoyment of the surrounding lake lifestyle. Step outside to find plenty of covered parking, perfect for protecting vehicles, boats, or recreational gear from the Texas sun and occasional weather. One of the standout features is the great covered deck—an ideal spot for relaxing, grilling, or entertaining while soaking in the fresh air and su
Key facts
- Covered parking
- Great covered deck
- Community pool
Tags
Neighborhood map
What this means for you Summary
Snapshot
- This is a 3-bed/2.0-bath manufactured listed at $80k.
Deal economics
- At list price, monthly cash flow is $396 ($5k/yr) — positive.
- The deal already cash-flows at list — no discount required.
- Meets the 1% rule at list price ($1k rent vs $80k).
- Recommended offer: $73k (9.0% below list) — sets the bar for market timing.
- Cap rate 12.2% vs local median 4.0% in Thunderbird Bay — top-decile yield for the area; either an underpriced asset or a hidden risk that comps aren't pricing in. Stress-test before assuming the spread holds.
Location & tenants
- Location reads 57/100 on livability (#1,233 in TX) — a working-class tenant base; expect higher turnover. Strengths: cost of living A+, housing A+; Watch: health & safety D+, crime F, amenities F.
- May ISD (rural): math 35% / reading 45% proficiency, ranked #729 of 1,141 in TX (top 64%) — families likely to look elsewhere, expect single-tenant / working-renter base with shorter leases.
- Zoned schools: May El (math 32% / reading 32%, grade F, #2,268 of 4,322 statewide, top 55%, 120 students, 72% FRL) — zoned schools average 72% FRL vs 46% district-wide (26 pts higher); higher-poverty schools than district average — tighter screening recommended.
- Market conditions: 253 active listings in the ZIP; 142 units permitted in Brown County in 2024 (0 in 5+ unit buildings).
Forward outlook
- In year one you build about $664 of equity ($553 loan paydown + $111 appreciation (0.1% local appreciation)).
- At projected returns (0.1% appreciation + 3.0% rent growth), your $22k cash investment doubles in ~4 years — after that, you're playing with house money.
Negotiation context
- It's been on market 100 days — a 9% lower offer ($73k) is reasonable based on typical stale-listing flexibility.
- 4 sale attempts since 3y ago with the ask held roughly flat each time — persistent listings suggest the price (not the market) is what's stuck; bring a comps-based counter.
Risks & watch-outs
- Climate carrying-cost: major wind risk, 27% chance of damaging wind over 30y; moderate wildfire risk; extreme-heat days projected 7→23/yr by 2055 (HVAC capex compounding) — expect insurance premiums to compound above CPI over the hold.
Questions for the listing agent
- It's been on market 100 days. Have you received any prior offers? Is the seller open to a 9% concession, seller financing, or rate buy-down credit?
- Built in 1976 — when were the roof, HVAC, electrical panel, plumbing, and water heater last replaced?
- What does the HOA fee cover, when was the last increase, and are there any pending special assessments or reserve-fund shortfalls?
- Why hasn't it sold? Are there any deal-killer items the seller is aware of (foundation, flood, title, zoning, code violations)?
- Is there a deadline driving the sale (1031 exchange, divorce, estate, relocation)? That informs how much negotiation room exists.
- Schools are F-rated, which usually means shorter tenancies and higher turnover. Who's the typical renter profile here, and what's been the actual vacancy rate?
- Crime grade is F in this area — have there been break-ins, vandalism, or insurance claims at this property in the last 3 years? What carrier currently insures it and at what premium?
- What's the average days-on-market for RENTAL listings here right now (not sales)? A rising rental-DOM trend means longer vacancies and softer asking-rent achievability than the comps imply.
- What's the recent tenant-quality profile in this submarket — average credit score on applications, eviction rate, late-payment / NSF rate, and stable-employment percentage? A property-management company in the area should have these aggregated.
- How much new for-sale + rental construction is in the pipeline within 1–3 miles? Heavy new supply typically softens prices + rents 12–24 months out; constrained supply supports both.
Investment metrics
- 1% rule
- 1.50% ✓
- Cap rate
- 12.24%
- Cash-on-cash
- 21.23%
- DSCR
- 1.94
- GRM
- 5.6
CMA / ARV
- ARV (on-the-fly)
- $194,688
- Comps found
- 4
Show comp detail 4 sales within ~0.75 mi
| Address | Dist | Beds/Ba | Sqft | Sold | Price | $/sf | Match |
|---|---|---|---|---|---|---|---|
| 5110 Tamarack Dr | 0.14mi | 3/2.0 | 1,308 (-3%) | 2mo | $130,000 | $99 | 86 |
| 12060 Rosemary Ln | 0.52mi | 3/2.0 | 1,404 (+4%) | 22mo | $269,000 | $192 | 51 |
| 4300 Lake Shore Dr | 0.60mi | 3/2.0 | 1,456 (+8%) | 16mo | $210,000 | $144 | 46 |
| 3611 Bounding Main Dr | 0.62mi | 2/1.0 (-1) | 1,435 (+6%) | 11mo | $40,000 | $28 | 43 |
Match score weights: distance 35% · size 25% · config 20% · recency 20%. Top-matched comps best support the ARV.
Projected returns pro-forma
0.14% appreciation · 3.0% rent growth · sell at horizon
- IRR
- 21.5%
- Equity multiple
- 2.05×
- Total profit
- $23,439
- Equity at exit
- $23,785
- IRR
- 25.4%
- Equity multiple
- 3.86×
- Total profit
- $64,064
- Equity at exit
- $29,039
Cash invested: $22,400 (down + closing). Projections, not guarantees.
Landlord ↔ Tenant lean methodology
- Overall (STATE)
- 87 Strongly Landlord-Friendly
- State Texas
- 87 Strongly Landlord-Friendly · R+5
- County
- — inherits STATE
- City
- — inherits STATE
ZIP-level market 76857
- Home prices YoY
- 0.1%
- Active inventory
- 253
- Price-to-rent
- 5.6×
Monthly cashflow live
- Estimated rent
- $1,197 medium interval (Pro) →
- Mortgage (P&I)
- −$420
- Tax from tax record
- −$75 /mo · $901/yr
- Insurance
- −$33
- HOA
- −$21
- Vacancy / Maint / Mgmt
- −$251
- Net cashflow
- $396
Break-even live
UW: 25.0% down · 7.5% · 30yr · 1.5% tax · 5.0% vac · 8.0% maint · 8.0% mgmt
Financing live
Cash to close
- Down payment
- $20,000
- Closing costs
- $2,400
- Reserves months
- —
- Total cash needed
- —
Loan-product check · same deal, 3 products live
Conventional
25% down · 7.5% · 30yr
- Down + closing
- —
- Monthly P&I
- —
- Monthly cashflow
- —
- DSCR
- —
- Eligible?
- —
Personal DTI + credit; lowest rate.
DSCR
20% down · 8.5% · 30yr
- Down + closing
- —
- Monthly P&I
- —
- Monthly cashflow
- —
- DSCR
- —
- Eligible?
- —
No personal income docs; deal must DSCR.
Hard money
10% down · 12.0% · 12mo
- Down + closing
- —
- Monthly P&I
- —
- Monthly cashflow
- —
- DSCR
- —
- Eligible?
- —
Short-term bridge; refi at stabilization.
HOA detail
- Monthly dues
- $21 · $252/yr
- Likely covers
- security
Listing history 11 events
-
2026-04-24status Pending
-
2026-04-10historical Active Option Contract
-
2026-01-14$80,000 Active
-
2025-12-19historical
-
2025-08-15price $95,900
-
2025-06-17price $109,000
-
2025-04-22$119,000 Active
-
2024-04-30historical
-
2023-10-06$100,000 Active
-
2023-10-01historical
-
2023-04-04$114,900 Active
ⓘ Source: listings_history table (triggers on properties + properties_extension) + one-shot
backfill from property_details.listing_events for pre-trigger history.
Tax reassessment forecast TX · Resets to sale price
- Current annual tax
- $901 · $75/mo
- Projected year-2 tax
- $1,464 · $122/mo
- Expected delta
- +$563/yr (+$47/mo · 62.5%)
ⓘ Screening estimate from a state-policy table — verify with the county assessor before closing.
Climate risk First Street
- Flood 1/10 Low FEMA zone X (unshaded) · 0% chance over 30 yrs
- Wildfire 5/10 Major
- Heat 7/10 Severe 7 d/yr ≥107°F today · 23 d/yr by 30 yrs out
- Wind 6/10 Major 27% chance of damaging wind over 30 yrs
- Air quality 1/10 Low 0 unhealthy d/yr today · 0 by 30 yrs out
Nearby sold comps map
Loading sold comps map…
Walkable amenities ~0.75 mi
Loading nearby amenities…
Taxation est. · year 1
- Rental income
- $14,358
- − Mortgage interest
- −$4,481
- − Property taxes
- −$901
- − Insurance
- −$400
- − Repairs & maintenance
- −$1,149
- − Management
- −$1,149
- − HOA
- −$252
- − Depreciation
- −$2,327
- Taxable income
- $3,699
- Est. tax owed @ 24.0%
- −$888
- After-tax cash flow
- $3,868/yr
For passive investors: Depreciation is non-cash, so a rental often shows a tax loss while cash-flowing — sheltering income. Rental losses are passive: they offset passive income freely, and up to $25,000/yr can offset ordinary (W-2) income if you actively participate and your MAGI is under $100k (phasing out to $0 by $150k); unused losses carry forward. On sale, claimed depreciation is recaptured at up to 25%, and gains may owe capital-gains tax (a 1031 exchange can defer both). Figures are a year-1 estimate at your 24.0% rate — not tax advice; consult a CPA.
Schools (NCES district)
- District
- May ISD
- NCES district ID
- 4829520
- Math proficiency
- 35% ▬ 0.00%
- Reading proficiency
- 45% ▲ 10.00%
- Median HH income
- $43,809
- Composite
- 36.31/100
- National rank
- #9397
- State rank
- #729 of 1141 in TX
Livability — Thunderbird Bay
- Score
- 57/100
- State rank
- #1233
- US rank
- #21564
Category grades
Schools grade is shown separately in the Schools card above.
Census & demographics
- Census place
- Thunderbird Bay, TX
- Population (ZIP)
- 2,118
Population outlook (Brown County) Hauer SSP2
- Today (2025)
- 38,381 people
- By 2030
- 38,288 · -0.2%
- By 2040
- 38,120 · -0.7%
- By 2050
- 38,227 · -0.4%
- By 2075
- 39,362 · +2.6%
- By 2100
- 39,171 · +2.1%
Race, ethnicity, and origin ACS 2023
- Neighborhood character
- Predominantly White (80%)
- Race & ethnicity
- White 80% Hispanic / Latino 17% Two or more races 14%
- Hispanic origin (detail)
- Mexican 12%
- Common ancestry
- Italian 9% Serbian 7% Slovak 6%
- Foreign-born
- 2% · Canada
- Languages at home
- 91% English-only · Spanish 9%
Political lean MEDSL · Brown
- 2024 margin
- Solid R (+73.9) · D 12.7% · R 86.6%
- 2008→2024 swing
- -12.5pp toward R · 2008: -61.5pp · 2024: -73.9pp
- All cycles
- 2024: R+73.9 2020: R+72.6 2016: R+74.5 2012: R+71.7 2008: R+61.5
Not yet ingested
- Civics
- —
Market trends
- HPI YoY
- ▲ 0.14%
- Current HPI
- 101.8877
- Rent YoY
- —
- Metro
- —
- State GDP YoY
- ▲ 3.95%
- F500 in state
- 110
Industry mix (Fortune 500 HQ in TX)
| Industry | F500 HQs | Revenue |
|---|---|---|
| Energy | 16 | $1,198B |
|
||
| Technology | 5 | $198B |
|
||
| Engineering / Construction | 4 | $72B |
|
||
| Energy Services | 3 | $60B |
|
||
| Utilities | 3 | $41B |
|
||
| Healthcare | 2 | $330B |
|
||
Price history
-30.4% since first listed11 events — show timeline
- 2026-04-24 Pending — NTREIS
- 2026-04-10 Contingent — NTREIS
- 2026-01-14 Listed $80,000 NTREIS
- 2025-12-19 Listing Removed — NTREIS
- 2025-08-15 Price Changed $95,900 NTREIS
- 2025-06-17 Price Changed $109,000 NTREIS
- 2025-04-22 Listed $119,000 NTREIS
- 2024-04-30 Listing Removed — NTREIS
- 2023-10-06 Listed $100,000 NTREIS
- 2023-10-01 Listing Removed — NTREIS
- 2023-04-04 Listed $114,900 NTREIS
Property tax history
+1.8%/yrLatest (2025): $901 · +8.3% YoY. Source: county tax records.
Cash-flow waterfall
monthlySold comps — $/sqft
last 12 mo · ≤1 miLoading sold comps…