150 Alston Pruitt Rd · Louisburg, NC
Flood risk 1/10 · Minimal
- FEMA flood zone
- X (unshaded)
- Chance of flooding over 30 yrs
- 0.0%
- Est. flood insurance / yr
- $507 – $1,088
Fire risk 4/10 · Minor
- Est. fire insurance / yr
- $906 – $1,684
Heat risk 6/10 · Moderate
- Hot days now (above 106°F)
- 7 days/yr
- Hot days in 30 yrs
- 16 days/yr
Wind risk 6/10 · Moderate
- Chance of severe wind over 30 yrs
- 50.0%
Air-quality risk 2/10 · Minimal
- Unhealthy air days now
- 1 days/yr
- Unhealthy air days in 30 yrs
- 1 days/yr
Risk factors via First Street. Map © Google.
Why this score? — see what drove the D grade
The composite is a weighted blend of 9 inputs, each scored 0–100. Each bar is that input's sub-score; the figure is the points it added to the 100-point composite (weight × sub-score).
- Cash flow +21.0/30.0
- DSCR +6.7/10.0
- 1% rule +4.5/10.0
- Livability +3.3/5.0
- Schools +3.0/10.0
- Rent growth +2.5/5.0
- Condition / age +2.5/5.0
- ARV discount +0.0/15.0
- Appreciation +0.0/10.0
$159,900
🖨 Deal sheet 📄 Offer letter ✓ Due diligence
Listing remarks
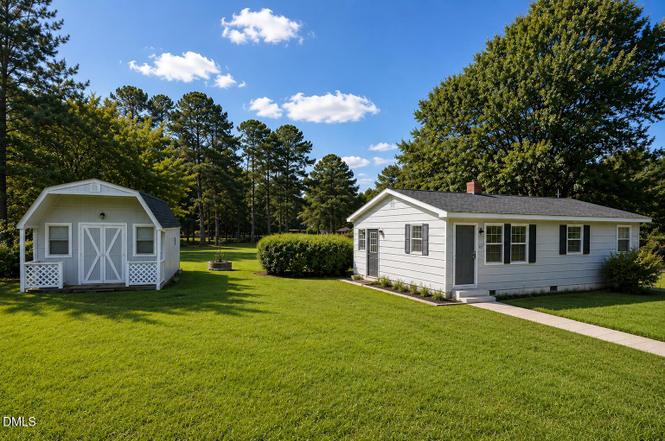
Freshly updated and beautifully staged to showcase the home's layout and potential, this move-in-ready home blends modern finishes with the peaceful feel of country living. Inside, you'll find brand new LVP flooring, fresh interior and exterior paint, updated lighting throughout, and a bright, refreshed kitchen designed for everyday comfort and functionality. Situated on a spacious lot, the property also features a large detached shed with power - ideal for a workshop, storage, hobby space, or additional flex use. Enjoy quiet surroundings while still being conveniently located near US-401 and NC-56, offering easy access to Louisburg, Wake Forest, and Raleigh, plus nearby shopping, dining, a
Key facts
- Spacious lot
- Refreshed kitchen
- 0.47 acre lot
Tags
Property features AI
Finance
- Other: Lot size approximately 0.47 acres
- HOA & community: No association
Exterior
- Parking: Driveway; 2 parking spaces
- Utilities: Well water; Septic tank
- Home design: Single-story house
- Construction: Wood siding; Architectural shingle roof; Block foundation; Built as a house
- Exterior features: Shed(s) on property; Publicly maintained road access
Interior
- Kitchen: Electric range; Refrigerator
- Bedrooms: 3 bedrooms (all on the main level)
- Flooring: Hardwood; Vinyl
- Bathrooms: 1 full bathroom
- Heating & cooling: Electric forced-air heating; Central air conditioning
- Interior features: Electric range; Refrigerator; Hardwood flooring; Vinyl flooring; Crawl space basement
Neighborhood map
What this means for you Summary
Snapshot
- This is a 3-bed/1.0-bath single-family listed at $160k.
Deal economics
- At list price, monthly cash flow is $225 ($3k/yr) — positive.
- The deal already cash-flows at list — no discount required.
- To meet the 1% rule (rent ≥ 1% of price), the offer needs to be $151k (5.3% below list).
- Recommended offer: $146k (9.0% below list) — sets the bar for market timing.
- Cap rate 8.0% vs local median 3.2% in Louisburg — top-decile yield for the area; either an underpriced asset or a hidden risk that comps aren't pricing in. Stress-test before assuming the spread holds.
Location & tenants
- Location reads 66/100 on livability (#289 in NC) — a middle-class / working-renter tenant base. Strengths: cost of living A+, housing A+, crime A; Watch: amenities F, commute F, employment F.
- Franklin County Schools (rural): math 34% / reading 37% proficiency, ranked #128 of 178 in NC (top 72%) — families likely to look elsewhere, expect single-tenant / working-renter base with shorter leases.
- Zoned schools: Terrell Lane Middle (math 26% / reading 34%, grade F, #335 of 475 statewide, top 72%, 395 students, 79% FRL) — zoned schools average 79% FRL vs 54% district-wide (25 pts higher); higher-poverty schools than district average — tighter screening recommended.
- Market conditions: 432 active listings in the ZIP; 948 units permitted in Franklin County in 2024 (0 in 5+ unit buildings).
Forward outlook
- Local home prices are declining (-3.0%/yr); year-one equity from $1k of loan paydown is wiped out by about $5k of value loss. Plan a longer hold.
- Franklin County population projected at +13% by 2050 — modest demand growth; plan on rents tracking national, not racing it.
Negotiation context
- It's been on market 112 days — a 9% lower offer ($146k) is reasonable based on typical stale-listing flexibility.
- 3 sale attempts; this cycle's ask has dropped $15k (9%) from the opening price — seller is motivated, your offer sets the floor, not the list.
- Current owner paid $125k; 28% above their basis — modest negotiation headroom, anchor on the comps not their cost.
Risks & watch-outs
- Climate carrying-cost: major wind risk, 50% chance of damaging wind over 30y; extreme-heat days projected 7→16/yr by 2055 (HVAC capex compounding) — expect insurance premiums to compound above CPI over the hold.
Questions for the listing agent
- It's been on market 112 days. Have you received any prior offers? Is the seller open to a 9% concession, seller financing, or rate buy-down credit?
- Built in 1970 — when were the roof, HVAC, electrical panel, plumbing, and water heater last replaced?
- Why hasn't it sold? Are there any deal-killer items the seller is aware of (foundation, flood, title, zoning, code violations)?
- Is there a deadline driving the sale (1031 exchange, divorce, estate, relocation)? That informs how much negotiation room exists.
- Schools are D-rated, which usually means shorter tenancies and higher turnover. Who's the typical renter profile here, and what's been the actual vacancy rate?
- The area grade is low — what's the realistic commute time and amenity access for the typical tenant pool here? Any planned neighborhood developments (good or bad) we should know about?
- What's the average days-on-market for RENTAL listings here right now (not sales)? A rising rental-DOM trend means longer vacancies and softer asking-rent achievability than the comps imply.
- What's the recent tenant-quality profile in this submarket — average credit score on applications, eviction rate, late-payment / NSF rate, and stable-employment percentage? A property-management company in the area should have these aggregated.
- How much new for-sale + rental construction is in the pipeline within 1–3 miles? Heavy new supply typically softens prices + rents 12–24 months out; constrained supply supports both.
Investment metrics
- 1% rule
- 0.95% ✗
- Cap rate
- 7.98%
- Cash-on-cash
- 6.04%
- DSCR
- 1.27
- GRM
- 8.8
CMA / ARV
- ARV (on-the-fly)
- $130,560
- Comps found
- 1
Show comp detail 1 sale within ~0.75 mi
| Address | Dist | Beds/Ba | Sqft | Sold | Price | $/sf | Match |
|---|---|---|---|---|---|---|---|
| 120 Hillard Rd | 0.70mi | 3/1.5 | 1,008 (+5%) | 5mo | $137,000 | $136 | 53 |
Match score weights: distance 35% · size 25% · config 20% · recency 20%. Top-matched comps best support the ARV.
Projected returns pro-forma
-3.0% appreciation · 3.0% rent growth · sell at horizon
- IRR
- -7.0%
- Equity multiple
- 0.74×
- Total profit
- $-11,614
- Equity at exit
- $23,842
- IRR
- 2.5%
- Equity multiple
- 1.18×
- Total profit
- $8,130
- Equity at exit
- $13,825
Cash invested: $44,772 (down + closing). Projections, not guarantees.
Landlord ↔ Tenant lean methodology
- Overall (STATE)
- 85 Strongly Landlord-Friendly
- State North Carolina
- 85 Strongly Landlord-Friendly · R+3
- County
- — inherits STATE
- City
- — inherits STATE
ZIP-level market 27549
- Home prices YoY
- -18.7%
- Active inventory
- 432
- Price-to-rent
- 8.8×
Monthly cashflow live
- Estimated rent
- $1,514 medium interval (Pro) →
- Mortgage (P&I)
- −$839
- Tax from tax record
- −$66 /mo · $787/yr
- Insurance
- −$67
- HOA
- −$0
- Vacancy / Maint / Mgmt
- −$318
- Net cashflow
- $225
Break-even live
UW: 25.0% down · 7.5% · 30yr · 1.5% tax · 5.0% vac · 8.0% maint · 8.0% mgmt
Financing live
Cash to close
- Down payment
- $39,975
- Closing costs
- $4,797
- Reserves months
- —
- Total cash needed
- —
Loan-product check · same deal, 3 products live
Conventional
25% down · 7.5% · 30yr
- Down + closing
- —
- Monthly P&I
- —
- Monthly cashflow
- —
- DSCR
- —
- Eligible?
- —
Personal DTI + credit; lowest rate.
DSCR
20% down · 8.5% · 30yr
- Down + closing
- —
- Monthly P&I
- —
- Monthly cashflow
- —
- DSCR
- —
- Eligible?
- —
No personal income docs; deal must DSCR.
Hard money
10% down · 12.0% · 12mo
- Down + closing
- —
- Monthly P&I
- —
- Monthly cashflow
- —
- DSCR
- —
- Eligible?
- —
Short-term bridge; refi at stabilization.
Listing history 15 events
-
2026-06-18days on market $159,900 Active 112 DOM
-
2026-06-17days on market $159,900 Active 111 DOM
-
2026-06-16days on market $159,900 Active 110 DOM
-
2026-06-15days on market $159,900 Active 109 DOM
-
2026-06-13days on market $159,900 Active 107 DOM
-
2026-06-12days on market $159,900 Active 106 DOM
-
2026-06-09days on market $159,900 Active 103 DOM
-
2026-06-08days on market $159,900 Active 102 DOM
-
2026-06-07days on market $159,900 Active 101 DOM
-
2026-06-07days on market $159,900 Active 100 DOM
-
2026-06-04days on market $159,900 Active 97 DOM
-
2026-06-02days on market $159,900 Active 96 DOM
-
2026-06-01days on market $159,900 Active 95 DOM
-
2026-05-31remarks 699-char remark
-
2026-05-31$159,900 Active 94 DOM
ⓘ Source: listings_history table (triggers on properties + properties_extension) + one-shot
backfill from property_details.listing_events for pre-trigger history.
Tax reassessment forecast NC · Resets to sale price
- Current annual tax
- $787 · $66/mo
- Projected year-2 tax
- $1,311 · $109/mo
- Expected delta
- +$524/yr (+$44/mo · 66.6%)
ⓘ Screening estimate from a state-policy table — verify with the county assessor before closing.
Climate risk First Street
- Flood 1/10 Low FEMA zone X (unshaded) · 0% chance over 30 yrs
- Wildfire 4/10 Moderate
- Heat 6/10 Major 7 d/yr ≥106°F today · 16 d/yr by 30 yrs out
- Wind 6/10 Major 50% chance of damaging wind over 30 yrs
- Air quality 2/10 Low 1 unhealthy d/yr today · 1 by 30 yrs out
Nearby sold comps map
Loading sold comps map…
Walkable amenities ~0.75 mi
Loading nearby amenities…
Taxation est. · year 1
- Rental income
- $18,169
- − Mortgage interest
- −$8,957
- − Property taxes
- −$787
- − Insurance
- −$800
- − Repairs & maintenance
- −$1,454
- − Management
- −$1,454
- − Depreciation
- −$4,652
- Taxable income
- $67
- Est. tax owed @ 24.0%
- −$16
- After-tax cash flow
- $2,689/yr
For passive investors: Depreciation is non-cash, so a rental often shows a tax loss while cash-flowing — sheltering income. Rental losses are passive: they offset passive income freely, and up to $25,000/yr can offset ordinary (W-2) income if you actively participate and your MAGI is under $100k (phasing out to $0 by $150k); unused losses carry forward. On sale, claimed depreciation is recaptured at up to 25%, and gains may owe capital-gains tax (a 1031 exchange can defer both). Figures are a year-1 estimate at your 24.0% rate — not tax advice; consult a CPA.
Schools (NCES district)
- District
- Franklin County Schools
- NCES district ID
- 3701530
- Math proficiency
- 34% ▬ 0.00%
- Reading proficiency
- 37% ▼ -4.00%
- Median HH income
- $44,630
- Composite
- 30.25/100
- National rank
- #6286
- State rank
- #128 of 178 in NC
Livability — Louisburg
- Score
- 66/100
- State rank
- #289
- US rank
- #12287
Category grades
Schools grade is shown separately in the Schools card above.
Census & demographics
- County
- Franklin County · 64,885 people
- City population
- 25,543
- Metro
- Raleigh-Cary, NC
- Population (ZIP)
- 25,543
- Household income
- $67,879
- Rent vs Own
- Severe rent burden
- 677.0
Population outlook (Franklin County) Hauer SSP2
- Today (2025)
- 69,848 people
- By 2030
- 72,480 · +3.8%
- By 2040
- 76,682 · +9.8%
- By 2050
- 78,993 · +13.1%
- By 2075
- 82,888 · +18.7%
- By 2100
- 80,784 · +15.7%
Race, ethnicity, and origin ACS 2023
- Neighborhood character
- Diverse neighborhood (Simpson 0.58)
- Race & ethnicity
- White 58% Black 25% Hispanic / Latino 13% Two or more races 5%
- Hispanic origin (detail)
- Mexican 10%
- Common ancestry
- Serbian 1% Italian 1% Slovak 1%
- Foreign-born
- 6% · Canada
- Languages at home
- 88% English-only · Spanish 10% German/W. Germanic 1%
Political lean MEDSL · Franklin
- 2024 margin
- R (+13.6) · D 42.7% · R 56.3%
- 2008→2024 swing
- -12.9pp toward R · 2008: -0.7pp · 2024: -13.6pp
- All cycles
- 2024: R+13.6 2020: R+13.4 2016: R+11.7 2012: R+4.2 2008: R+0.7
Not yet ingested
- Civics
- —
Market trends
- HPI YoY
- ▼ -52.02%
- Current HPI
- 225.8639
- Rent YoY
- —
- Metro
- Raleigh-Cary, NC
- State GDP YoY
- ▲ 3.28%
- F500 in state
- 26
Industry mix (Fortune 500 HQ in NC)
| Industry | F500 HQs | Revenue |
|---|---|---|
| Financial Services | 2 | $213B |
|
||
| Retail | 2 | $95B |
|
||
| Industrial Conglomerate | 1 | $38B |
|
||
| Metals / Steel | 1 | $35B |
|
||
| Utilities | 1 | $30B |
|
||
| Industrial Machinery | 1 | $19B |
|
||
Price history
+27.9% since first listed12 events — show timeline
- 2026-05-29 Price Changed $159,900 TMLS
- 2026-04-24 Relisted — TMLS
- 2026-04-02 Contingent — TMLS
- 2026-03-27 Price Changed $164,900 TMLS
- 2026-02-26 Listed $175,000 TMLS
- 2025-12-02 Listing Removed — TMLS
- 2025-09-25 Price Changed $150,000 TMLS
- 2025-08-29 Price Changed $164,000 TMLS
- 2025-08-23 Price Changed $165,000 TMLS
- 2025-08-06 Price Changed $170,000 TMLS
- 2025-07-05 Listed $175,000 TMLS
- 2025-06-12 Sold (Public Records) $125,000 Public Records
Property tax history
+1.4%/yrLatest (2025): $787 · +131.6% YoY. Source: county tax records.
Cash-flow waterfall
monthlySold comps — $/sqft
last 12 mo · ≤1 miLoading sold comps…