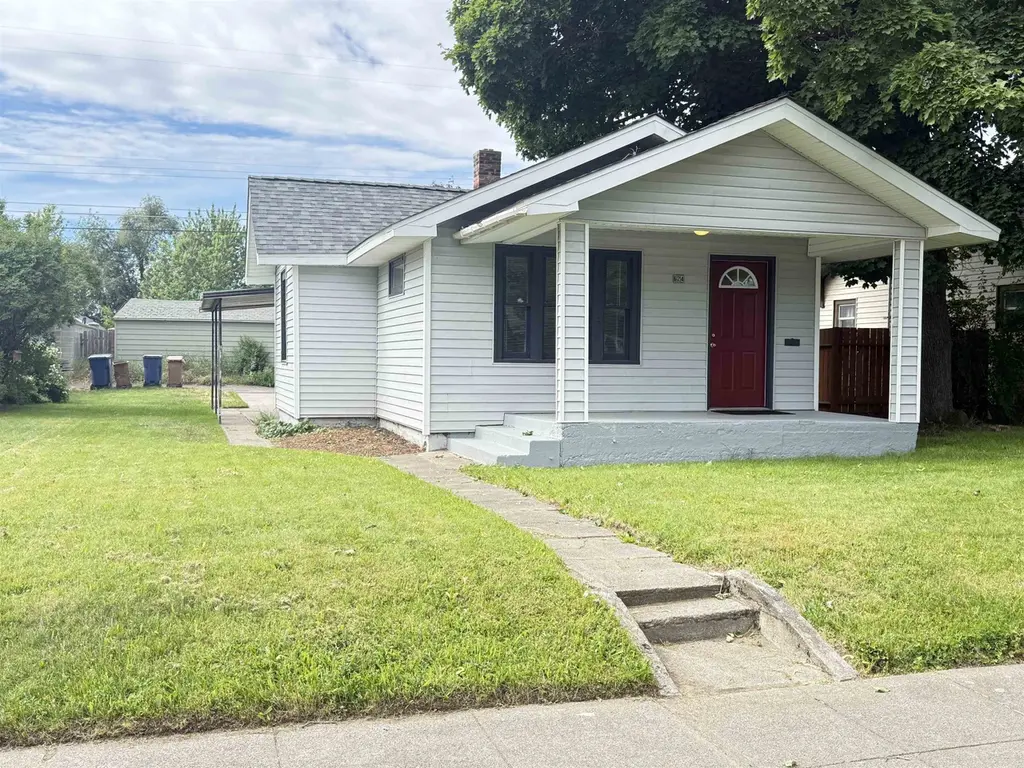
624 E Rich Ave · Spokane, WA
Flood risk 1/10 · Minimal
- FEMA flood zone
- X (unshaded)
- Chance of flooding over 30 yrs
- 0.0%
- Est. flood insurance / yr
- $473 – $860
Fire risk 1/10 · Minimal
- Est. fire insurance / yr
- $604 – $1,122
Heat risk 3/10 · Minor
- Hot days now (above 94°F)
- 7 days/yr
- Hot days in 30 yrs
- 15 days/yr
Wind risk 1/10 · Minimal
- Chance of severe wind over 30 yrs
- —
Air-quality risk 10/10 · Severe
- Unhealthy air days now
- 19 days/yr
- Unhealthy air days in 30 yrs
- 21 days/yr
Risk factors via First Street. Map © Google.
Why this score? — see what drove the D- grade
The composite is a weighted blend of 9 inputs, each scored 0–100. Each bar is that input's sub-score; the figure is the points it added to the 100-point composite (weight × sub-score).
- ARV discount +13.8/15.0
- Cash flow +5.8/30.0
- Schools +4.6/10.0
- Livability +4.0/5.0
- Rent growth +3.3/5.0
- Condition / age +2.5/5.0
- 1% rule +0.8/10.0
- DSCR +0.2/10.0
- Appreciation +0.0/10.0
$209,900
🖨 Deal sheet (PDF) 📄 Offer letter ✓ Due diligence
Listing remarks
Don't let this one get away! This exceptionally clean and well-maintained home shines both inside and out. Featuring new carpet and fresh paint. The spacious main floor offers 2 bedrooms, 1 bathroom, a large living room and a truly generous dining area. The attached 2-car garage and beautifully kept lot add to the home's appeal. Relax and unwind on the inviting covered front porch or enjoy outdoor gatherings on the side patio. The clean basement includes a third room (non-egress) and a toilet already in place, providing an excellent opportunity to add a second 1/2 of full bathroom for expand living space. With durable vinyl siding and a newer roof, this home offers low-maintenance living an
Key facts
- Covered front porch
- Fresh paint
- New carpet
Tags
Property features AI
Exterior
- Parking: Detached garage (2 car); RV access/parking; Oversized parking; Off-site parking available
- Utilities: Natural gas
- Home design: Single-family residence; One story
- Construction: Vinyl siding; Composition roof; Below-grade finished area present
- Exterior features: Patio; Automatic sprinklers; Level lot; Paved city street frontage; Alley access
Interior
- Kitchen: Free-standing range; Refrigerator
- Bedrooms: 3 bedrooms
- Heating & cooling: Natural gas forced air heating
- Interior features: Partial unfinished basement with rough-in for bedroom and bathroom; Basement laundry rough-in; Free-standing range; Refrigerator
- Laundry & utility: Basement laundry rough-in
Neighborhood map
What this means for you Summary
Snapshot
- This is a 2-bed/1.0-bath single-family listed at $210k.
Deal economics
- At list price, monthly cash flow is $-416 ($-5k/yr) — negative.
- To cash-flow at today's rent, offer at most $136k (35.0% below list).
- To meet the 1% rule (rent ≥ 1% of price), the offer needs to be $122k (41.7% below list).
- Recommended offer: $122k (41.7% below list) — sets the bar for 1% rule.
- Cap rate 3.9% vs local median 3.2% in Spokane — meaningfully above typical; check what's discounted (condition, days-on-market, listing class) to confirm the premium yield is real.
Location & tenants
- Location reads 80/100 on livability (#93 in WA, #1,822 nationally) — a professional / high-income tenant draw. Strengths: amenities A+, commute A+, housing A+; Watch: crime F.
- Spokane School District (urban): math 47% / reading 58% proficiency, ranked #136 of 291 in WA (top 47%) — acceptable for families but not a draw, mixed tenant base, ~2y average lease.
- Zoned schools: Longfellow Elementary (417 students, 86% FRL); Garry Middle School (569 students, 88% FRL); Rogers High School (1,536 students, 83% FRL) — zoned schools average 86% FRL vs 50% district-wide (36 pts higher); higher-poverty schools than district average — tighter screening recommended.
- Market conditions: Rents rising (+3.2%/yr); 241 active listings in the ZIP; 25 comparable units currently listed for rent nearby; rentals at typical pace (median 25d on market — plan ~3-4 weeks tenant-placement turnaround); 3,608 units permitted in Spokane County in 2024 (1,792 in 5+ unit buildings).
Forward outlook
- Local home prices are declining (-3.0%/yr); year-one equity from $1k of loan paydown is wiped out by about $6k of value loss. Plan a longer hold.
- Spokane County population projected at +13% by 2050 — modest demand growth; plan on rents tracking national, not racing it.
Negotiation context
- Only 3 days on market — expect competitive offers; lowballing is unlikely to land.
- Current owner paid $27k; list at $210k implies a 677% gain — meaningful room to come down on a strong offer.
Risks & watch-outs
- Watch-outs: built in 1925 — expect roof / HVAC / electrical / plumbing capex.
Questions for the listing agent
- What do current leases actually rent for vs. the listed asking? Can we see a recent rent roll and the last 12 months of T-12 income?
- Built in 1925 — when were the roof, HVAC, electrical panel, plumbing, and water heater last replaced?
- Is there a deadline driving the sale (1031 exchange, divorce, estate, relocation)? That informs how much negotiation room exists.
- Schools are B-rated — typically a magnet for longer-tenancy family renters. What's the average tenant stay here, and is there a school-zone premium baked into asking?
- Crime grade is F in this area — have there been break-ins, vandalism, or insurance claims at this property in the last 3 years? What carrier currently insures it and at what premium?
- The area grade is low — what's the realistic commute time and amenity access for the typical tenant pool here? Any planned neighborhood developments (good or bad) we should know about?
- What's the average days-on-market for RENTAL listings here right now (not sales)? A rising rental-DOM trend means longer vacancies and softer asking-rent achievability than the comps imply.
- What's the recent tenant-quality profile in this submarket — average credit score on applications, eviction rate, late-payment / NSF rate, and stable-employment percentage? A property-management company in the area should have these aggregated.
- How much new for-sale + rental construction is in the pipeline within 1–3 miles? Heavy new supply typically softens prices + rents 12–24 months out; constrained supply supports both.
Investment metrics
- 1% rule
- 0.58% ✗
- Cap rate
- 3.92%
- Cash-on-cash
- -8.49%
- DSCR
- 0.62
- GRM
- 14.3
CMA / ARV
- ARV (on-the-fly)
- $244,352
- Comps found
- 12
Show comp detail 12 sales within ~0.75 mi
| Address | Dist | Beds/Ba | Sqft | Sold | Price | $/sf | Match |
|---|---|---|---|---|---|---|---|
| 211 E Longfellow Ave | 0.35mi | 2/1.0 | 714 (-3%) | 5mo | $235,000 | $329 | 75 |
| 1124 E Garland Ave | 0.38mi | 2/1.0 | 700 (-5%) | 1mo | $232,500 | $332 | 73 |
| 717 E Providence Ave | 0.29mi | 2/1.0 | 672 (-9%) | 5mo | $230,000 | $342 | 68 |
| 1217 E Glass Ave | 0.58mi | 2/1.0 | 745 (+1%) | 8mo | $220,000 | $295 | 64 |
| 1117 E Garland Ave | 0.35mi | 2/1.0 | 803 (+9%) | 7mo | $250,000 | $311 | 63 |
| 1313 E Walton Ave | 0.44mi | 2/1.0 | 792 (+8%) | 5mo | $160,000 | $202 | 63 |
| 1024 E Queen Ave | 0.55mi | 2/1.0 | 676 (-8%) | 2mo | $243,000 | $359 | 59 |
| 617 E Wabash Ave | 0.39mi | 2/1.0 | 808 (+10%) | 10mo | $285,000 | $353 | 57 |
| 1307 E Princeton Ave | 0.45mi | 2/1.0 | 804 (+9%) | 11mo | $267,000 | $332 | 54 |
| 1307 E Bridgeport Ave | 0.69mi | 2/1.0 | 774 (+5%) | 8mo | $246,267 | $318 | 52 |
| 1311 E Garland Ave | 0.46mi | 2/1.0 | 660 (-10%) | 11mo | $220,000 | $333 | 52 |
| 1304 E Hoffman Ave | 0.45mi | 2/1.0 | 660 (-10%) | 11mo | $240,000 | $364 | 52 |
Match score weights: distance 35% · size 25% · config 20% · recency 20%. Top-matched comps best support the ARV.
Projected returns pro-forma
-3.0% appreciation · 3.25% rent growth · sell at horizon
- IRR
- -31.0%
- Equity multiple
- -0.02×
- Total profit
- $-60,198
- Equity at exit
- $31,297
- IRR
- -33.1%
- Equity multiple
- -0.45×
- Total profit
- $-85,326
- Equity at exit
- $18,148
Cash invested: $58,772 (down + closing). Projections, not guarantees.
Landlord ↔ Tenant lean methodology
- Overall (STATE)
- 28 Tenant-Leaning
- State Washington
- 28 Tenant-Leaning · D+8
- County
- — inherits STATE
- City
- — inherits STATE
ZIP-level market 99207
- Home prices YoY
- -21.3%
- Rents YoY
- 3.2%
- Active inventory
- 241
- Price-to-rent
- 14.3×
Monthly cashflow live
- Estimated rent
- $1,224 high interval (Pro) →
- Mortgage (P&I)
- −$1,101
- Tax from tax record
- −$195 /mo · $2,335/yr
- Insurance
- −$87
- HOA
- −$0
- Vacancy / Maint / Mgmt
- −$257
- Net cashflow
- $-416
Break-even live
Sensitivity live
| Price | -10% $-297 | -5% $-356 | +0% $-416 | +5% $-475 | +10% $-534 |
|---|---|---|---|---|---|
| Rent | -10% $-512 | -5% $-464 | +0% $-416 | +5% $-367 | +10% $-319 |
| Rate | -1.0pp $-310 | -0.5pp $-362 | base $-416 | +0.5pp $-470 | +1.0pp $-525 |
UW: 25.0% down · 7.5% · 30yr · 1.5% tax · 5.0% vac · 8.0% maint · 8.0% mgmt
Financing live
Cash to close
- Down payment
- $52,475
- Closing costs
- $6,297
- Reserves months
- —
- Total cash needed
- —
Loan-product check · same deal, 3 products live
Conventional
25% down · 7.5% · 30yr
- Down + closing
- —
- Monthly P&I
- —
- Monthly cashflow
- —
- DSCR
- —
- Eligible?
- —
Personal DTI + credit; lowest rate.
DSCR
20% down · 8.5% · 30yr
- Down + closing
- —
- Monthly P&I
- —
- Monthly cashflow
- —
- DSCR
- —
- Eligible?
- —
No personal income docs; deal must DSCR.
Hard money
10% down · 12.0% · 12mo
- Down + closing
- —
- Monthly P&I
- —
- Monthly cashflow
- —
- DSCR
- —
- Eligible?
- —
Short-term bridge; refi at stabilization.
Rent comps 25 comps
| Address | Beds | Baths | Sqft | Rent | $/sqft | DOM | Units | Dist |
|---|---|---|---|---|---|---|---|---|
| 709 E Kiernan Ave Spokane, WA | 1.0 | 1.0 | 728 | $1,250 | $1.72 | 25d | 1 | 0.37mi |
| 1327 E Bridgeport Ave Spokane, WA | 1.0 | 1.0 | 504 | $1,195 | $2.37 | 25d | 1 | 0.73mi |
| 120 E Euclid Ave Unit 3 Spokane, WA | 2.0 | 1.0 | 640 | $1,095 | $1.71 | 25d | 1 | 0.83mi |
| 2918 N Hamilton St Spokane, WA | 2.0 | 1.0 | 672 | $1,495 | $2.22 | 25d | 1 | 0.84mi |
| 139 W Gray Ct Unit 201 Spokane, WA | 1.0 | 1.0 | 605 | $995 | $1.64 | 25d | 1 | 0.91mi |
| 2915 N Mayfair St Unit 15 Spokane, WA | 2.0 | 1.0 | 700 | $1,050 | $1.50 | 15d | 1 | 0.91mi |
| 2915 N Mayfair St Unit 16 Spokane, WA | 2.0 | 1.0 | 700 | $1,050 | $1.50 | 25d | 1 | 0.91mi |
| 1712 E Sanson Ave Unit 1 Spokane, WA | 1.0 | 1.0 | 520 | $995 | $1.91 | 25d | 1 | 0.99mi |
| 2914 N Hogan St Spokane, WA | 2.0 | 1.0 | 650 | $1,100 | $1.69 | 25d | 1 | 1.02mi |
| 3909 N Wall St Spokane, WA | 1.0–2.0 | 1.0–2.0 | 775 | $2,340 | $3.02 | 15d | 4 | 1.06mi |
| 6018 N Ruby St #8 Spokane, WA | 2.0 | 1.0 | 600 | $995 | $1.66 | 15d | 1 | 1.18mi |
| 951 W Walton Ave Spokane, WA | 1.0 | 1.0 | 601 | $1,450 | $2.41 | 15d | 10 | 1.19mi |
| 6029 N Mayfair St Unit 7 Spokane, WA | 1.0 | 1.0 | 725 | $1,025 | $1.41 | 15d | 1 | 1.19mi |
| 6123 N Colton St Unit 2 Spokane, WA | 1.0 | 1.0 | 450 | $900 | $2.00 | 23d | 1 | 1.23mi |
| 6123 N Colton St Spokane, WA | 1.0 | 1.0 | 450 | $999 | $2.22 | 15d | 2 | 1.23mi |
| 6123 N Colton St Apt 1 Spokane, WA | 1.0 | 1.0 | 450 | $999 | $2.22 | 25d | 1 | 1.23mi |
| 406 E Montgomery Ave Spokane, WA | 1.0 | 1.0 | 490 | $986 | $2.01 | 15d | 3 | 1.33mi |
| 2213 N Perry St Spokane, WA | 2.0 | 1.0 | 672 | $950 | $1.41 | 25d | 1 | 1.33mi |
| 1104 W Kiernan Ave Unit 02 Spokane, WA | 2.0 | 1.0 | 585 | $1,100 | $1.88 | 25d | 1 | 1.37mi |
| 617 E Houston Ave Unit HH340 Spokane, WA | 2.0 | 1.0 | 710 | $1,100 | $1.55 | 15d | 1 | 1.38mi |
| 617 E Houston Ave Unit HH301 Spokane, WA | 1.0 | 1.0 | 510 | $950 | $1.86 | 25d | 1 | 1.38mi |
| 827 E Ermina Ave Unit 5 Spokane, WA | 1.0 | 1.0 | 650 | $1,075 | $1.65 | 25d | 1 | 1.39mi |
| 910 E Holyoke Ave Spokane, WA | 1.0–2.0 | 1.0 | 755 | $1,425 | $1.89 | 15d | 4 | 1.43mi |
| 6603 N Standard St Unit 6605 Spokane, WA | 2.0 | 1.0 | 750 | $1,200 | $1.60 | 25d | 1 | 1.45mi |
| 901 E Holyoke Ave Spokane, WA | 1.0 | 1.0 | 588 | $1,075 | $1.83 | 25d | 3 | 1.47mi |
Listing history 4 events
-
2026-06-14statusdays on market $209,900 Pending 3 DOM
-
2026-06-10days on market $209,900 Active 2 DOM
-
2026-06-09remarks 699-char remark
-
2026-06-09$209,900 Active 1 DOM
ⓘ Source: listings_history table (triggers on properties + properties_extension) + one-shot
backfill from property_details.listing_events for pre-trigger history.
Tax reassessment forecast WA · Resets to sale price
- Current annual tax
- $2,335 · $195/mo
- Projected year-2 tax
- $2,335 · $195/mo
- Expected delta
- $0/yr ($0/mo · 0.0%)
ⓘ Screening estimate from a state-policy table — verify with the county assessor before closing.
Climate risk First Street
- Flood 1/10 Low FEMA zone X (unshaded) · 0% chance over 30 yrs
- Wildfire 1/10 Low
- Heat 3/10 Moderate 7 d/yr ≥94°F today · 15 d/yr by 30 yrs out
- Wind 1/10 Low
- Air quality 10/10 Extreme 19 unhealthy d/yr today · 21 by 30 yrs out
Nearby sold comps map
Loading sold comps map…
Walkable amenities ~0.75 mi
Loading nearby amenities…
Taxation est. · year 1
- Rental income
- $14,691
- − Mortgage interest
- −$11,758
- − Property taxes
- −$2,335
- − Insurance
- −$1,050
- − Repairs & maintenance
- −$1,175
- − Management
- −$1,175
- − Depreciation
- −$6,106
- Taxable loss
- −$8,908
- Est. tax savings @ 24.0%
- +$2,138
- After-tax cash flow
- $-2,849/yr
For passive investors: Depreciation is non-cash, so a rental often shows a tax loss while cash-flowing — sheltering income. Rental losses are passive: they offset passive income freely, and up to $25,000/yr can offset ordinary (W-2) income if you actively participate and your MAGI is under $100k (phasing out to $0 by $150k); unused losses carry forward. On sale, claimed depreciation is recaptured at up to 25%, and gains may owe capital-gains tax (a 1031 exchange can defer both). Figures are a year-1 estimate at your 24.0% rate — not tax advice; consult a CPA.
Schools (NCES district)
- District
- Spokane School District
- NCES district ID
- 5308250
- Math proficiency
- 47% ▲ 1.00%
- Reading proficiency
- 58% ▲ 1.00%
- Median HH income
- $43,187
- Composite
- 46.1/100
- National rank
- #5477
- State rank
- #136 of 291 in WA
Livability — Spokane
- Score
- 80/100
- State rank
- #93
- US rank
- #1822
Category grades
Schools grade is shown separately in the Schools card above.
Census & demographics
- Census place
- Spokane, WA
- County
- Spokane County · 496,401 people
- City population
- 298,820
- Metro
- Spokane-Spokane Valley, WA
- Population (ZIP)
- 32,770
- Household income
- $60,452
- Rent vs Own
- Severe rent burden
- 1557.0
Population outlook (Spokane County) Hauer SSP2
- Today (2025)
- 531,314 people
- By 2030
- 549,278 · +3.4%
- By 2040
- 577,822 · +8.8%
- By 2050
- 598,188 · +12.6%
- By 2075
- 630,744 · +18.7%
- By 2100
- 622,360 · +17.1%
Race, ethnicity, and origin ACS 2023
- Neighborhood character
- Predominantly White (76%)
- Race & ethnicity
- White 76% Two or more races 10% Hispanic / Latino 8% Black 4% Asian 3% Native American 1%
- Hispanic origin (detail)
- Mexican 5%
- Common ancestry
- Portuguese 3% Lithuanian 3% Slovak 3%
- Foreign-born
- 6% · Canada, Vietnam, Philippines
- Languages at home
- 90% English-only · Spanish 3% Russian/Polish/Slavic 1% Other Asian/Pacific 1%
Political lean MEDSL · Spokane
- 2024 margin
- Toss-up / Even · D 46.0% · R 51.0% · Other 3.0%
- 2008→2024 swing
- -3.8pp toward R · 2008: -1.1pp · 2024: -5.0pp
- All cycles
- 2024: R+5.0 2020: R+4.3 2016: R+8.3 2012: R+6.3 2008: R+1.1
Not yet ingested
- Civics
- —
Market trends
- HPI YoY
- ▼ -103.43%
- Current HPI
- 381.758
- Rent YoY
- ▲ 3.25%
- Metro
- Spokane-Spokane Valley, WA
- State GDP YoY
- ▲ 4.65%
- F500 in state
- 22
Industry mix (Fortune 500 HQ in WA)
| Industry | F500 HQs | Revenue |
|---|---|---|
| Retail | 2 | $269B |
|
||
| Technology / Retail | 1 | $638B |
|
||
| Technology | 1 | $245B |
|
||
| Telecommunications | 1 | $38B |
|
||
| Food / Beverage | 1 | $36B |
|
||
| Automotive / Trucks | 1 | $34B |
|
||
Price history
+677.4% since first listed2 events — show timeline
- 2026-06-08 Listed $209,900 SPOKANEMLS as Distributed by MLS Grid
- 1983-03-29 Sold (Public Records) $27,000 Public Records
Property tax history
+7.1%/yrLatest (2026): $2,335 · +4.4% YoY. Source: county tax records.
Cash-flow waterfall
monthlySold comps — $/sqft
last 12 mo · ≤1 miLoading sold comps…