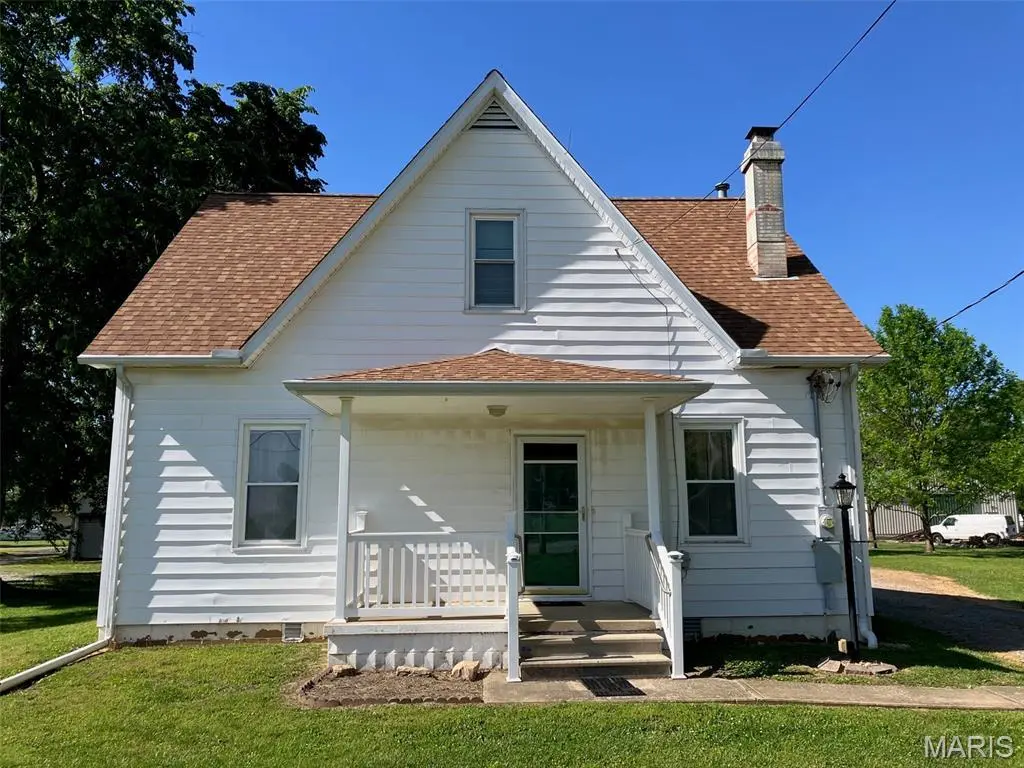
813 W Broadway · Trenton, IL
Flood risk 1/10 · Minimal
- FEMA flood zone
- X (unshaded)
- Chance of flooding over 30 yrs
- 0.0%
- Est. flood insurance / yr
- $473 – $860
Fire risk 1/10 · Minimal
- Est. fire insurance / yr
- $804 – $1,492
Heat risk 5/10 · Moderate
- Hot days now (above 106°F)
- 7 days/yr
- Hot days in 30 yrs
- 21 days/yr
Wind risk 2/10 · Minimal
- Chance of severe wind over 30 yrs
- 2.0%
Air-quality risk 2/10 · Minimal
- Unhealthy air days now
- 2 days/yr
- Unhealthy air days in 30 yrs
- 2 days/yr
Risk factors via First Street. Map © Google.
Why this score? — see what drove the C+ grade
The composite is a weighted blend of 9 inputs, each scored 0–100. Each bar is that input's sub-score; the figure is the points it added to the 100-point composite (weight × sub-score).
- Cash flow +18.6/30.0
- ARV discount +15.0/15.0
- Appreciation +6.9/10.0
- DSCR +5.8/10.0
- 1% rule +4.0/10.0
- Livability +3.8/5.0
- Schools +2.6/10.0
- Rent growth +2.5/5.0
- Condition / age +2.5/5.0
$159,900
🖨 Deal sheet 📄 Offer letter ✓ Due diligence
Listing remarks
Charming 1.5 story home offering 1,680 sq ft of comfortable living space in a fantastic Trenton location! This well-maintained home features 3 bedrooms, 2 full bathrooms, and a spacious layout perfect for everyday living and entertaining. Outside, you’ll find a 2-car detached garage and plenty of space to enjoy. Located in a highly desirable school district and close to local amenities, this is an opportunity you won’t want to miss. Schedule your showing today!
Key facts
- Local amenities
- Detached garage
- 1 acre lot
Tags
Property features AI
Exterior
- Parking: Attached garage with 2 spaces
- Utilities: Public water; Public sewer; Electricity available (single phase); Natural gas available
- Home design: Single-family residence; Residential property; Vinyl siding
- Construction: Vinyl siding construction
- Exterior features: Level lot; Approximately 1 acre lot
Interior
- Kitchen: Main-level kitchen (12 x 13)
- Bedrooms: Three bedrooms total, one on the main level and two on the upper level; Upper-level storage room
- Bathrooms: Two full bathrooms (both on main/upper levels)
- Heating & cooling: Forced air heating; Central air conditioning
- Interior features: Cellar basement; One and one-half levels; 11 total rooms
- Laundry & utility: Main-level laundry room (4 x 7); Mud room (6 x 9)
Neighborhood map
What this means for you Summary
Snapshot
- This is a 3-bed/1.0-bath single-family listed at $160k.
Deal economics
- At list price, monthly cash flow is $154 ($2k/yr) — positive.
- The deal already cash-flows at list — no discount required.
- To meet the 1% rule (rent ≥ 1% of price), the offer needs to be $144k (9.8% below list).
- Recommended offer: $144k (9.8% below list) — sets the bar for 1% rule.
Location & tenants
- Location reads 75/100 on livability (#233 in IL, #4,280 nationally) — a middle-class / working-renter tenant base. Strengths: crime A+, cost of living A+, housing A+; Watch: amenities F, commute F.
- Wesclin CUSD 3 (rural): math 24% / reading 32% proficiency, ranked #247 of 620 in IL (top 40%) — low school quality limits family demand, transient renter base, plan for 1-2y turnover.
- Zoned schools: Wesclin Sr High School (math 32% / reading 32%, grade F, #157 of 693 statewide, top 25%, 373 students, 0% FRL) — zoned schools average 0% FRL vs 27% district-wide (27 pts lower); this property's tenant base skews higher-income than the district average.
- Market conditions: 11 active listings in the ZIP; 64 units permitted in Clinton County in 2024 (0 in 5+ unit buildings).
Forward outlook
- In year one you build about $7k of equity ($1k loan paydown + $6k appreciation (3.8% local appreciation)).
- Clinton County population projected at -12% by 2050 — secular population decline; favor cash flow + early exit over multi-decade hold.
- At projected returns (3.8% appreciation + 3.0% rent growth), your $45k cash investment doubles in ~5 years — after that, you're playing with house money.
- By year 5, paydown + projected appreciation supports a ~$31k cash-out refi (75% LTV) — recoverable capital for the next deal without selling this one.
Negotiation context
- Only 4 days on market — expect competitive offers; lowballing is unlikely to land.
Risks & watch-outs
- Watch-outs: built in 1915 — expect roof / HVAC / electrical / plumbing capex.
- Climate carrying-cost: extreme-heat days projected 7→21/yr by 2055 (HVAC capex compounding) — expect insurance premiums to compound above CPI over the hold.
Questions for the listing agent
- Built in 1915 — when were the roof, HVAC, electrical panel, plumbing, and water heater last replaced?
- Is there a deadline driving the sale (1031 exchange, divorce, estate, relocation)? That informs how much negotiation room exists.
- Schools are D-rated, which usually means shorter tenancies and higher turnover. Who's the typical renter profile here, and what's been the actual vacancy rate?
- What's the average days-on-market for RENTAL listings here right now (not sales)? A rising rental-DOM trend means longer vacancies and softer asking-rent achievability than the comps imply.
- What's the recent tenant-quality profile in this submarket — average credit score on applications, eviction rate, late-payment / NSF rate, and stable-employment percentage? A property-management company in the area should have these aggregated.
- How much new for-sale + rental construction is in the pipeline within 1–3 miles? Heavy new supply typically softens prices + rents 12–24 months out; constrained supply supports both.
Investment metrics
- 1% rule
- 0.90% ✗
- Cap rate
- 7.45%
- Cash-on-cash
- 4.13%
- DSCR
- 1.18
- GRM
- 9.2
CMA / ARV
- ARV (median comp)
- $192,788
- List price
- $159,900
- Delta
- -17.06%
- Verdict
- UNDERPRICED
- Comps
- 20 within 1.0 mi
Show comp detail 8 sales within ~0.75 mi
| Address | Dist | Beds/Ba | Sqft | Sold | Price | $/sf | Match |
|---|---|---|---|---|---|---|---|
| 220 N Madison St | 0.49mi | 3/1.0 | 1,572 (-4%) | 6mo | $186,000 | $118 | 64 |
| 325 N Van Buren St | 0.25mi | 3/1.5 | 1,424 (-13%) | 4mo | $189,999 | $133 | 61 |
| 542 W 3rd St | 0.30mi | 3/2.0 | 1,420 (-14%) | 6mo | $176,000 | $124 | 54 |
| 25 W Kentucky St | 0.68mi | 3/2.5 | 1,482 (-10%) | 2mo | $245,000 | $165 | 44 |
| 106 W Iowa St | 0.68mi | 3/1.5 | 1,432 (-13%) | 12mo | $207,900 | $145 | 35 |
| 309 N Washington St | 0.65mi | 2/1.0 (-1) | 1,876 (+14%) | 12mo | $90,000 | $48 | 32 |
| 415 W 3rd St | 0.45mi | 4/2.0 (+1) | 1,873 (+14%) | 22mo | $220,000 | $117 | 29 |
| 313 W Iowa St | 0.57mi | 3/2.5 | 1,870 (+14%) | 21mo | $155,000 | $83 | 27 |
Match score weights: distance 35% · size 25% · config 20% · recency 20%. Top-matched comps best support the ARV.
Projected returns pro-forma
3.76% appreciation · 3.0% rent growth · sell at horizon
- IRR
- 13.3%
- Equity multiple
- 1.79×
- Total profit
- $35,505
- Equity at exit
- $78,798
- IRR
- 14.7%
- Equity multiple
- 3.34×
- Total profit
- $104,831
- Equity at exit
- $127,098
Cash invested: $44,772 (down + closing). Projections, not guarantees.
Landlord ↔ Tenant lean methodology
- Overall (STATE)
- 43 Moderately Tenant-Leaning
- State Illinois
- 43 Moderately Tenant-Leaning · D+7
- County
- — inherits STATE
- City
- — inherits STATE
ZIP-level market 62293
- Home prices YoY
- 1.4%
- Active inventory
- 11
- Price-to-rent
- 9.2×
Monthly cashflow live
- Estimated rent
- $1,443 medium interval (Pro) →
- Mortgage (P&I)
- −$839
- Tax from tax record
- −$81 /mo · $969/yr
- Insurance
- −$67
- HOA
- −$0
- Vacancy / Maint / Mgmt
- −$303
- Net cashflow
- $154
Break-even live
UW: 25.0% down · 7.5% · 30yr · 1.5% tax · 5.0% vac · 8.0% maint · 8.0% mgmt
Financing live
Cash to close
- Down payment
- $39,975
- Closing costs
- $4,797
- Reserves months
- —
- Total cash needed
- —
Loan-product check · same deal, 3 products live
Conventional
25% down · 7.5% · 30yr
- Down + closing
- —
- Monthly P&I
- —
- Monthly cashflow
- —
- DSCR
- —
- Eligible?
- —
Personal DTI + credit; lowest rate.
DSCR
20% down · 8.5% · 30yr
- Down + closing
- —
- Monthly P&I
- —
- Monthly cashflow
- —
- DSCR
- —
- Eligible?
- —
No personal income docs; deal must DSCR.
Hard money
10% down · 12.0% · 12mo
- Down + closing
- —
- Monthly P&I
- —
- Monthly cashflow
- —
- DSCR
- —
- Eligible?
- —
Short-term bridge; refi at stabilization.
Listing history 2 events
-
2026-05-18status Pending 477-char remark
-
2026-05-13$159,900 Active 477-char remark
ⓘ Source: listings_history table (triggers on properties + properties_extension) + one-shot
backfill from property_details.listing_events for pre-trigger history.
Tax reassessment forecast IL · Partial reset (capped growth)
- Current annual tax
- $969 · $81/mo
- Projected year-2 tax
- $2,299 · $192/mo
- Expected delta
- +$1,331/yr (+$111/mo · 137.4%)
ⓘ Screening estimate from a state-policy table — verify with the county assessor before closing.
Climate risk First Street
- Flood 1/10 Low FEMA zone X (unshaded) · 0% chance over 30 yrs
- Wildfire 1/10 Low
- Heat 5/10 Major 7 d/yr ≥106°F today · 21 d/yr by 30 yrs out
- Wind 2/10 Low 2% chance of damaging wind over 30 yrs
- Air quality 2/10 Low 2 unhealthy d/yr today · 2 by 30 yrs out
Nearby sold comps map
Loading sold comps map…
Walkable amenities ~0.75 mi
Loading nearby amenities…
Taxation est. · year 1
- Rental income
- $17,314
- − Mortgage interest
- −$8,957
- − Property taxes
- −$969
- − Insurance
- −$800
- − Repairs & maintenance
- −$1,385
- − Management
- −$1,385
- − Depreciation
- −$4,652
- Taxable loss
- −$832
- Est. tax savings @ 24.0%
- +$200
- After-tax cash flow
- $2,048/yr
For passive investors: Depreciation is non-cash, so a rental often shows a tax loss while cash-flowing — sheltering income. Rental losses are passive: they offset passive income freely, and up to $25,000/yr can offset ordinary (W-2) income if you actively participate and your MAGI is under $100k (phasing out to $0 by $150k); unused losses carry forward. On sale, claimed depreciation is recaptured at up to 25%, and gains may owe capital-gains tax (a 1031 exchange can defer both). Figures are a year-1 estimate at your 24.0% rate — not tax advice; consult a CPA.
Schools (NCES district)
- District
- Wesclin CUSD 3
- NCES district ID
- 1739420
- Math proficiency
- 24% ▼ -10.00%
- Reading proficiency
- 32% ▼ -13.00%
- Median HH income
- $68,295
- Composite
- 26.27/100
- National rank
- #7249
- State rank
- #247 of 620 in IL
Livability — Trenton
- Score
- 75/100
- State rank
- #233
- US rank
- #4280
Category grades
Schools grade is shown separately in the Schools card above.
Census & demographics
- Census place
- Trenton, IL
- City population
- 4,572
- Population (ZIP)
- 4,572
Population outlook (Clinton County) Hauer SSP2
- Today (2025)
- 37,663 people
- By 2030
- 37,194 · -1.2%
- By 2040
- 35,566 · -5.6%
- By 2050
- 32,950 · -12.5%
- By 2075
- 26,403 · -29.9%
- By 2100
- 19,267 · -48.8%
Race, ethnicity, and origin ACS 2023
- Neighborhood character
- Predominantly White (94%)
- Race & ethnicity
- White 94% Two or more races 5% Hispanic / Latino 1%
- Common ancestry
- Lithuanian 4% Iranian 1% Slovak 1%
- Foreign-born
- 1%
- Languages at home
- 99% English-only · German/W. Germanic 1%
Political lean MEDSL · Clinton
- 2024 margin
- Solid R (+51.8) · D 23.1% · R 75.0% · Other 1.9%
- 2008→2024 swing
- -42.0pp toward R · 2008: -9.8pp · 2024: -51.8pp
- All cycles
- 2024: R+51.8 2020: R+51.1 2016: R+49.0 2012: R+30.0 2008: R+9.8
Not yet ingested
- Civics
- —
Market trends
- HPI YoY
- ▲ 3.76%
- Current HPI
- 263.938
- Rent YoY
- —
- Metro
- —
- State GDP YoY
- ▲ 1.59%
- F500 in state
- 60
Industry mix (Fortune 500 HQ in IL)
| Industry | F500 HQs | Revenue |
|---|---|---|
| Insurance | 4 | $201B |
|
||
| Consumer Goods | 4 | $87B |
|
||
| Industrial Machinery | 3 | $64B |
|
||
| Healthcare | 2 | $55B |
|
||
| Retail / Pharmacy | 1 | $148B |
|
||
| Agriculture / Food | 1 | $86B |
|
||
Price history
2 events — show timeline
- 2026-05-18 Pending — MARIS as Distributed by MLS Grid
- 2026-05-13 Listed $159,900 MARIS as Distributed by MLS Grid
Property tax history
-5.4%/yrLatest (2024): $969 · -2.9% YoY. Source: county tax records.
Cash-flow waterfall
monthlySold comps — $/sqft
last 12 mo · ≤1 miLoading sold comps…