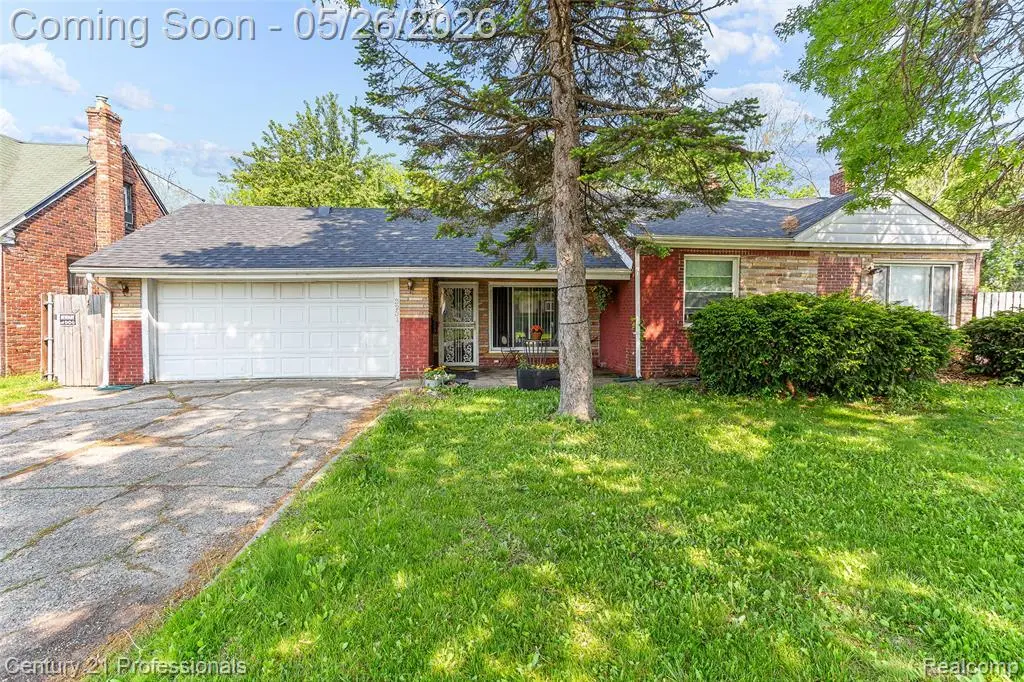
3231 Spruce St · Inkster, MI
Flood risk 1/10 · Minimal
- FEMA flood zone
- X (unshaded)
- Chance of flooding over 30 yrs
- 0.0%
- Est. flood insurance / yr
- $507 – $1,088
Fire risk 1/10 · Minimal
- Est. fire insurance / yr
- $784 – $1,456
Heat risk 3/10 · Minor
- Hot days now (above 98°F)
- 7 days/yr
- Hot days in 30 yrs
- 15 days/yr
Wind risk 2/10 · Minimal
- Chance of severe wind over 30 yrs
- —
Air-quality risk 2/10 · Minimal
- Unhealthy air days now
- 1 days/yr
- Unhealthy air days in 30 yrs
- 2 days/yr
Risk factors via First Street. Map © Google.
Why this score? — see what drove the D+ grade
The composite is a weighted blend of 9 inputs, each scored 0–100. Each bar is that input's sub-score; the figure is the points it added to the 100-point composite (weight × sub-score).
- Cash flow +22.0/30.0
- DSCR +7.0/10.0
- 1% rule +5.2/10.0
- Livability +3.4/5.0
- Rent growth +3.2/5.0
- Condition / age +2.5/5.0
- Schools +1.8/10.0
- ARV discount +0.0/15.0
- Appreciation +0.0/10.0
$125,000
🖨 Deal sheet (PDF) 📄 Offer letter ✓ Due diligence
Listing remarks
3231 Spruce Street offers a 2-bedroom, 1 bath and an opportunity for buyers seeking quality, comfort, and lasting value. Set on a quiet, tree-lined street with an additional (35 x 119.60) lot, you will enjoy this huge backyard with blueberry bushes, pear, and peach trees — ideal for entertaining, gardening, or simply enjoying the outdoors. Major 2022 updates: electrical, roof, HWH, & furnace provide peace of mind. Inside, a welcoming fireplace anchors the living room, while SS appliances and a 2-car attached garage add everyday convenience and functionality. Commuters will appreciate the prime location — just minutes from DTW with direct access to I-94, I-275, Southfield Fr
Key facts
- 0.57 acre lot
- 2 garage spots
- Built 1949
Property features AI
Finance
- Other: Pets allowed (cats and dogs permitted)
- HOA & community: Association fee includes lawn maintenance
Exterior
- Parking: Attached 2-car garage with electric, heated space and direct access
- Utilities: Public water; Natural gas heating and gas water heater; Electric service; Ceiling fan(s) for cooling
- Home design: Residential, single-story home; Built in 1949
- Construction: Slab foundation
- Exterior features: Brick exterior; Fenced yard; Porch; Kennel on property; Paved street access; Frontage approximately 105 feet
Interior
- Kitchen: Kitchen on entry level (approx. 10 x 8); Range/Oven; Microwave; Refrigerator; Disposal
- Bedrooms: Bedroom 1 on entry level (13 x 10) with vinyl flooring; Bedroom 2 on entry level (12 x 11) with vinyl flooring
- Flooring: Vinyl flooring in bedrooms, living room, kitchen and laundry; Ceramic flooring in dining room and bathroom
- Bathrooms: 1 full bathroom on entry level with ceramic flooring (approx. 8 x 5)
- Heating & cooling: Forced air heating; Ceiling fan(s) for cooling; Gas water heater
- Interior features: DSL available; Total of 8 rooms
- Laundry & utility: Laundry on entry level (approx. 10 x 9) with vinyl flooring; Washer; Dryer
Neighborhood map
What this means for you Summary
Snapshot
- This is a 2-bed/1.0-bath single-family listed at $125k.
Deal economics
- At list price, monthly cash flow is $199 ($2k/yr) — positive.
- The deal already cash-flows at list — no discount required.
- Meets the 1% rule at list price ($1k rent vs $125k).
- Recommended offer: $123k (1.5% below list) — sets the bar for market timing.
Location & tenants
- Location reads 67/100 on livability (#406 in MI) — a middle-class / working-renter tenant base. Strengths: commute A+, cost of living A+, housing A+; Watch: health & safety D, schools F, crime F.
- Taylor School District (urban): math 14% / reading 27% proficiency, ranked #462 of 540 in MI (top 86%) — low school quality limits family demand, transient renter base, plan for 1-2y turnover; 68% free/reduced lunch — lower-income household profile, screen leases tightly.
- Market conditions: Rents rising (+3.0%/yr); 147 active listings in the ZIP; 19 comparable units currently listed for rent nearby; rentals at typical pace (median 19d on market — plan ~3-4 weeks tenant-placement turnaround); lower-income renter base — watch delinquency; 2,639 units permitted in Wayne County in 2024 (1,216 in 5+ unit buildings).
- This rent runs 39% of the median local income ($39k/yr) — at the standard rent-burdened threshold; future hikes will face affordability resistance.
Forward outlook
- Local home prices are declining (-3.0%/yr); year-one equity from $864 of loan paydown is wiped out by about $4k of value loss. Plan a longer hold.
- Wayne County population projected at -17% by 2050 — secular population decline; favor cash flow + early exit over multi-decade hold.
Negotiation context
- It's been on market 26 days — a 2% lower offer ($123k) is reasonable based on typical stale-listing flexibility.
Risks & watch-outs
- Watch-outs: built in 1949 — expect roof / HVAC / electrical / plumbing capex.
Questions for the listing agent
- Built in 1949 — when were the roof, HVAC, electrical panel, plumbing, and water heater last replaced?
- Is there a deadline driving the sale (1031 exchange, divorce, estate, relocation)? That informs how much negotiation room exists.
- Schools are F-rated, which usually means shorter tenancies and higher turnover. Who's the typical renter profile here, and what's been the actual vacancy rate?
- Crime grade is F in this area — have there been break-ins, vandalism, or insurance claims at this property in the last 3 years? What carrier currently insures it and at what premium?
- The area grade is low — what's the realistic commute time and amenity access for the typical tenant pool here? Any planned neighborhood developments (good or bad) we should know about?
- What's the average days-on-market for RENTAL listings here right now (not sales)? A rising rental-DOM trend means longer vacancies and softer asking-rent achievability than the comps imply.
- What's the recent tenant-quality profile in this submarket — average credit score on applications, eviction rate, late-payment / NSF rate, and stable-employment percentage? A property-management company in the area should have these aggregated.
- How much new for-sale + rental construction is in the pipeline within 1–3 miles? Heavy new supply typically softens prices + rents 12–24 months out; constrained supply supports both.
Investment metrics
- 1% rule
- 1.02% ✓
- Cap rate
- 8.20%
- Cash-on-cash
- 6.82%
- DSCR
- 1.30
- GRM
- 8.2
CMA / ARV
- ARV (on-the-fly)
- $98,196
- Comps found
- 12
Show comp detail 12 sales within ~0.75 mi
| Address | Dist | Beds/Ba | Sqft | Sold | Price | $/sf | Match |
|---|---|---|---|---|---|---|---|
| 3135 Harrison St | 0.23mi | 2/1.0 | 1,049 (+5%) | 4mo | $47,000 | $45 | 78 |
| 3525 Hickory St | 0.16mi | 3/1.0 (+1) | 880 (-12%) | 4mo | $104,000 | $118 | 64 |
| 3829 Walnut St | 0.43mi | 3/1.0 (+1) | 1,070 (+7%) | 2mo | $128,000 | $120 | 61 |
| 4135 Allen St | 0.61mi | 3/1.0 (+1) | 972 (-3%) | 1mo | $40,000 | $41 | 60 |
| 3543 Spring Hill Ave | 0.42mi | 3/1.0 (+1) | 1,097 (+10%) | 3mo | $108,000 | $98 | 57 |
| 2500 Weithoff Ct | 0.59mi | 3/1.0 (+1) | 1,050 (+5%) | 3mo | $125,000 | $119 | 57 |
| 26825 Kitch St | 0.67mi | 3/1.0 (+1) | 972 (-3%) | 2mo | $130,000 | $134 | 56 |
| 4005 Moore St | 0.50mi | 3/1.0 (+1) | 1,100 (+10%) | 2mo | $46,000 | $42 | 54 |
| 2317 Spring Hill Ave | 0.57mi | 3/1.0 (+1) | 924 (-8%) | 3mo | $47,610 | $52 | 53 |
| 3826 Inkster Rd | 0.48mi | 3/1.5 (+1) | 880 (-12%) | 4mo | $23,000 | $26 | 47 |
| 4133 Moore St | 0.60mi | 3/1.0 (+1) | 854 (-15%) | 1mo | $106,000 | $124 | 42 |
| 26656 Kitch St | 0.75mi | 3/1.0 (+1) | 909 (-9%) | 6mo | $60,000 | $66 | 40 |
Match score weights: distance 35% · size 25% · config 20% · recency 20%. Top-matched comps best support the ARV.
Projected returns pro-forma
-3.0% appreciation · 2.95% rent growth · sell at horizon
- IRR
- -5.9%
- Equity multiple
- 0.78×
- Total profit
- $-7,668
- Equity at exit
- $18,638
- IRR
- 3.7%
- Equity multiple
- 1.27×
- Total profit
- $9,304
- Equity at exit
- $10,808
Cash invested: $35,000 (down + closing). Projections, not guarantees.
Landlord ↔ Tenant lean methodology
- Overall (STATE)
- 62 Landlord-Friendly
- State Michigan
- 62 Landlord-Friendly · EVEN
- County
- — inherits STATE
- City
- — inherits STATE
ZIP-level market 48141
- Home prices YoY
- -2.9%
- Rents YoY
- 3.0%
- Active inventory
- 147
- Price-to-rent
- 8.2×
Monthly cashflow live
- Estimated rent
- $1,271 high interval (Pro) →
- Mortgage (P&I)
- −$656
- Tax from tax record
- −$97 /mo · $1,167/yr
- Insurance
- −$52
- HOA
- −$0
- Vacancy / Maint / Mgmt
- −$267
- Net cashflow
- $199
Break-even live
Sensitivity live
| Price | -10% $270 | -5% $234 | +0% $199 | +5% $164 | +10% $128 |
|---|---|---|---|---|---|
| Rent | -10% $99 | -5% $149 | +0% $199 | +5% $249 | +10% $299 |
| Rate | -1.0pp $262 | -0.5pp $231 | base $199 | +0.5pp $167 | +1.0pp $134 |
UW: 25.0% down · 7.5% · 30yr · 1.5% tax · 5.0% vac · 8.0% maint · 8.0% mgmt
Financing live
Cash to close
- Down payment
- $31,250
- Closing costs
- $3,750
- Reserves months
- —
- Total cash needed
- —
Loan-product check · same deal, 3 products live
Conventional
25% down · 7.5% · 30yr
- Down + closing
- —
- Monthly P&I
- —
- Monthly cashflow
- —
- DSCR
- —
- Eligible?
- —
Personal DTI + credit; lowest rate.
DSCR
20% down · 8.5% · 30yr
- Down + closing
- —
- Monthly P&I
- —
- Monthly cashflow
- —
- DSCR
- —
- Eligible?
- —
No personal income docs; deal must DSCR.
Hard money
10% down · 12.0% · 12mo
- Down + closing
- —
- Monthly P&I
- —
- Monthly cashflow
- —
- DSCR
- —
- Eligible?
- —
Short-term bridge; refi at stabilization.
Rent comps 19 comps
| Address | Beds | Baths | Sqft | Rent | $/sqft | DOM | Units | Dist |
|---|---|---|---|---|---|---|---|---|
| 3236 Walnut St Inkster, MI | 3.0 | 1.0 | 1096 | $1,495 | $1.36 | 0d | 1 | 0.18mi |
| 27149 Penn St Inkster, MI | 1.0 | 1.0 | 846 | $650 | $0.77 | 19d | 1 | 0.46mi |
| 27139 Penn St Inkster, MI | 3.0 | 1.0 | 832 | $675 | $0.81 | 19d | 1 | 0.47mi |
| 26742 Penn St Inkster, MI | 3.0 | 1.0 | 1000 | $1,300 | $1.30 | 18d | 1 | 0.68mi |
| 4167 Isabelle St Inkster, MI | 2.0 | 1.0 | 900 | $1,295 | $1.44 | 19d | 1 | 0.69mi |
| 4301 Harriet St Unit A-1 Inkster, MI | 2.0 | 1.5 | 1000 | $1,300 | $1.30 | 45d | 1 | 0.71mi |
| 26707 Penn St Inkster, MI | 3.0 | 1.0 | 900 | $1,400 | $1.56 | 6d | 1 | 0.72mi |
| 26382 Colgate St Inkster, MI | 2.0 | 1.0 | 850 | $935 | $1.10 | 26d | 1 | 0.98mi |
| 1189 Woodland Dr Inkster, MI | 3.0 | 1.0 | 994 | $1,400 | $1.41 | 1d | 1 | 1.08mi |
| 1150 Magnolia Dr Inkster, MI | 3.0 | 1.0 | 900 | $1,300 | $1.44 | 26d | 1 | 1.11mi |
| 27184 Lucerne Dr Inkster, MI | 3.0 | 1.0 | 1100 | $1,250 | $1.14 | 45d | 1 | 1.13mi |
| 29971 Brooklane St Inkster, MI | 3.0 | 1.0 | 974 | $1,450 | $1.49 | 45d | 1 | 1.23mi |
| 26274 McDonald St Dearborn Heights, MI | 3.0 | 1.0 | 1365 | $1,575 | $1.15 | 0d | 1 | 1.27mi |
| 26089 Lehigh St Inkster, MI | 2.0 | 1.0 | 900 | $1,295 | $1.44 | 19d | 1 | 1.30mi |
| 29203 Oakwood St Inkster, MI | 3.0 | 1.5 | 912 | $1,600 | $1.75 | 0d | 1 | 1.31mi |
| 25745 Princeton St Dearborn Heights, MI | 3.0 | 1.0 | 1080 | $1,500 | $1.39 | 12d | 1 | 1.32mi |
| 25722 Carlysle St Dearborn Heights, MI | 3.0 | 1.0 | 1040 | $1,450 | $1.39 | 19d | 1 | 1.35mi |
| 30010 Hazelwood St Inkster, MI | 3.0 | 1.0 | 1044 | $1,300 | $1.25 | 45d | 1 | 1.47mi |
| 29800 Oakwood St Inkster, MI | 3.0 | 1.0 | 1040 | $1,400 | $1.35 | 14d | 1 | 1.48mi |
Listing history 16 events
-
2026-06-21days on market $125,000 Active 26 DOM
-
2026-06-18days on market $125,000 Active 23 DOM
-
2026-06-17days on market $125,000 Active 22 DOM
-
2026-06-16days on market $125,000 Active 21 DOM
-
2026-06-15days on market $125,000 Active 20 DOM
-
2026-06-13days on market $125,000 Active 18 DOM
-
2026-06-13days on market $125,000 Active 17 DOM
-
2026-06-09days on market $125,000 Active 14 DOM
-
2026-06-08days on market $125,000 Active 13 DOM
-
2026-06-07days on market $125,000 Active 12 DOM
-
2026-06-04days on market $125,000 Active 9 DOM
-
2026-06-03days on market $125,000 Active 8 DOM
-
2026-06-02days on market $125,000 Active 7 DOM
-
2026-06-01days on market $125,000 Active 6 DOM
-
2026-05-31days on market $125,000 Active 5 DOM
-
2026-05-21historical $125,000
ⓘ Source: listings_history table (triggers on properties + properties_extension) + one-shot
backfill from property_details.listing_events for pre-trigger history.
Tax reassessment forecast MI · Partial reset (capped growth)
- Current annual tax
- $1,167 · $97/mo
- Projected year-2 tax
- $1,546 · $129/mo
- Expected delta
- +$379/yr (+$32/mo · 32.5%)
ⓘ Screening estimate from a state-policy table — verify with the county assessor before closing.
Climate risk First Street
- Flood 1/10 Low FEMA zone X (unshaded) · 0% chance over 30 yrs
- Wildfire 1/10 Low
- Heat 3/10 Moderate 7 d/yr ≥98°F today · 15 d/yr by 30 yrs out
- Wind 2/10 Low
- Air quality 2/10 Low 1 unhealthy d/yr today · 2 by 30 yrs out
Nearby sold comps map
Loading sold comps map…
Walkable amenities ~0.75 mi
Loading nearby amenities…
Taxation est. · year 1
- Rental income
- $15,247
- − Mortgage interest
- −$7,002
- − Property taxes
- −$1,167
- − Insurance
- −$625
- − Repairs & maintenance
- −$1,220
- − Management
- −$1,220
- − Depreciation
- −$3,636
- Taxable income
- $377
- Est. tax owed @ 24.0%
- −$90
- After-tax cash flow
- $2,296/yr
For passive investors: Depreciation is non-cash, so a rental often shows a tax loss while cash-flowing — sheltering income. Rental losses are passive: they offset passive income freely, and up to $25,000/yr can offset ordinary (W-2) income if you actively participate and your MAGI is under $100k (phasing out to $0 by $150k); unused losses carry forward. On sale, claimed depreciation is recaptured at up to 25%, and gains may owe capital-gains tax (a 1031 exchange can defer both). Figures are a year-1 estimate at your 24.0% rate — not tax advice; consult a CPA.
Schools (NCES district)
- District
- Taylor School District
- NCES district ID
- 2633540
- Math proficiency
- 14% ▼ -7.00%
- Reading proficiency
- 27% ▼ -4.00%
- Median HH income
- $43,062
- Composite
- 17.62/100
- National rank
- #9034
- State rank
- #462 of 540 in MI
Livability — Inkster
- Score
- 67/100
- State rank
- #406
- US rank
- #11087
Category grades
Schools grade is shown separately in the Schools card above.
Census & demographics
- Census place
- Inkster, MI
- County
- Wayne County · 1,562,939 people
- City population
- 25,428
- Metro
- Detroit-Warren-Dearborn, MI
- Population (ZIP)
- 25,428
- Household income
- $39,252
- Rent vs Own
- Severe rent burden
- 1558.0
Population outlook (Wayne County) Hauer SSP2
- Today (2025)
- 1,675,273 people
- By 2030
- 1,620,300 · -3.3%
- By 2040
- 1,502,341 · -10.3%
- By 2050
- 1,384,039 · -17.4%
- By 2075
- 1,124,592 · -32.9%
- By 2100
- 881,193 · -47.4%
Race, ethnicity, and origin ACS 2023
- Neighborhood character
- Predominantly Black (72%)
- Race & ethnicity
- Black 72% White 17% Two or more races 7% Hispanic / Latino 2% Asian 1%
- Common ancestry
- Romanian 3% Slovak 1% Italian 1%
- Foreign-born
- 5% · Canada, China
- Languages at home
- 92% English-only · Arabic 3% Other Asian/Pacific 1% Spanish 1%
Political lean MEDSL · Wayne
- 2024 margin
- Strong D (+29.0) · D 62.7% · R 33.7% · Other 3.6%
- 2008→2024 swing
- -20.5pp toward R · 2008: 49.5pp · 2024: 29.0pp
- All cycles
- 2024: D+29.0 2020: D+38.1 2016: D+37.3 2012: D+46.9 2008: D+49.5
Not yet ingested
- Civics
- —
Market trends
- HPI YoY
- ▼ -11.74%
- Current HPI
- 390.2139
- Rent YoY
- ▲ 2.95%
- Metro
- Detroit-Warren-Dearborn, MI
- State GDP YoY
- ▲ 1.37%
- F500 in state
- 28
Industry mix (Fortune 500 HQ in MI)
| Industry | F500 HQs | Revenue |
|---|---|---|
| Automotive Parts | 3 | $48B |
|
||
| Automotive | 2 | $372B |
|
||
| Chemicals | 1 | $45B |
|
||
| Automotive Retail | 1 | $29B |
|
||
| Healthcare / Medical Devices | 1 | $23B |
|
||
| Automotive Technology | 1 | $20B |
|
||
Price history
1 event — show timeline
- 2026-05-21 Coming Soon $125,000 MiRealSource-MiMLS
Property tax history
-1.4%/yrLatest (2025): $1,167 · -20.4% YoY. Source: county tax records.
Cash-flow waterfall
monthlySold comps — $/sqft
last 12 mo · ≤1 miLoading sold comps…