 Multi-family
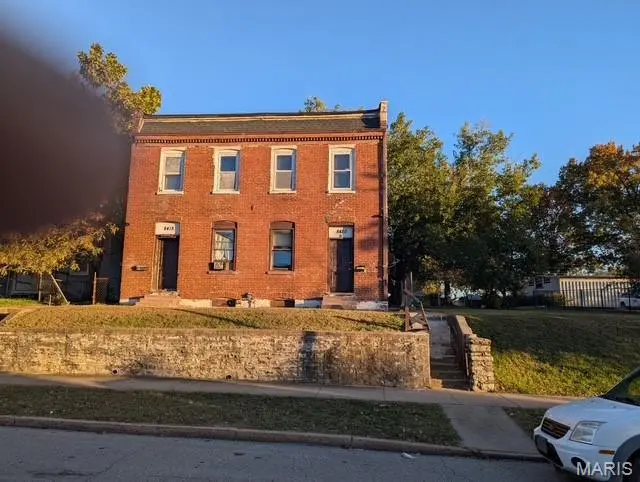
8418 -20 South Broadway · St. Louis, MO
Flood risk 1/10 · Minimal
- FEMA flood zone
- X (unshaded)
- Chance of flooding over 30 yrs
- 0.0%
- Est. flood insurance / yr
- $507 – $1,088
Fire risk 1/10 · Minimal
- Est. fire insurance / yr
- $1,054 – $1,958
Heat risk 5/10 · Moderate
- Hot days now (above 109°F)
- 7 days/yr
- Hot days in 30 yrs
- 21 days/yr
Wind risk 2/10 · Minimal
- Chance of severe wind over 30 yrs
- 1.0%
Air-quality risk 3/10 · Minor
- Unhealthy air days now
- 2 days/yr
- Unhealthy air days in 30 yrs
- 3 days/yr
Risk factors via First Street. Map © Google.
Why this score? — see what drove the D grade
The composite is a weighted blend of 9 inputs, each scored 0–100. Each bar is that input's sub-score; the figure is the points it added to the 100-point composite (weight × sub-score).
- Cash flow +15.0/30.0
- ARV discount +7.5/15.0
- 1% rule +5.0/10.0
- DSCR +5.0/10.0
- Rent growth +3.3/5.0
- Livability +2.5/5.0
- Schools +1.2/10.0
- Condition / age +1.0/5.0
- Appreciation +0.0/10.0
$50,000
🖨 Deal sheet 📄 Offer letter ✓ Due diligence
Multi-family units
County records classify this as Multi-Family (2-4 Unit). Listing-text estimate: 1 unit. estimate disagrees with records
Listing remarks MLS
NO SHOWINGS WITHOUT AN ACCEPTED CONTRACT AND PROOF OF FUNDS. Seller to do no inspections or repairs. Seller is selling property in its current condition. Motivated Seller
Key facts
- Built 1897
- Listed 189 days
Neighborhood map
What this means for you Summary
Snapshot
- This is a 4-bed/4.0-bath multifamily listed at $50k. Condition is rated poor.
Deal economics
- At list price, monthly cash flow is $2k ($29k/yr) — positive.
- The deal already cash-flows at list — no discount required.
- Meets the 1% rule at list price ($4k rent vs $50k).
- Recommended offer: $44k (12.0% below list) — sets the bar for market timing.
- Cap rate 64.4% vs local median 5.0% in St. Louis — top-decile yield for the area; either an underpriced asset or a hidden risk that comps aren't pricing in. Stress-test before assuming the spread holds.
Location & tenants
- Location reads: area grade D — affects rentability + tenant quality, not the cash-flow math above.
- St. Louis City (urban): math 10% / reading 18% proficiency, ranked #312 of 324 in MO (top 96%) — low school quality limits family demand, transient renter base, plan for 1-2y turnover; 80% free/reduced lunch — lower-income household profile, screen leases tightly.
- Market conditions: Rents rising (+3.3%/yr); 125 active listings in the ZIP; 9 comparable units currently listed for rent nearby; rentals leasing fast (median 3d on market — plan ~1-2 weeks tenant-placement turnaround); 294 units permitted in St. Louis city in 2024 (227 in 5+ unit buildings).
- At $3,503/mo this rent would consume 89% of the median local household income ($47k/yr) (locally 1364% of renters already pay >50% of income on rent) — very limited rent-growth headroom before tenants either downsize or default.
Forward outlook
- Local home prices are declining (-3.0%/yr); year-one equity from $346 of loan paydown is wiped out by about $2k of value loss. Plan a longer hold.
- St. Louis County population projected to shrink 6% by 2050 — rents likely to lag national; underwrite the cash flow, not the appreciation.
- At projected returns (-3.0% appreciation + 3.3% rent growth), your $14k cash investment doubles in ~1 year — after that, you're playing with house money.
Negotiation context
- It's been on market 189 days — a 12% lower offer ($44k) is reasonable based on typical stale-listing flexibility.
- 2 sale attempts; this cycle's ask has dropped $100k (67%) from the opening price — seller is motivated, your offer sets the floor, not the list.
Risks & watch-outs
- Watch-outs: built in 1897 — expect roof / HVAC / electrical / plumbing capex.
- Climate carrying-cost: extreme-heat days projected 7→21/yr by 2055 (HVAC capex compounding) — expect insurance premiums to compound above CPI over the hold.
Questions for the listing agent
- It's been on market 189 days. Have you received any prior offers? Is the seller open to a 12% concession, seller financing, or rate buy-down credit?
- Have any recent inspections been done? Can we get a copy of the seller's disclosures and any deferred-maintenance estimates?
- Built in 1897 — when were the roof, HVAC, electrical panel, plumbing, and water heater last replaced?
- Why hasn't it sold? Are there any deal-killer items the seller is aware of (foundation, flood, title, zoning, code violations)?
- Is there a deadline driving the sale (1031 exchange, divorce, estate, relocation)? That informs how much negotiation room exists.
- The area grade is low — what's the realistic commute time and amenity access for the typical tenant pool here? Any planned neighborhood developments (good or bad) we should know about?
- What's the average days-on-market for RENTAL listings here right now (not sales)? A rising rental-DOM trend means longer vacancies and softer asking-rent achievability than the comps imply.
- What's the recent tenant-quality profile in this submarket — average credit score on applications, eviction rate, late-payment / NSF rate, and stable-employment percentage? A property-management company in the area should have these aggregated.
- How much new apartment / multifamily construction is in the pipeline within 1–3 miles? Heavy new supply (>2% of stock underway) typically softens rents 12–24 months out; light construction supports rent growth.
Investment metrics
- 1% rule
- 7.01% ✓
- Cap rate
- 64.42%
- Cash-on-cash
- 207.59%
- DSCR
- 10.24
- GRM
- 1.2
CMA / ARV
- ARV (median comp)
- $186,941
- List price
- $50,000
- Delta
- -73.25%
- Verdict
- UNDERPRICED
- Comps
- 20 within 1.0 mi
Show comp detail 7 sales within ~0.75 mi
| Address | Dist | Beds/Ba | Sqft | Sold | Price | $/sf | Match |
|---|---|---|---|---|---|---|---|
| 8418 S Broadway St | 0.00mi | 4/4.0 | — | 8mo | $75,000 | — | 80 |
| 8205 S Broadway | 0.16mi | 4/7.0 | 3,080 | 22mo | $215,000 | $70 | 50 |
| 7600 Pennsylvania Ave | 0.56mi | 4/4.0 | — | 16mo | $260,000 | — | 48 |
| 7906 Minnesota Ave | 0.38mi | 4/3.0 | 2,372 | 24mo | $144,900 | $61 | 46 |
| 7310 Minnesota Ave | 0.75mi | 3/3.0 (-1) | 1,504 | 3mo | $144,900 | $96 | 41 |
| 7720 Ivory Ave | 0.53mi | 4/2.0 | 2,876 | 21mo | $175,000 | $61 | 37 |
| 8635 S Grand Ave | 0.69mi | 4/3.0 | 1,657 | 17mo | $239,000 | $144 | 37 |
Match score weights: distance 35% · size 25% · config 20% · recency 20%. Top-matched comps best support the ARV.
Projected returns pro-forma
-3.0% appreciation · 3.27% rent growth · sell at horizon
- IRR
- —
- Equity multiple
- 11.51×
- Total profit
- $147,153
- Equity at exit
- $7,455
- IRR
- —
- Equity multiple
- 24.64×
- Total profit
- $330,908
- Equity at exit
- $4,323
Cash invested: $14,000 (down + closing). Projections, not guarantees.
Landlord ↔ Tenant lean methodology
- Overall (STATE)
- 81 Strongly Landlord-Friendly
- State Missouri
- 81 Strongly Landlord-Friendly · R+10
- County
- — inherits STATE
- City
- — inherits STATE
ZIP-level market 63111
- Rents YoY
- 3.3%
- Active inventory
- 125
- Price-to-rent
- 3.6×
Monthly cashflow live
- Estimated rent
- $3,503 high interval (Pro) →
- Mortgage (P&I)
- −$262
- Tax est. 1.5%
- −$62 /mo · $750/yr
- Insurance
- −$21
- HOA
- −$0
- Vacancy / Maint / Mgmt
- −$736
- Net cashflow
- $2,422
Break-even live
3-unit breakdown (identical units grouped — click to expand)
| Units | Beds | Baths | Est. rent |
|---|---|---|---|
| 3× units | 2 | 1 | $3,504 |
| #1 | 2 | 1 | $1,168 |
| #2 | 2 | 1 | $1,168 |
| #3 | 2 | 1 | $1,168 |
| Total (3 units) | $3,503 | ||
UW: 25.0% down · 7.5% · 30yr · 1.5% tax · 5.0% vac · 8.0% maint · 8.0% mgmt
Financing live
Cash to close
- Down payment
- $12,500
- Closing costs
- $1,500
- Reserves months
- —
- Total cash needed
- —
Loan-product check · same deal, 3 products live
Conventional
25% down · 7.5% · 30yr
- Down + closing
- —
- Monthly P&I
- —
- Monthly cashflow
- —
- DSCR
- —
- Eligible?
- —
Personal DTI + credit; lowest rate.
DSCR
20% down · 8.5% · 30yr
- Down + closing
- —
- Monthly P&I
- —
- Monthly cashflow
- —
- DSCR
- —
- Eligible?
- —
No personal income docs; deal must DSCR.
Hard money
10% down · 12.0% · 12mo
- Down + closing
- —
- Monthly P&I
- —
- Monthly cashflow
- —
- DSCR
- —
- Eligible?
- —
Short-term bridge; refi at stabilization.
Rent comps 9 comps
| Address | Beds | Baths | Sqft | Rent | $/sqft | DOM | Units | Dist |
|---|---|---|---|---|---|---|---|---|
| 7924 Michigan Ave Unit 2F St. Louis, MO | 3.0 | 2.0 | 1250 | $1,195 | $0.96 | 3d | 1 | 0.39mi |
| 304 Bayless Ave Saint Louis, MO | 3.0 | 1.0 | 1104 | $1,950 | $1.77 | 1d | 1 | 0.61mi |
| 349 Lagro Ave Saint Louis, MO | 3.0 | 1.0 | 1184 | $1,500 | $1.27 | 43d | 1 | 0.77mi |
| 6800 Virginia Ave Unit 1 St. Louis, MO | 3.0 | 1.0 | 1500 | $1,475 | $0.98 | 17d | 1 | 1.14mi |
| 6730 Vermont Ave Saint Louis, MO | 3.0 | 2.0 | 1534 | $1,600 | $1.04 | 14d | 1 | 1.14mi |
| 7109 Eugene Ave Saint Louis, MO | 3.0 | 2.0 | 1029 | $1,495 | $1.45 | 2d | 1 | 1.19mi |
| 146 W Felton Ave Unit 1472913P St. Louis, MO | 5.0 | 2.0 | — | $6,355 | — | 1d | 1 | 1.23mi |
| 6607 S Broadway Unit 1 St. Louis, MO | 4.0 | 2.0 | — | $1,600 | — | 17d | 1 | 1.24mi |
| 3857 Boulevard Heights Ct Saint Louis, MO | 3.0 | 2.5 | 1697 | $2,250 | $1.33 | 1d | 1 | 1.35mi |
Listing history 23 events
-
2026-06-18days on market $50,000 Active 189 DOM
-
2026-06-17price $50,000 Active 188 DOM
-
2026-06-17days on market $65,000 Active 188 DOM
-
2026-06-16days on market $65,000 Active 187 DOM
-
2026-06-15days on market $65,000 Active 186 DOM
-
2026-06-13days on market $65,000 Active 184 DOM
-
2026-06-09days on market $65,000 Active 180 DOM
-
2026-06-08days on market $65,000 Active 179 DOM
-
2026-06-08days on market $65,000 Active 178 DOM
-
2026-06-05days on market $65,000 Active 175 DOM
-
2026-06-03days on market $65,000 Active 174 DOM
-
2026-06-02days on market $65,000 Active 173 DOM
-
2026-06-01days on market $65,000 Active 172 DOM
-
2026-05-31days on market $65,000 Active 171 DOM
-
2026-05-08status Active 170-char remark
Show marketing remark (170 chars)
NO SHOWINGS WITHOUT AN ACCEPTED CONTRACT AND PROOF OF FUNDS. Seller to do no inspections or repairs. Seller is selling property in its current condition. Motivated Seller
-
2026-05-08price $65,000 170-char remark
Show marketing remark (170 chars)
NO SHOWINGS WITHOUT AN ACCEPTED CONTRACT AND PROOF OF FUNDS. Seller to do no inspections or repairs. Seller is selling property in its current condition. Motivated Seller
-
2026-02-20price $75,000 170-char remark
Show marketing remark (170 chars)
NO SHOWINGS WITHOUT AN ACCEPTED CONTRACT AND PROOF OF FUNDS. Seller to do no inspections or repairs. Seller is selling property in its current condition. Motivated Seller
-
2026-02-10price $86,500 170-char remark
Show marketing remark (170 chars)
NO SHOWINGS WITHOUT AN ACCEPTED CONTRACT AND PROOF OF FUNDS. Seller to do no inspections or repairs. Seller is selling property in its current condition. Motivated Seller
-
2026-02-04price $85,500 170-char remark
Show marketing remark (170 chars)
NO SHOWINGS WITHOUT AN ACCEPTED CONTRACT AND PROOF OF FUNDS. Seller to do no inspections or repairs. Seller is selling property in its current condition. Motivated Seller
-
2026-01-22price $95,000 170-char remark
Show marketing remark (170 chars)
NO SHOWINGS WITHOUT AN ACCEPTED CONTRACT AND PROOF OF FUNDS. Seller to do no inspections or repairs. Seller is selling property in its current condition. Motivated Seller
-
2026-01-13price $105,000 170-char remark
Show marketing remark (170 chars)
NO SHOWINGS WITHOUT AN ACCEPTED CONTRACT AND PROOF OF FUNDS. Seller to do no inspections or repairs. Seller is selling property in its current condition. Motivated Seller
-
2025-12-18price $125,000 170-char remark
Show marketing remark (170 chars)
NO SHOWINGS WITHOUT AN ACCEPTED CONTRACT AND PROOF OF FUNDS. Seller to do no inspections or repairs. Seller is selling property in its current condition. Motivated Seller
-
2025-11-04$150,000 Active 170-char remark
Show marketing remark (170 chars)
NO SHOWINGS WITHOUT AN ACCEPTED CONTRACT AND PROOF OF FUNDS. Seller to do no inspections or repairs. Seller is selling property in its current condition. Motivated Seller
ⓘ Source: listings_history table (triggers on properties + properties_extension) + one-shot
backfill from property_details.listing_events for pre-trigger history.
Climate risk First Street
- Flood 1/10 Low FEMA zone X (unshaded) · 0% chance over 30 yrs
- Wildfire 1/10 Low
- Heat 5/10 Major 7 d/yr ≥109°F today · 21 d/yr by 30 yrs out
- Wind 2/10 Low 100% chance of damaging wind over 30 yrs
- Air quality 3/10 Moderate 2 unhealthy d/yr today · 3 by 30 yrs out
Nearby sold comps map
Loading sold comps map…
Walkable amenities ~0.75 mi
Loading nearby amenities…
Taxation est. · year 1
- Rental income
- $42,036
- − Mortgage interest
- −$2,801
- − Property taxes
- −$750
- − Insurance
- −$250
- − Repairs & maintenance
- −$3,363
- − Management
- −$3,363
- − Depreciation
- −$1,455
- Taxable income
- $30,055
- Est. tax owed @ 24.0%
- −$7,213
- After-tax cash flow
- $21,849/yr
For passive investors: Depreciation is non-cash, so a rental often shows a tax loss while cash-flowing — sheltering income. Rental losses are passive: they offset passive income freely, and up to $25,000/yr can offset ordinary (W-2) income if you actively participate and your MAGI is under $100k (phasing out to $0 by $150k); unused losses carry forward. On sale, claimed depreciation is recaptured at up to 25%, and gains may owe capital-gains tax (a 1031 exchange can defer both). Figures are a year-1 estimate at your 24.0% rate — not tax advice; consult a CPA.
Condition & rehab AI · 10 photos
This multi-family property requires extensive repairs and updates to bring it up to current standards, significantly impacting its resale and rental value.
Repairs flagged
- Major Exterior siding — Significant damage and wear
- Major Roof — Appears old and possibly leaking
- Major Hardwood flooring — Worn and damaged
- Major Paint — Peeling and signs of water damage
- Major Bathroom fixtures — Old and in need of replacement
- Major Kitchen cabinets — Old and in need of replacement
- Major HVAC and mechanical systems — Outdated and may need replacement
Value-add opportunities
- Resale New exterior siding — Enhances curb appeal and property value
- Resale New roof — Fixes potential leak and improves property value
- Resale New hardwood flooring — Enhances interior aesthetics and property value
- Resale Paint job — Improves interior aesthetics and property value
- Resale New bathroom fixtures — Enhances bathroom functionality and property value
- Resale New kitchen cabinets — Enhances kitchen functionality and property value
- Resale New HVAC and mechanical systems — Improves comfort and property value
Renovation cost estimate screening
| Repair item | Severity | Est. cost |
|---|---|---|
| Exterior siding · Significant damage and wear | Major | $15,000–50,000 |
| Roof · Appears old and possibly leaking | Major | $15,000–50,000 |
| Hardwood flooring · Worn and damaged | Major | $15,000–50,000 |
| Paint · Peeling and signs of water damage | Major | $15,000–50,000 |
| Bathroom fixtures · Old and in need of replacement | Major | $15,000–50,000 |
| Kitchen cabinets · Old and in need of replacement | Major | $15,000–50,000 |
| HVAC and mechanical systems · Outdated and may need replacement | Major | $15,000–50,000 |
| Total estimated repair cost · 7 items | $105,000–350,000 |
Value-add ROI direction
- Resale New exterior siding — Enhances curb appeal and property value ↑
- Resale New roof — Fixes potential leak and improves property value ↑
- Resale New hardwood flooring — Enhances interior aesthetics and property value ↑
- Resale Paint job — Improves interior aesthetics and property value ↑
- Resale New bathroom fixtures — Enhances bathroom functionality and property value ↑
- Resale New kitchen cabinets — Enhances kitchen functionality and property value ↑
- Resale New HVAC and mechanical systems — Improves comfort and property value ↑
ⓘ Cost ranges are severity-bucket heuristics (US national rule-of-thumb). Get contractor quotes + a written scope before underwriting a rehab budget.
Schools (NCES district)
- District
- St. Louis City
- NCES district ID
- 2929280
- Math proficiency
- 10% ▼ -6.00%
- Reading proficiency
- 18% ▼ -3.00%
- Median HH income
- $35,685
- Composite
- 11.54/100
- National rank
- #9699
- State rank
- #312 of 324 in MO
Livability — St. Louis
No livability data for this city. (Only ~50 U.S. cities are tracked.)
Census & demographics
- Census place
- St. Louis, MO
- County
- Saint Louis City · 254,015 people
- City population
- 283,259
- Metro
- St. Louis, MO-IL
- Population (ZIP)
- 18,851
- Household income
- $47,039
- Rent vs Own
- Severe rent burden
- 1364.0
Population outlook (St. Louis County) Hauer SSP2
- Today (2025)
- 315,737 people
- By 2030
- 313,865 · -0.6%
- By 2040
- 305,439 · -3.3%
- By 2050
- 296,529 · -6.1%
- By 2075
- 271,028 · -14.2%
- By 2100
- 255,359 · -19.1%
Race, ethnicity, and origin ACS 2023
- Neighborhood character
- Diverse neighborhood (Simpson 0.65)
- Race & ethnicity
- Black 42% White 41% Two or more races 11% Hispanic / Latino 9% Asian 1%
- Hispanic origin (detail)
- Mexican 6%
- Common ancestry
- Lithuanian 3% Slovak 1% Romanian 1%
- Foreign-born
- 7% · Canada, India
- Languages at home
- 90% English-only · Spanish 7% Other Indo-European 1%
Political lean MEDSL · St. Louis
- 2024 margin
- Solid D (+64.7) · D 81.4% · R 16.7% · Other 2.0%
- 2008→2024 swing
- -3.5pp toward R · 2008: 68.2pp · 2024: 64.7pp
- All cycles
- 2024: D+64.7 2020: D+66.2 2016: D+63.7 2012: D+66.6 2008: D+68.2
Not yet ingested
- Civics
- —
Market trends
- HPI YoY
- ▼ -92.80%
- Current HPI
- 169.4644
- Rent YoY
- ▲ 3.27%
- Metro
- St. Louis, MO-IL
- State GDP YoY
- ▲ 1.84%
- F500 in state
- 20
Industry mix (Fortune 500 HQ in MO)
| Industry | F500 HQs | Revenue |
|---|---|---|
| Healthcare | 1 | $163B |
|
||
| Insurance | 1 | $21B |
|
||
| Industrial Technology | 1 | $17B |
|
||
| Retail | 1 | $16B |
|
||
| Industrial Distribution | 1 | $10B |
|
||
| Utilities | 1 | $9B |
|
||
Price history
-56.7% since first listed9 events — show timeline
- 2026-05-08 Relisted — MARIS as Distributed by MLS Grid
- 2026-05-08 Price Changed $65,000 MARIS as Distributed by MLS Grid
- 2026-02-20 Price Changed $75,000 MARIS as Distributed by MLS Grid
- 2026-02-10 Price Changed $86,500 MARIS as Distributed by MLS Grid
- 2026-02-04 Price Changed $85,500 MARIS as Distributed by MLS Grid
- 2026-01-22 Price Changed $95,000 MARIS as Distributed by MLS Grid
- 2026-01-13 Price Changed $105,000 MARIS as Distributed by MLS Grid
- 2025-12-18 Price Changed $125,000 MARIS as Distributed by MLS Grid
- 2025-11-04 Listed $150,000 MARIS as Distributed by MLS Grid
Cash-flow waterfall
monthlySold comps — $/sqft
last 12 mo · ≤1 miLoading sold comps…