 Multi-family
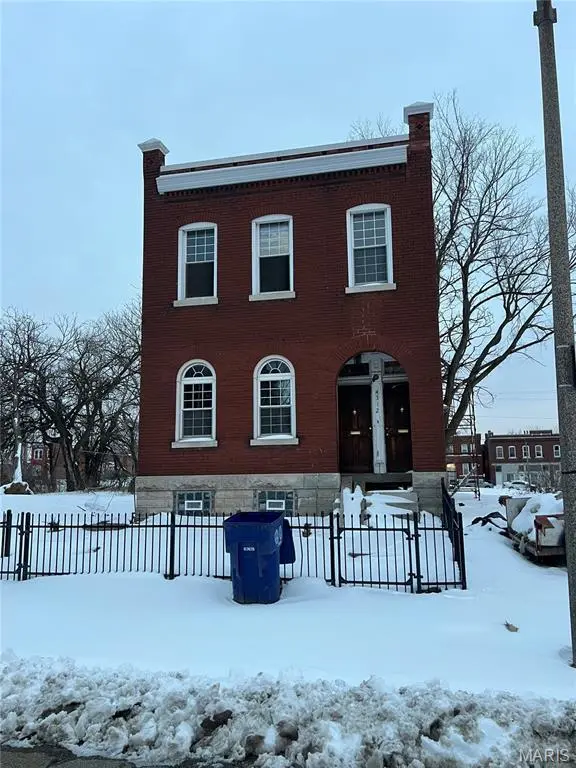
4312 College Ave · St. Louis, MO
Flood risk 1/10 · Minimal
- FEMA flood zone
- X (unshaded)
- Chance of flooding over 30 yrs
- 0.0%
- Est. flood insurance / yr
- $473 – $860
Fire risk 1/10 · Minimal
- Est. fire insurance / yr
- $1,054 – $1,958
Heat risk 5/10 · Moderate
- Hot days now (above 108°F)
- 7 days/yr
- Hot days in 30 yrs
- 21 days/yr
Wind risk 2/10 · Minimal
- Chance of severe wind over 30 yrs
- 1.0%
Air-quality risk 4/10 · Minor
- Unhealthy air days now
- 5 days/yr
- Unhealthy air days in 30 yrs
- 6 days/yr
Risk factors via First Street. Map © Google.
Why this score? — see what drove the B grade
The composite is a weighted blend of 9 inputs, each scored 0–100. Each bar is that input's sub-score; the figure is the points it added to the 100-point composite (weight × sub-score).
- Cash flow +30.0/30.0
- 1% rule +10.0/10.0
- DSCR +10.0/10.0
- ARV discount +7.5/15.0
- Appreciation +4.1/10.0
- Rent growth +2.5/5.0
- Livability +2.5/5.0
- Condition / age +2.5/5.0
- Schools +1.2/10.0
$96,000
🖨 Deal sheet 📄 Offer letter ✓ Due diligence
Multi-family units
County records classify this as Multi-Family (2-4 Unit). Listing-text estimate: 1 unit. estimate disagrees with records
Listing remarks MLS
Property has been gutted inside and framed ready for your plan. Property will need to be completed. Seller may let buyer assum the current loan, Great location closed to the new NGA.
Key facts
- 3,001 sq ft lot
- Built 1902
- Listed 84 days
Neighborhood map
What this means for you Summary
Snapshot
- This is a 4-bed/2.0-bath multifamily listed at $96k.
Deal economics
- At list price, monthly cash flow is $649 ($8k/yr) — positive.
- The deal already cash-flows at list — no discount required.
- Meets the 1% rule at list price ($2k rent vs $96k).
- Recommended offer: $90k (6.0% below list) — sets the bar for market timing.
- Cap rate 14.4% vs local median 5.0% in St. Louis — top-decile yield for the area; either an underpriced asset or a hidden risk that comps aren't pricing in. Stress-test before assuming the spread holds.
Location & tenants
- Location reads: area grade B — affects rentability + tenant quality, not the cash-flow math above.
- St. Louis City (urban): math 10% / reading 18% proficiency, ranked #312 of 324 in MO (top 96%) — low school quality limits family demand, transient renter base, plan for 1-2y turnover; 80% free/reduced lunch — lower-income household profile, screen leases tightly.
- Market conditions: 58 active listings in the ZIP; 294 units permitted in St. Louis city in 2024 (227 in 5+ unit buildings).
Forward outlook
- Local home prices are declining (-1.8%/yr); year-one equity from $664 of loan paydown is wiped out by about $2k of value loss. Plan a longer hold.
- St. Louis County population projected to shrink 6% by 2050 — rents likely to lag national; underwrite the cash flow, not the appreciation.
- At projected returns (-1.8% appreciation + 3.0% rent growth), your $27k cash investment doubles in ~4 years — after that, you're playing with house money.
Negotiation context
- It's been on market 84 days — a 6% lower offer ($90k) is reasonable based on typical stale-listing flexibility.
- 3 sale attempts since 5y ago with the ask held roughly flat each time — persistent listings suggest the price (not the market) is what's stuck; bring a comps-based counter.
- Current owner paid $25k; list at $96k implies a 284% gain — meaningful room to come down on a strong offer.
Risks & watch-outs
- Watch-outs: built in 1902 — expect roof / HVAC / electrical / plumbing capex.
- Climate carrying-cost: extreme-heat days projected 7→21/yr by 2055 (HVAC capex compounding) — expect insurance premiums to compound above CPI over the hold.
Questions for the listing agent
- It's been on market 84 days. Have you received any prior offers? Is the seller open to a 6% concession, seller financing, or rate buy-down credit?
- Built in 1902 — when were the roof, HVAC, electrical panel, plumbing, and water heater last replaced?
- Why hasn't it sold? Are there any deal-killer items the seller is aware of (foundation, flood, title, zoning, code violations)?
- Is there a deadline driving the sale (1031 exchange, divorce, estate, relocation)? That informs how much negotiation room exists.
- What's the average days-on-market for RENTAL listings here right now (not sales)? A rising rental-DOM trend means longer vacancies and softer asking-rent achievability than the comps imply.
- What's the recent tenant-quality profile in this submarket — average credit score on applications, eviction rate, late-payment / NSF rate, and stable-employment percentage? A property-management company in the area should have these aggregated.
- How much new apartment / multifamily construction is in the pipeline within 1–3 miles? Heavy new supply (>2% of stock underway) typically softens rents 12–24 months out; light construction supports rent growth.
Investment metrics
- 1% rule
- 1.60% ✓
- Cap rate
- 14.41%
- Cash-on-cash
- 28.98%
- DSCR
- 2.29
- GRM
- 5.2
CMA / ARV
- ARV (median comp)
- $55,126
- List price
- $96,000
- Delta
- 74.15%
- Verdict
- OVERPRICED
- Comps
- 20 within 1.0 mi
Show comp detail 6 sales within ~0.75 mi
| Address | Dist | Beds/Ba | Sqft | Sold | Price | $/sf | Match |
|---|---|---|---|---|---|---|---|
| 2138 E Fair Ave | 0.33mi | 4/2.0 | 2,706 (+2%) | 20mo | $44,800 | $17 | 65 |
| 4210 Holly Ave | 0.66mi | 4/2.0 | 2,528 (-4%) | 1mo | $37,000 | $15 | 61 |
| 4582 Clarence Ave | 0.66mi | 4/2.0 | 2,752 (+4%) | 4mo | $50,000 | $18 | 59 |
| 4418 Athlone Ave | 0.56mi | 5/2.0 (+1) | 2,686 (+2%) | 16mo | $52,000 | $19 | 53 |
| 4237 Holly Ave | 0.69mi | 4/2.0 | 2,332 (-12%) | 7mo | $156,900 | $67 | 43 |
| 4511 Red Bud Ave | 0.49mi | 5/3.0 (+1) | 2,388 (-10%) | 12mo | $220,000 | $92 | 42 |
Match score weights: distance 35% · size 25% · config 20% · recency 20%. Top-matched comps best support the ARV.
Projected returns pro-forma
-1.75% appreciation · 3.0% rent growth · sell at horizon
- IRR
- 25.9%
- Equity multiple
- 2.15×
- Total profit
- $30,871
- Equity at exit
- $19,756
- IRR
- 32.0%
- Equity multiple
- 4.15×
- Total profit
- $84,594
- Equity at exit
- $17,955
Cash invested: $26,880 (down + closing). Projections, not guarantees.
Landlord ↔ Tenant lean methodology
- Overall (STATE)
- 81 Strongly Landlord-Friendly
- State Missouri
- 81 Strongly Landlord-Friendly · R+10
- County
- — inherits STATE
- City
- — inherits STATE
ZIP-level market 63107
- Home prices YoY
- -1.9%
- Active inventory
- 58
- Price-to-rent
- 5.2×
Monthly cashflow live
- Estimated rent
- $1,537 medium interval (Pro) →
- Mortgage (P&I)
- −$503
- Tax from tax record
- −$22 /mo · $259/yr
- Insurance
- −$40
- HOA
- −$0
- Vacancy / Maint / Mgmt
- −$323
- Net cashflow
- $649
Break-even live
UW: 25.0% down · 7.5% · 30yr · 1.5% tax · 5.0% vac · 8.0% maint · 8.0% mgmt
Financing live
Cash to close
- Down payment
- $24,000
- Closing costs
- $2,880
- Reserves months
- —
- Total cash needed
- —
Loan-product check · same deal, 3 products live
Conventional
25% down · 7.5% · 30yr
- Down + closing
- —
- Monthly P&I
- —
- Monthly cashflow
- —
- DSCR
- —
- Eligible?
- —
Personal DTI + credit; lowest rate.
DSCR
20% down · 8.5% · 30yr
- Down + closing
- —
- Monthly P&I
- —
- Monthly cashflow
- —
- DSCR
- —
- Eligible?
- —
No personal income docs; deal must DSCR.
Hard money
10% down · 12.0% · 12mo
- Down + closing
- —
- Monthly P&I
- —
- Monthly cashflow
- —
- DSCR
- —
- Eligible?
- —
Short-term bridge; refi at stabilization.
Listing history 24 events
-
2026-06-18days on market $96,000 Active 84 DOM
-
2026-06-17days on market $96,000 Active 83 DOM
-
2026-06-16days on market $96,000 Active 82 DOM
-
2026-06-15days on market $96,000 Active 81 DOM
-
2026-06-13days on market $96,000 Active 79 DOM
-
2026-06-09days on market $96,000 Active 75 DOM
-
2026-06-08days on market $96,000 Active 74 DOM
-
2026-06-08days on market $96,000 Active 73 DOM
-
2026-06-05days on market $96,000 Active 70 DOM
-
2026-06-03days on market $96,000 Active 69 DOM
-
2026-06-02days on market $96,000 Active 68 DOM
-
2026-06-01days on market $96,000 Active 67 DOM
-
2026-05-31days on market $96,000 Active 66 DOM
-
2026-03-27status Active 182-char remark
Show marketing remark (182 chars)
Property has been gutted inside and framed ready for your plan. Property will need to be completed. Seller may let buyer assum the current loan, Great location closed to the new NGA.
-
2026-02-04$96,000 Active 182-char remark
Show marketing remark (182 chars)
Property has been gutted inside and framed ready for your plan. Property will need to be completed. Seller may let buyer assum the current loan, Great location closed to the new NGA.
-
2026-02-03historical $96,000 182-char remark
Show marketing remark (182 chars)
Property has been gutted inside and framed ready for your plan. Property will need to be completed. Seller may let buyer assum the current loan, Great location closed to the new NGA.
-
2024-10-24soldstatus
-
2021-10-06soldstatus $25,000
-
2021-09-22soldstatus Closed 30-char remark
Show marketing remark (30 chars)
Two family. Motivated seller!!
-
2021-09-02status Pending 30-char remark
Show marketing remark (30 chars)
Two family. Motivated seller!!
-
2021-08-24price $29,000 30-char remark
Show marketing remark (30 chars)
Two family. Motivated seller!!
-
2021-07-28price $30,000 30-char remark
Show marketing remark (30 chars)
Two family. Motivated seller!!
-
2021-07-19price $45,000 30-char remark
Show marketing remark (30 chars)
Two family. Motivated seller!!
-
2021-07-12$50,000 Active 30-char remark
Show marketing remark (30 chars)
Two family. Motivated seller!!
ⓘ Source: listings_history table (triggers on properties + properties_extension) + one-shot
backfill from property_details.listing_events for pre-trigger history.
Tax reassessment forecast MO · Resets to sale price
- Current annual tax
- $259 · $22/mo
- Projected year-2 tax
- $931 · $78/mo
- Expected delta
- +$672/yr (+$56/mo · 259.8%)
ⓘ Screening estimate from a state-policy table — verify with the county assessor before closing.
Climate risk First Street
- Flood 1/10 Low FEMA zone X (unshaded) · 0% chance over 30 yrs
- Wildfire 1/10 Low
- Heat 5/10 Major 7 d/yr ≥108°F today · 21 d/yr by 30 yrs out
- Wind 2/10 Low 100% chance of damaging wind over 30 yrs
- Air quality 4/10 Moderate 5 unhealthy d/yr today · 6 by 30 yrs out
Nearby sold comps map
Loading sold comps map…
Walkable amenities ~0.75 mi
Loading nearby amenities…
Taxation est. · year 1
- Rental income
- $18,444
- − Mortgage interest
- −$5,377
- − Property taxes
- −$259
- − Insurance
- −$480
- − Repairs & maintenance
- −$1,476
- − Management
- −$1,476
- − Depreciation
- −$2,793
- Taxable income
- $6,584
- Est. tax owed @ 24.0%
- −$1,580
- After-tax cash flow
- $6,210/yr
For passive investors: Depreciation is non-cash, so a rental often shows a tax loss while cash-flowing — sheltering income. Rental losses are passive: they offset passive income freely, and up to $25,000/yr can offset ordinary (W-2) income if you actively participate and your MAGI is under $100k (phasing out to $0 by $150k); unused losses carry forward. On sale, claimed depreciation is recaptured at up to 25%, and gains may owe capital-gains tax (a 1031 exchange can defer both). Figures are a year-1 estimate at your 24.0% rate — not tax advice; consult a CPA.
Schools (NCES district)
- District
- St. Louis City
- NCES district ID
- 2929280
- Math proficiency
- 10% ▼ -6.00%
- Reading proficiency
- 18% ▼ -3.00%
- Median HH income
- $35,685
- Composite
- 11.54/100
- National rank
- #9699
- State rank
- #312 of 324 in MO
Livability — St. Louis
No livability data for this city. (Only ~50 U.S. cities are tracked.)
Census & demographics
- Census place
- St. Louis, MO
- City population
- 283,259
- Population (ZIP)
- 9,082
Population outlook (St. Louis County) Hauer SSP2
- Today (2025)
- 315,737 people
- By 2030
- 313,865 · -0.6%
- By 2040
- 305,439 · -3.3%
- By 2050
- 296,529 · -6.1%
- By 2075
- 271,028 · -14.2%
- By 2100
- 255,359 · -19.1%
Race, ethnicity, and origin ACS 2023
- Neighborhood character
- Predominantly Black (89%)
- Race & ethnicity
- Black 89% White 8% Hispanic / Latino 2% Two or more races 2%
- Common ancestry
- Lithuanian 1%
- Foreign-born
- 1% · Canada
- Languages at home
- 98% English-only · Spanish 1%
Political lean MEDSL · St. Louis
- 2024 margin
- Solid D (+64.7) · D 81.4% · R 16.7% · Other 2.0%
- 2008→2024 swing
- -3.5pp toward R · 2008: 68.2pp · 2024: 64.7pp
- All cycles
- 2024: D+64.7 2020: D+66.2 2016: D+63.7 2012: D+66.6 2008: D+68.2
Not yet ingested
- Civics
- —
Market trends
- HPI YoY
- ▼ -1.75%
- Current HPI
- 92.7423
- Rent YoY
- —
- Metro
- —
- State GDP YoY
- ▲ 1.84%
- F500 in state
- 20
Industry mix (Fortune 500 HQ in MO)
| Industry | F500 HQs | Revenue |
|---|---|---|
| Healthcare | 1 | $163B |
|
||
| Insurance | 1 | $21B |
|
||
| Industrial Technology | 1 | $17B |
|
||
| Retail | 1 | $16B |
|
||
| Industrial Distribution | 1 | $10B |
|
||
| Utilities | 1 | $9B |
|
||
Price history
+92.0% since first listed11 events — show timeline
- 2026-03-27 Relisted — MARIS as Distributed by MLS Grid
- 2026-02-04 Listed $96,000 MARIS as Distributed by MLS Grid
- 2026-02-03 Coming Soon $96,000 MARIS as Distributed by MLS Grid
- 2024-10-24 Sold (Public Records) — Public Records
- 2021-10-06 Sold (Public Records) $25,000 Public Records
- 2021-09-22 Sold (MLS) — MARIS as Distributed by MLS Grid
- 2021-09-02 Pending — MARIS as Distributed by MLS Grid
- 2021-08-24 Price Changed $29,000 MARIS as Distributed by MLS Grid
- 2021-07-28 Price Changed $30,000 MARIS as Distributed by MLS Grid
- 2021-07-19 Price Changed $45,000 MARIS as Distributed by MLS Grid
- 2021-07-12 Listed $50,000 MARIS as Distributed by MLS Grid
Property tax history
+1.3%/yrLatest (2023): $259 · -1.8% YoY. Source: county tax records.
Cash-flow waterfall
monthlySold comps — $/sqft
last 12 mo · ≤1 miLoading sold comps…