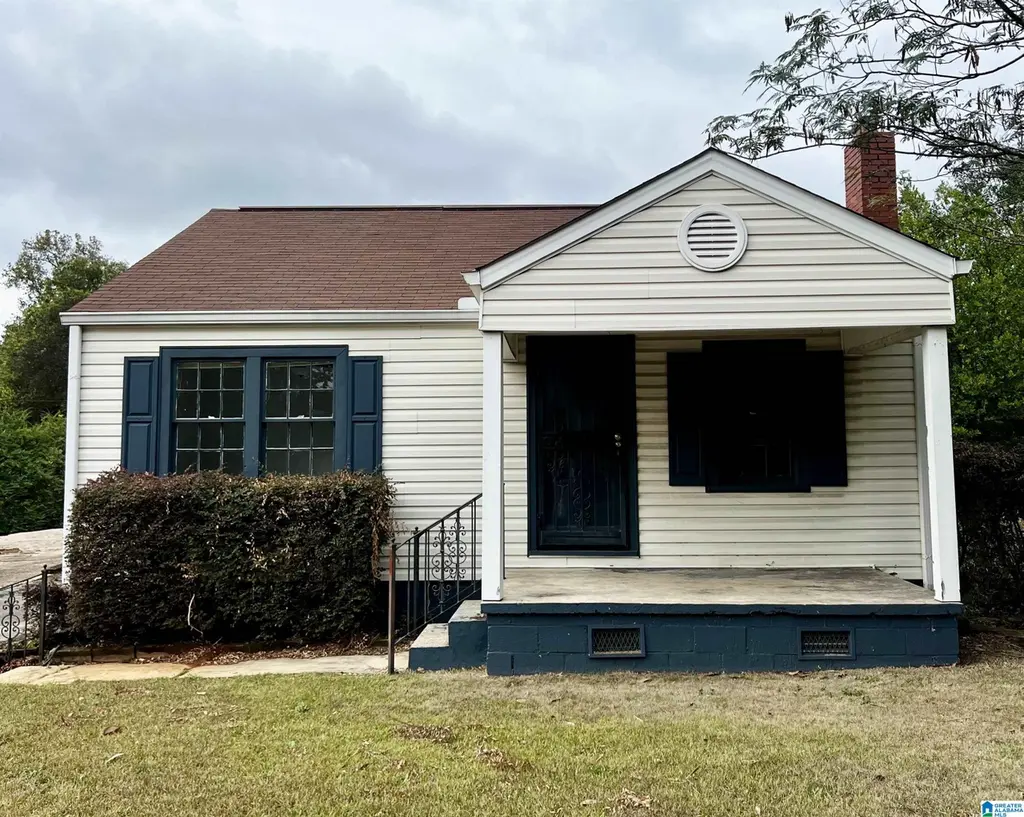
916 Crescent Ridge Rd E · Tuscaloosa, AL
Flood risk 1/10 · Minimal
- FEMA flood zone
- X (unshaded)
- Chance of flooding over 30 yrs
- 0.0%
- Est. flood insurance / yr
- $507 – $1,088
Fire risk 3/10 · Minor
- Est. fire insurance / yr
- $916 – $1,700
Heat risk 7/10 · Major
- Hot days now (above 108°F)
- 7 days/yr
- Hot days in 30 yrs
- 20 days/yr
Wind risk 6/10 · Moderate
- Chance of severe wind over 30 yrs
- 55.0%
Air-quality risk 3/10 · Minor
- Unhealthy air days now
- 2 days/yr
- Unhealthy air days in 30 yrs
- 3 days/yr
Risk factors via First Street. Map © Google.
Why this score? — see what drove the B- grade
The composite is a weighted blend of 9 inputs, each scored 0–100. Each bar is that input's sub-score; the figure is the points it added to the 100-point composite (weight × sub-score).
- Cash flow +25.7/30.0
- ARV discount +15.0/15.0
- DSCR +8.6/10.0
- 1% rule +6.8/10.0
- Rent growth +4.2/5.0
- Livability +3.9/5.0
- Schools +2.5/10.0
- Condition / age +2.5/5.0
- Appreciation +0.0/10.0
$149,900
🖨 Deal sheet 📄 Offer letter ✓ Due diligence
Listing remarks MLS
Charming 1940s Cottage! Just 3 miles from Bryant-Denny Stadium, this 3 bed, 2 bath home is full of character and care. Freshly painted with new carpet, original hardwoods underneath, and a 2011 roof. Features a 3-car detached garage with attached tile shed. A rare blend of vintage charm and modern updates—don’t miss it!
Key facts
- Original hardwoods
- Attached tile shed
- New carpet
Tags
Neighborhood map
What this means for you Summary
Snapshot
- This is a 3-bed/1.0-bath single-family listed at $150k.
Deal economics
- At list price, monthly cash flow is $361 ($4k/yr) — positive.
- The deal already cash-flows at list — no discount required.
- Meets the 1% rule at list price ($2k rent vs $150k).
- Recommended offer: $132k (12.0% below list) — sets the bar for market timing.
- Cap rate 9.2% vs local median 3.4% in Tuscaloosa — top-decile yield for the area; either an underpriced asset or a hidden risk that comps aren't pricing in. Stress-test before assuming the spread holds.
Location & tenants
- Location reads 77/100 on livability (#9 in AL, #2,909 nationally) — a middle-class / working-renter tenant base. Strengths: amenities A+, health & safety A+, cost of living A; Watch: crime F, employment D-.
- Tuscaloosa City (urban): math 19% / reading 40% proficiency, ranked #74 of 129 in AL (top 57%) — low school quality limits family demand, transient renter base, plan for 1-2y turnover.
- Market conditions: Rents rising fast (+6.8%/yr); 167 active listings in the ZIP; 16 comparable units currently listed for rent nearby; rentals lingering (median 44d on market — plan ~5-8 weeks vacancy on turnover, expect pricing pressure); 50% of comp listings sitting > 30 days — soft ceiling on asking rent; 622 units permitted in Tuscaloosa County in 2024 (69 in 5+ unit buildings).
- This rent runs 43% of the median local income ($49k/yr) — at the standard rent-burdened threshold; future hikes will face affordability resistance.
Forward outlook
- Local home prices are declining (-3.0%/yr); year-one equity from $1k of loan paydown is wiped out by about $4k of value loss. Plan a longer hold.
- Tuscaloosa County population projected at +26% by 2050 — long-run rental-demand tailwind backs the buy-and-hold thesis.
- At projected returns (-3.0% appreciation + 6.8% rent growth), your $42k cash investment doubles in ~8 years — after that, you're playing with house money.
Negotiation context
- It's been on market 229 days — a 12% lower offer ($132k) is reasonable based on typical stale-listing flexibility.
- 3 sale attempts since 12y ago; this cycle's ask has dropped $30k (17%) from the opening price — seller is motivated, your offer sets the floor, not the list.
- Current owner paid $23k; list at $150k implies a 557% gain — meaningful room to come down on a strong offer.
Risks & watch-outs
- Watch-outs: built in 1948 — expect roof / HVAC / electrical / plumbing capex.
- Climate carrying-cost: major wind risk, 55% chance of damaging wind over 30y; extreme-heat days projected 7→20/yr by 2055 (HVAC capex compounding) — expect insurance premiums to compound above CPI over the hold.
Questions for the listing agent
- It's been on market 229 days. Have you received any prior offers? Is the seller open to a 12% concession, seller financing, or rate buy-down credit?
- Built in 1948 — when were the roof, HVAC, electrical panel, plumbing, and water heater last replaced?
- Why hasn't it sold? Are there any deal-killer items the seller is aware of (foundation, flood, title, zoning, code violations)?
- Is there a deadline driving the sale (1031 exchange, divorce, estate, relocation)? That informs how much negotiation room exists.
- Crime grade is F in this area — have there been break-ins, vandalism, or insurance claims at this property in the last 3 years? What carrier currently insures it and at what premium?
- What's the average days-on-market for RENTAL listings here right now (not sales)? A rising rental-DOM trend means longer vacancies and softer asking-rent achievability than the comps imply.
- What's the recent tenant-quality profile in this submarket — average credit score on applications, eviction rate, late-payment / NSF rate, and stable-employment percentage? A property-management company in the area should have these aggregated.
- How much new for-sale + rental construction is in the pipeline within 1–3 miles? Heavy new supply typically softens prices + rents 12–24 months out; constrained supply supports both.
Investment metrics
- 1% rule
- 1.18% ✓
- Cap rate
- 9.18%
- Cash-on-cash
- 10.32%
- DSCR
- 1.46
- GRM
- 7.1
CMA / ARV
- ARV (median comp)
- $187,353
- List price
- $149,900
- Delta
- -19.99%
- Verdict
- UNDERPRICED
- Comps
- 20 within 1.0 mi
Show comp detail 12 sales within ~0.75 mi
| Address | Dist | Beds/Ba | Sqft | Sold | Price | $/sf | Match |
|---|---|---|---|---|---|---|---|
| 3738 Crescent Gardens Dr | 0.27mi | 3/2.0 | 1,227 (-4%) | 12mo | $190,800 | $156 | 67 |
| 3625 Crescent Gardens Dr | 0.24mi | 3/2.0 | 1,141 (-11%) | 2mo | $182,900 | $160 | 66 |
| 3626 Crescent Gardens Dr | 0.26mi | 3/2.0 | 1,146 (-10%) | 2mo | $183,000 | $160 | 65 |
| 4006 5th St E | 0.44mi | 2/1.0 (-1) | 1,255 (-2%) | 9mo | $155,000 | $124 | 64 |
| 3123 4th St E | 0.59mi | 3/1.0 | 1,198 (-6%) | 2mo | $75,000 | $63 | 61 |
| 607 41st Ave E | 0.39mi | 3/2.0 | 1,230 (-4%) | 13mo | $162,000 | $132 | 61 |
| 3701 Crescent Gardens Dr | 0.23mi | 3/2.0 | 1,103 (-14%) | 3mo | $193,000 | $175 | 60 |
| 3205 3rd St E | 0.63mi | 3/2.0 | 1,265 (-1%) | 12mo | $269,000 | $213 | 55 |
| 63 Juanita Dr | 0.72mi | 3/2.0 | 1,196 (-6%) | 2mo | $116,500 | $97 | 50 |
| 513 31st Ave E | 0.59mi | 3/1.0 | 1,100 (-14%) | 12mo | $199,000 | $181 | 40 |
| 67 Juanita Dr. Dr | 0.71mi | 3/2.0 | 1,184 (-7%) | 15mo | $123,500 | $104 | 38 |
| 37 Durrett Grove Grv | 0.69mi | 2/2.0 (-1) | 1,407 (+10%) | 13mo | $185,000 | $131 | 31 |
Match score weights: distance 35% · size 25% · config 20% · recency 20%. Top-matched comps best support the ARV.
Projected returns pro-forma
-3.0% appreciation · 6.81% rent growth · sell at horizon
- IRR
- 3.4%
- Equity multiple
- 1.14×
- Total profit
- $5,760
- Equity at exit
- $22,351
- IRR
- 16.3%
- Equity multiple
- 2.57×
- Total profit
- $65,960
- Equity at exit
- $12,961
Cash invested: $41,972 (down + closing). Projections, not guarantees.
Landlord ↔ Tenant lean methodology
- Overall (STATE)
- 90 Strongly Landlord-Friendly
- State Alabama
- 90 Strongly Landlord-Friendly · R+15
- County
- — inherits STATE
- City
- — inherits STATE
ZIP-level market 35404
- Rents YoY
- 6.8%
- Active inventory
- 167
- Price-to-rent
- 7.1×
Monthly cashflow live
- Estimated rent
- $1,768 high interval (Pro) →
- Mortgage (P&I)
- −$786
- Tax est. 1.5%
- −$187 /mo · $2,248/yr
- Insurance
- −$62
- HOA
- −$0
- Vacancy / Maint / Mgmt
- −$371
- Net cashflow
- $361
Break-even live
UW: 25.0% down · 7.5% · 30yr · 1.5% tax · 5.0% vac · 8.0% maint · 8.0% mgmt
Financing live
Cash to close
- Down payment
- $37,475
- Closing costs
- $4,497
- Reserves months
- —
- Total cash needed
- —
Loan-product check · same deal, 3 products live
Conventional
25% down · 7.5% · 30yr
- Down + closing
- —
- Monthly P&I
- —
- Monthly cashflow
- —
- DSCR
- —
- Eligible?
- —
Personal DTI + credit; lowest rate.
DSCR
20% down · 8.5% · 30yr
- Down + closing
- —
- Monthly P&I
- —
- Monthly cashflow
- —
- DSCR
- —
- Eligible?
- —
No personal income docs; deal must DSCR.
Hard money
10% down · 12.0% · 12mo
- Down + closing
- —
- Monthly P&I
- —
- Monthly cashflow
- —
- DSCR
- —
- Eligible?
- —
Short-term bridge; refi at stabilization.
Rent comps 16 comps
| Address | Beds | Baths | Sqft | Rent | $/sqft | DOM | Units | Dist |
|---|---|---|---|---|---|---|---|---|
| 3550 Crescent Gardens Dr Tuscaloosa, AL | 3.0 | 2.0 | 1116 | $1,575 | $1.41 | 43d | 1 | 0.27mi |
| 3218 Veterans Memorial Pkwy Tuscaloosa, AL | 3.0 | 3.0–3.5 | 1484 | $1,950 | $1.31 | 21d | 1 | 0.63mi |
| 419 30th Ave E Tuscaloosa, AL | 1.0–2.0 | 1.0–2.0 | 852 | $2,200 | $2.58 | 13d | 7 | 0.64mi |
| 419 30th Ave E Tuscaloosa, AL | 1.0–2.0 | 1.0–2.0 | 852 | $2,400 | $2.82 | 43d | 5 | 0.64mi |
| 4220 Keene Dr Tuscaloosa, AL | 2.0–3.0 | 2.0 | 1119 | $850 | $0.76 | 21d | 1 | 1.01mi |
| 5100 Old Birmingham Hwy Tuscaloosa, AL | 2.0 | 1.0–2.0 | 883 | $1,460 | $1.65 | 13d | 1 | 1.09mi |
| 2501 Veterans Memorial Pkwy Tuscaloosa, AL | 2.0 | 2.0 | 1078 | $975 | $0.90 | 13d | 1 | 1.14mi |
| 2501 Veterans Memorial Pkwy Tuscaloosa, AL | 2.0 | 2.0 | 1018 | $875 | $0.86 | 44d | 1 | 1.14mi |
| 922 23rd Ave E Tuscaloosa, AL | 1.0–2.0 | 1.0–2.0 | 1092 | $2,300 | $2.11 | 13d | 4 | 1.15mi |
| 1010 23rd Ave E Tuscaloosa, AL | 3.0 | 2.0 | 1251 | $1,500 | $1.20 | 43d | 1 | 1.17mi |
| 936 22nd Ave E Tuscaloosa, AL | 1.0–2.0 | 1.0–2.0 | 906 | $2,000 | $2.21 | 13d | 4 | 1.22mi |
| 829 21st Ave E Tuscaloosa, AL | 3.0 | 3.5 | 1792 | $2,569 | $1.43 | 43d | 1 | 1.24mi |
| 933 21st Ave E Tuscaloosa, AL | 1.0–2.0 | 1.0–2.0 | 906 | $2,150 | $2.37 | 43d | 2 | 1.25mi |
| 927 Kicker Rd Tuscaloosa, AL | 3.0 | 3.0 | 1412 | $3,075 | $2.18 | 21d | 2 | 1.32mi |
| 1722 13th St E Tuscaloosa, AL | 3.0 | 1.0 | 1200 | $1,100 | $0.92 | 43d | 1 | 1.48mi |
| 1515 Kicker Rd Tuscaloosa, AL | 1.0–2.0 | 1.0–2.0 | 1050 | $1,025 | $0.98 | 43d | 1 | 1.49mi |
Listing history 22 events
-
2026-06-18days on market $149,900 Active 229 DOM
-
2026-06-17days on market $149,900 Active 228 DOM
-
2026-06-16days on market $149,900 Active 227 DOM
-
2026-06-15days on market $149,900 Active 226 DOM
-
2026-06-14days on market $149,900 Active 224 DOM
-
2026-06-13days on market $149,900 Active 223 DOM
-
2026-06-10days on market $149,900 Active 221 DOM
-
2026-06-09days on market $149,900 Active 220 DOM
-
2026-06-08days on market $149,900 Active 219 DOM
-
2026-06-07days on market $149,900 Active 218 DOM
-
2026-06-05days on market $149,900 Active 215 DOM
-
2026-06-03days on market $149,900 Active 214 DOM
-
2026-06-02pricedays on market $149,900 Active 213 DOM
-
2026-06-01days on market $159,900 Active 212 DOM
-
2026-05-31days on market $159,900 Active 211 DOM
-
2026-05-30days on market $159,900 Active 210 DOM
-
2025-11-20price $159,900 333-char remark
Show marketing remark (333 chars)
Charming 1940s Cottage! Just 3 miles from Bryant-Denny Stadium, this 3 bed, 2 bath home is full of character and care. Freshly painted with new carpet, original hardwoods underneath, and a 2011 roof. Features a 3-car detached garage with attached tile shed. A rare blend of vintage charm and modern updates—don’t miss it!
-
2025-11-19price $159,900 323-char remark
Show marketing remark (323 chars)
Charming 1940s Cottage! Just 3 miles from Bryant-Denny Stadium, this 3 bed, 2 bath home is full of character and care. Freshly painted with new carpet, original hardwoods underneath, and a 2011 roof. Features a 3-car detached garage with attached tile shed. A rare blend of vintage charm and modern updates- Don't miss !!
-
2025-11-01$179,900 Active 333-char remark
Show marketing remark (333 chars)
Charming 1940s Cottage! Just 3 miles from Bryant-Denny Stadium, this 3 bed, 2 bath home is full of character and care. Freshly painted with new carpet, original hardwoods underneath, and a 2011 roof. Features a 3-car detached garage with attached tile shed. A rare blend of vintage charm and modern updates—don’t miss it!
-
2025-10-30$179,900 Active 323-char remark
Show marketing remark (323 chars)
Charming 1940s Cottage! Just 3 miles from Bryant-Denny Stadium, this 3 bed, 2 bath home is full of character and care. Freshly painted with new carpet, original hardwoods underneath, and a 2011 roof. Features a 3-car detached garage with attached tile shed. A rare blend of vintage charm and modern updates- Don't miss !!
-
2014-04-04$79,900
-
2011-07-20soldstatus $22,800
ⓘ Source: listings_history table (triggers on properties + properties_extension) + one-shot
backfill from property_details.listing_events for pre-trigger history.
Climate risk First Street
- Flood 1/10 Low FEMA zone X (unshaded) · 0% chance over 30 yrs
- Wildfire 3/10 Moderate
- Heat 7/10 Severe 7 d/yr ≥108°F today · 20 d/yr by 30 yrs out
- Wind 6/10 Major 55% chance of damaging wind over 30 yrs
- Air quality 3/10 Moderate 2 unhealthy d/yr today · 3 by 30 yrs out
Nearby sold comps map
Loading sold comps map…
Walkable amenities ~0.75 mi
Loading nearby amenities…
Taxation est. · year 1
- Rental income
- $21,218
- − Mortgage interest
- −$8,397
- − Property taxes
- −$2,248
- − Insurance
- −$750
- − Repairs & maintenance
- −$1,697
- − Management
- −$1,697
- − Depreciation
- −$4,361
- Taxable income
- $2,067
- Est. tax owed @ 24.0%
- −$496
- After-tax cash flow
- $3,835/yr
For passive investors: Depreciation is non-cash, so a rental often shows a tax loss while cash-flowing — sheltering income. Rental losses are passive: they offset passive income freely, and up to $25,000/yr can offset ordinary (W-2) income if you actively participate and your MAGI is under $100k (phasing out to $0 by $150k); unused losses carry forward. On sale, claimed depreciation is recaptured at up to 25%, and gains may owe capital-gains tax (a 1031 exchange can defer both). Figures are a year-1 estimate at your 24.0% rate — not tax advice; consult a CPA.
Schools (NCES district)
- District
- Tuscaloosa City
- NCES district ID
- 0103360
- Math proficiency
- 19% ▼ -24.00%
- Reading proficiency
- 40% ▼ -1.00%
- Median HH income
- $37,474
- Composite
- 24.51/100
- National rank
- #7647
- State rank
- #74 of 129 in AL
Livability — Tuscaloosa
- Score
- 77/100
- State rank
- #9
- US rank
- #2909
Category grades
Schools grade is shown separately in the Schools card above.
Census & demographics
- Census place
- Tuscaloosa, AL
- County
- Tuscaloosa County · 206,491 people
- City population
- 134,228
- Metro
- Tuscaloosa, AL
- Population (ZIP)
- 22,445
- Household income
- $48,932
- Rent vs Own
- Severe rent burden
- 1531.0
Population outlook (Tuscaloosa County) Hauer SSP2
- Today (2025)
- 228,293 people
- By 2030
- 240,551 · +5.4%
- By 2040
- 263,856 · +15.6%
- By 2050
- 286,491 · +25.5%
- By 2075
- 335,783 · +47.1%
- By 2100
- 370,520 · +62.3%
Race, ethnicity, and origin ACS 2023
- Neighborhood character
- Diverse neighborhood (Simpson 0.59)
- Race & ethnicity
- Black 46% White 44% Hispanic / Latino 8% Two or more races 5% Asian 1%
- Hispanic origin (detail)
- Mexican 8%
- Common ancestry
- Italian 2% Slovak 1% Serbian 1%
- Foreign-born
- 6% · Canada, South Korea
- Languages at home
- 91% English-only · Spanish 7%
Political lean MEDSL · Tuscaloosa
- 2024 margin
- Strong R (+20.4) · D 39.4% · R 59.8%
- 2008→2024 swing
- -4.4pp toward R · 2008: -16.0pp · 2024: -20.4pp
- All cycles
- 2024: R+20.4 2020: R+14.8 2016: R+19.5 2012: R+17.4 2008: R+16.0
Not yet ingested
- Civics
- —
Market trends
- HPI YoY
- ▼ -103.00%
- Current HPI
- 170.026
- Rent YoY
- ▲ 6.81%
- Metro
- Tuscaloosa, AL
- State GDP YoY
- ▲ 2.94%
- F500 in state
- 4
Industry mix (Fortune 500 HQ in AL)
| Industry | F500 HQs | Revenue |
|---|---|---|
| Financial Services | 1 | $8B |
|
||
| Healthcare | 1 | $5B |
|
||
Price history
+601.3% since first listed6 events — show timeline
- 2025-11-20 Price Changed $159,900 Greater Alabama MLS
- 2025-11-19 Price Changed $159,900 WAMLS
- 2025-11-01 Listed $179,900 Greater Alabama MLS
- 2025-10-30 Listed $179,900 WAMLS
- 2014-04-04 Listed $79,900 WAMLS
- 2011-07-20 Sold (Public Records) $22,800 Public Records
Property tax history
-1.5%/yrLatest (2025): $292 · +8.0% YoY. Source: county tax records.
Cash-flow waterfall
monthlySold comps — $/sqft
last 12 mo · ≤1 miLoading sold comps…