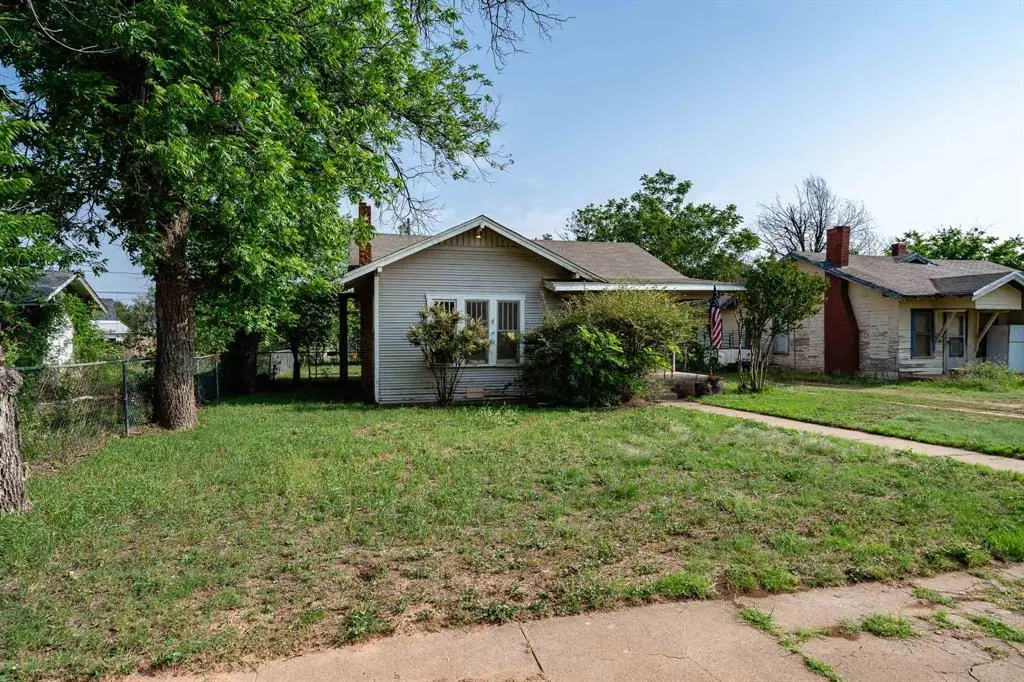
1015 E Reynolds St · Stamford, TX
Flood risk No data
- FEMA flood zone
- —
- Chance of flooding over 30 yrs
- —
- Est. flood insurance / yr
- —
Fire risk No data
- Est. fire insurance / yr
- —
Heat risk No data
- Hot days now (above threshold)
- —
- Hot days in 30 yrs
- —
Wind risk No data
- Chance of severe wind over 30 yrs
- —
Air-quality risk No data
- Unhealthy air days now
- —
- Unhealthy air days in 30 yrs
- —
Risk factors via First Street. Map © Google.
Why this score? — see what drove the C+ grade
The composite is a weighted blend of 9 inputs, each scored 0–100. Each bar is that input's sub-score; the figure is the points it added to the 100-point composite (weight × sub-score).
- Cash flow +28.2/30.0
- DSCR +10.0/10.0
- 1% rule +6.6/10.0
- Appreciation +5.0/10.0
- Schools +4.0/10.0
- Livability +3.5/5.0
- Rent growth +2.5/5.0
- Condition / age +2.5/5.0
- ARV discount +0.0/15.0
$79,900
🖨 Deal sheet 📄 Offer letter ✓ Due diligence
Listing remarks
Great investment opportunity in small-town West Texas living! This 2-bedroom, 1-bath home offers excellent potential as a rental property or affordable primary residence. With the continued influx of workforce demand in the area, properties like this are becoming increasingly desirable for investors seeking dependable rental income at an attractive price point. Conveniently located near the junior high and high schools, this home features original hardwood flooring, a covered front porch, a functional kitchen with an additional mud room, and a fenced backyard. The property also includes a detached 2-car garage with shop space, providing ample storage and workspace. Whether you are looking t
Key facts
- Covered front porch
- Functional kitchen
- Shop space
Tags
Property features AI
Finance
- Other: Property is not in a municipal utility district
- Financial info: Acceptable financing: Cash, Conventional, 1031 Exchange; No second mortgage reported
- HOA & community: No association
Exterior
- Parking: 2 covered parking spaces; Driveway; Detached garage structure present; 2-car garage
- Utilities: City water; City sewer; Electricity available and connected; Cable available; Utilities easement on property
- Home design: Single family residence; One story; Residential property; Subdivision: College Heights
- Construction: Built in 1928; Wood construction; Composition roof; Other structures: garage(s)
- Exterior features: Back yard with chain link fence; Alley access; Curbs
Interior
- Kitchen: No appliances included
- Bedrooms: 2 bedrooms (both on the main level)
- Bathrooms: 1 full bathroom
- Heating & cooling: Ceiling fan(s)
- Interior features: High speed internet available; Paneling; One living area; One dining area; Total rooms: 3
- Laundry & utility: No specific laundry appliances listed
Neighborhood map
What this means for you Summary
Snapshot
- This is a 2-bed/1.0-bath single-family listed at $80k.
Deal economics
- At list price, monthly cash flow is $254 ($3k/yr) — positive.
- The deal already cash-flows at list — no discount required.
- Meets the 1% rule at list price ($925 rent vs $80k).
- Recommended offer: $78k (3.0% below list) — sets the bar for market timing.
Location & tenants
- Location reads 70/100 on livability (#344 in TX) — a middle-class / working-renter tenant base. Strengths: crime A+, cost of living A+, housing A+; Watch: employment C-, health & safety C-, amenities F.
- Stamford ISD (town): math 50% / reading 46% proficiency, ranked #239 of 826 in TX (top 29%) — families likely to look elsewhere, expect single-tenant / working-renter base with shorter leases; 68% free/reduced lunch — lower-income household profile, screen leases tightly.
- Zoned schools: Oliver El (math 42% / reading 47%, grade F, #1,155 of 4,322 statewide, top 29%, 303 students, 75% FRL).
- Market conditions: 18 active listings in the ZIP; 1 units permitted in Jones County in 2024 (0 in 5+ unit buildings).
Forward outlook
- In year one you build about $596 of equity ($552 loan paydown + $44 appreciation (0.1% local appreciation)).
- Jones County population projected at +13% by 2050 — modest demand growth; plan on rents tracking national, not racing it.
- At projected returns (0.1% appreciation + 3.0% rent growth), your $22k cash investment doubles in ~6 years — after that, you're playing with house money.
Negotiation context
- It's been on market 41 days — a 3% lower offer ($78k) is reasonable based on typical stale-listing flexibility.
Risks & watch-outs
- Watch-outs: built in 1928 — expect roof / HVAC / electrical / plumbing capex.
Questions for the listing agent
- It's been on market 41 days. Have you received any prior offers? Is the seller open to a 3% concession, seller financing, or rate buy-down credit?
- Built in 1928 — when were the roof, HVAC, electrical panel, plumbing, and water heater last replaced?
- Is there a deadline driving the sale (1031 exchange, divorce, estate, relocation)? That informs how much negotiation room exists.
- Schools are D-rated, which usually means shorter tenancies and higher turnover. Who's the typical renter profile here, and what's been the actual vacancy rate?
- What's the average days-on-market for RENTAL listings here right now (not sales)? A rising rental-DOM trend means longer vacancies and softer asking-rent achievability than the comps imply.
- What's the recent tenant-quality profile in this submarket — average credit score on applications, eviction rate, late-payment / NSF rate, and stable-employment percentage? A property-management company in the area should have these aggregated.
- How much new for-sale + rental construction is in the pipeline within 1–3 miles? Heavy new supply typically softens prices + rents 12–24 months out; constrained supply supports both.
Investment metrics
- 1% rule
- 1.16% ✓
- Cap rate
- 10.12%
- Cash-on-cash
- 13.65%
- DSCR
- 1.61
- GRM
- 7.2
CMA / ARV
- ARV (median comp)
- $64,885
- List price
- $79,900
- Delta
- 23.14%
- Verdict
- OVERPRICED
- Comps
- 20 within 1.0 mi
Show comp detail 3 sales within ~0.75 mi
| Address | Dist | Beds/Ba | Sqft | Sold | Price | $/sf | Match |
|---|---|---|---|---|---|---|---|
| 708 S Orient St | 0.44mi | 2/1.0 | 888 (-9%) | 14mo | $21,900 | $25 | 53 |
| 802 S Orient St | 0.48mi | 3/2.0 (+1) | 1,104 (+13%) | 12mo | $159,900 | $145 | 36 |
| 601 E Rotan St | 0.48mi | 3/2.0 (+1) | 1,100 (+13%) | 14mo | $89,900 | $82 | 36 |
Match score weights: distance 35% · size 25% · config 20% · recency 20%. Top-matched comps best support the ARV.
Projected returns pro-forma
0.06% appreciation · 3.0% rent growth · sell at horizon
- IRR
- 13.0%
- Equity multiple
- 1.63×
- Total profit
- $14,047
- Equity at exit
- $23,422
- IRR
- 17.7%
- Equity multiple
- 2.95×
- Total profit
- $43,687
- Equity at exit
- $28,332
Cash invested: $22,372 (down + closing). Projections, not guarantees.
Landlord ↔ Tenant lean methodology
- Overall (STATE)
- 87 Strongly Landlord-Friendly
- State Texas
- 87 Strongly Landlord-Friendly · R+5
- County
- — inherits STATE
- City
- — inherits STATE
ZIP-level market 79553
- Home prices YoY
- 0.1%
- Active inventory
- 18
- Price-to-rent
- 7.2×
Monthly cashflow live
- Estimated rent
- $925 medium interval (Pro) →
- Mortgage (P&I)
- −$419
- Tax from tax record
- −$24 /mo · $283/yr
- Insurance
- −$33
- HOA
- −$0
- Vacancy / Maint / Mgmt
- −$194
- Net cashflow
- $254
Break-even live
UW: 25.0% down · 7.5% · 30yr · 1.5% tax · 5.0% vac · 8.0% maint · 8.0% mgmt
Financing live
Cash to close
- Down payment
- $19,975
- Closing costs
- $2,397
- Reserves months
- —
- Total cash needed
- —
Loan-product check · same deal, 3 products live
Conventional
25% down · 7.5% · 30yr
- Down + closing
- —
- Monthly P&I
- —
- Monthly cashflow
- —
- DSCR
- —
- Eligible?
- —
Personal DTI + credit; lowest rate.
DSCR
20% down · 8.5% · 30yr
- Down + closing
- —
- Monthly P&I
- —
- Monthly cashflow
- —
- DSCR
- —
- Eligible?
- —
No personal income docs; deal must DSCR.
Hard money
10% down · 12.0% · 12mo
- Down + closing
- —
- Monthly P&I
- —
- Monthly cashflow
- —
- DSCR
- —
- Eligible?
- —
Short-term bridge; refi at stabilization.
Listing history 20 events
-
2026-06-18days on market $79,900 Active 41 DOM
-
2026-06-17days on market $79,900 Active 40 DOM
-
2026-06-16days on market $79,900 Active 39 DOM
-
2026-06-15days on market $79,900 Active 38 DOM
-
2026-06-15days on market $79,900 Active 37 DOM
-
2026-06-13days on market $79,900 Active 36 DOM
-
2026-06-12days on market $79,900 Active 35 DOM
-
2026-06-09days on market $79,900 Active 32 DOM
-
2026-06-08days on market $79,900 Active 31 DOM
-
2026-06-08days on market $79,900 Active 30 DOM
-
2026-06-07days on market $79,900 Active 29 DOM
-
2026-06-03days on market $79,900 Active 26 DOM
-
2026-06-02days on market $79,900 Active 25 DOM
-
2026-06-01days on market $79,900 Active 24 DOM
-
2026-05-31days on market $79,900 Active 23 DOM
-
2026-05-08$79,900 Active 820-char remark
-
2025-05-30soldstatus
-
2009-03-03soldstatus
-
2008-03-14soldstatus
-
2007-11-28soldstatus
ⓘ Source: listings_history table (triggers on properties + properties_extension) + one-shot
backfill from property_details.listing_events for pre-trigger history.
Tax reassessment forecast TX · Resets to sale price
- Current annual tax
- $283 · $24/mo
- Projected year-2 tax
- $1,462 · $122/mo
- Expected delta
- +$1,179/yr (+$98/mo · 416.0%)
ⓘ Screening estimate from a state-policy table — verify with the county assessor before closing.
Nearby sold comps map
Loading sold comps map…
Walkable amenities ~0.75 mi
Loading nearby amenities…
Taxation est. · year 1
- Rental income
- $11,095
- − Mortgage interest
- −$4,476
- − Property taxes
- −$283
- − Insurance
- −$400
- − Repairs & maintenance
- −$888
- − Management
- −$888
- − Depreciation
- −$2,324
- Taxable income
- $1,837
- Est. tax owed @ 24.0%
- −$441
- After-tax cash flow
- $2,613/yr
For passive investors: Depreciation is non-cash, so a rental often shows a tax loss while cash-flowing — sheltering income. Rental losses are passive: they offset passive income freely, and up to $25,000/yr can offset ordinary (W-2) income if you actively participate and your MAGI is under $100k (phasing out to $0 by $150k); unused losses carry forward. On sale, claimed depreciation is recaptured at up to 25%, and gains may owe capital-gains tax (a 1031 exchange can defer both). Figures are a year-1 estimate at your 24.0% rate — not tax advice; consult a CPA.
Schools (NCES district)
- District
- Stamford ISD
- NCES district ID
- 4841400
- Math proficiency
- 50% ▲ 7.00%
- Reading proficiency
- 46% ▲ 5.00%
- Median HH income
- $37,780
- Composite
- 39.98/100
- National rank
- #3836
- State rank
- #239 of 826 in TX
Livability — Stamford
- Score
- 70/100
- State rank
- #344
- US rank
- #7510
Category grades
Schools grade is shown separately in the Schools card above.
Census & demographics
- Census place
- Stamford, TX
- Population (ZIP)
- 3,071
Population outlook (Jones County) Hauer SSP2
- Today (2025)
- 19,845 people
- By 2030
- 20,213 · +1.9%
- By 2040
- 21,446 · +8.1%
- By 2050
- 22,499 · +13.4%
- By 2075
- 23,272 · +17.3%
- By 2100
- 20,420 · +2.9%
Race, ethnicity, and origin ACS 2023
- Neighborhood character
- Diverse neighborhood (Simpson 0.58)
- Race & ethnicity
- White 51% Hispanic / Latino 39% Two or more races 8% Black 5% Asian 2%
- Hispanic origin (detail)
- Mexican 35%
- Common ancestry
- Slovak 5% Serbian 2% Danish 2%
- Foreign-born
- 5% · Canada
- Languages at home
- 80% English-only · Spanish 17% Other Indo-European 2% German/W. Germanic 1%
Political lean MEDSL · Jones
- 2024 margin
- Solid R (+73.2) · D 13.1% · R 86.2%
- 2008→2024 swing
- -27.1pp toward R · 2008: -46.1pp · 2024: -73.2pp
- All cycles
- 2024: R+73.2 2020: R+69.1 2016: R+65.4 2012: R+54.5 2008: R+46.1
Not yet ingested
- Civics
- —
Market trends
- HPI YoY
- ▲ 0.06%
- Current HPI
- 104.7578
- Rent YoY
- —
- Metro
- —
- State GDP YoY
- ▲ 3.95%
- F500 in state
- 110
Industry mix (Fortune 500 HQ in TX)
| Industry | F500 HQs | Revenue |
|---|---|---|
| Energy | 16 | $1,198B |
|
||
| Technology | 5 | $198B |
|
||
| Engineering / Construction | 4 | $72B |
|
||
| Energy Services | 3 | $60B |
|
||
| Utilities | 3 | $41B |
|
||
| Healthcare | 2 | $330B |
|
||
Price history
5 events — show timeline
- 2026-05-08 Listed $79,900 NTREIS
- 2025-05-30 Sold (Public Records) — Public Records
- 2009-03-03 Sold (Public Records) — Public Records
- 2008-03-14 Sold (Public Records) — Public Records
- 2007-11-28 Sold (Public Records) — Public Records
Property tax history
-7.0%/yrLatest (2025): $283 · -82.8% YoY. Source: county tax records.
Cash-flow waterfall
monthlySold comps — $/sqft
last 12 mo · ≤1 miLoading sold comps…