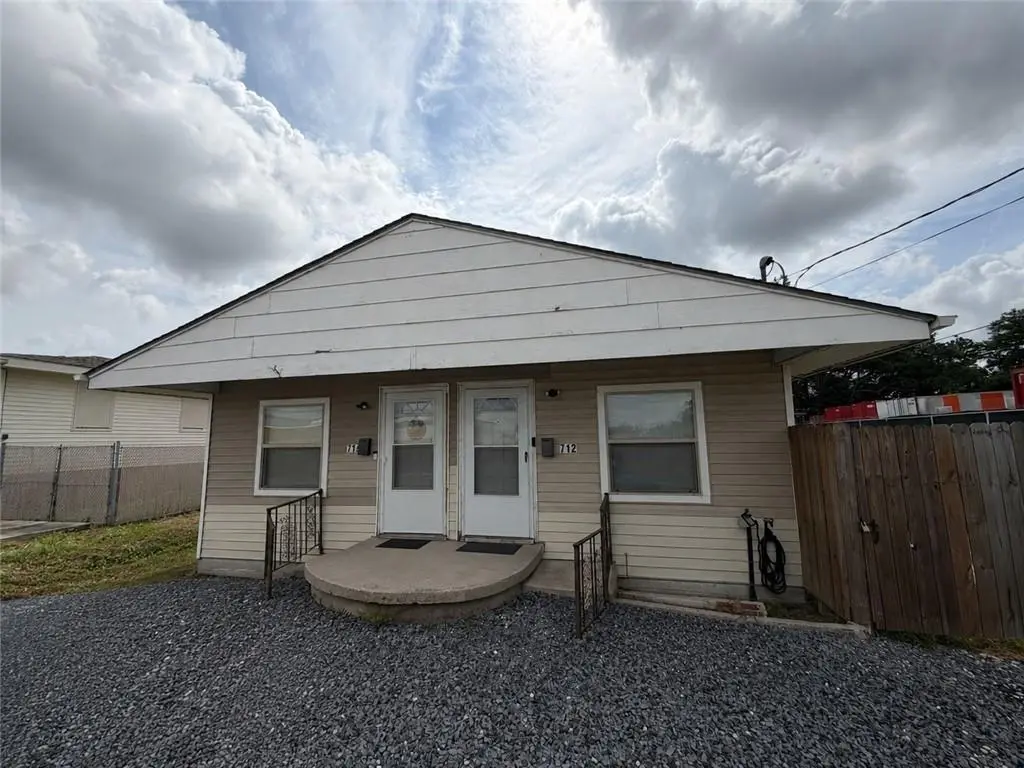
 Duplex
712-714 Hanson Pl · Kenner, LA
Flood risk 7/10 · Major
- FEMA flood zone
- X
- Chance of flooding over 30 yrs
- 0.6%
- Est. flood insurance / yr
- $507 – $1,088
Fire risk 1/10 · Minimal
- Est. fire insurance / yr
- $1,269 – $2,357
Heat risk 10/10 · Severe
- Hot days now (above 108°F)
- 7 days/yr
- Hot days in 30 yrs
- 21 days/yr
Wind risk 10/10 · Severe
- Chance of severe wind over 30 yrs
- 99.0%
Air-quality risk 3/10 · Minor
- Unhealthy air days now
- 2 days/yr
- Unhealthy air days in 30 yrs
- 3 days/yr
Risk factors via First Street. Map © Google.
Why this score? — see what drove the C grade
The composite is a weighted blend of 9 inputs, each scored 0–100. Each bar is that input's sub-score; the figure is the points it added to the 100-point composite (weight × sub-score).
- Cash flow +24.9/30.0
- DSCR +8.1/10.0
- ARV discount +7.5/15.0
- 1% rule +5.6/10.0
- Livability +3.9/5.0
- Rent growth +2.5/5.0
- Schools +2.5/10.0
- Condition / age +2.5/5.0
- Appreciation +0.0/10.0
$245,000
🖨 Deal sheet (PDF) 📄 Offer letter ✓ Due diligence
Multi-family units
County records classify this as Multi-Family (2-4 Unit). Listing-text estimate: 2 units. confirmed
Listing remarks MLS
Attention savvy investors seeking long-term growth or owner-occupants looking to live in one unit while generating rental income from the other. Exceptional investment opportunity in a high-demand area! This duplex sits on an oversized fenced lot and features a unique combination of one conventional style unit and one shotgun-style unit, offering flexibility for a variety of living arrangements. One side has been renovated and showcases beautiful countertops, a new water heater, and updated finishes, while the other unit presents an excellent value-add opportunity for renovation and customization. Both units are equipped with central A/C, and major improvements have already been completed, including plumbing and electrical wiring updated within the last two years. Currently income-producing with rents below market value, this property offers immediate cash flow and strong upside potential. The expansive fenced yard and oversized lot provide additional outdoor space with endless possibilities. A large shed adds valuable storage and functionality. Buyer to verify zoning and intended use. Don't miss this versatile property with unlimited potential.
Key facts
- Updated finishes
- New water heater
- Central a/c
Tags
Property features AI
Finance
- Financial info: Unit 714 rent: $800; Unit 712 rent: $1,000; Total units: 2
Exterior
- Parking: Off-street parking; Two to three-plus spaces available; Room for boat and RV parking
- Utilities: Public water; Public sewer
- Home design: Single-story multifamily building (2 units); Shingle roof; Raised foundation
- Construction: Shingle roof; Raised foundation
- Exterior features: Fenced yard; City lot; Oversized lot; Lot dimensions approximately 100 x 75
Interior
- Bedrooms: Unit 714: 2 bedrooms; Unit 712: 2 bedrooms
- Bathrooms: Unit 714: 1 full bathroom; Unit 712: 1 full bathroom
- Heating & cooling: Central heating; Central air; Window AC units
- Interior features: Average condition
Neighborhood map
What this means for you Summary
Snapshot
- This is a 2 × 2-bed/1.0-bath units multifamily listed at $245k.
Deal economics
- At list price, monthly cash flow is $461 ($6k/yr) — positive. Per door: $230/mo.
- The deal already cash-flows at list — no discount required.
- Meets the 1% rule at list price ($3k rent vs $245k).
- Recommended offer: $241k (1.5% below list) — sets the bar for market timing.
- Cap rate 8.9% vs local median 5.3% in Kenner — top-decile yield for the area; either an underpriced asset or a hidden risk that comps aren't pricing in. Stress-test before assuming the spread holds.
Location & tenants
- Location reads 78/100 on livability (#6 in LA, #2,414 nationally) — a middle-class / working-renter tenant base. Strengths: cost of living A+, housing A+, health & safety A+; Watch: amenities C-, employment C-, crime D.
- Jefferson Parish (suburban): math 24% / reading 34% proficiency, ranked #44 of 98 in LA (top 45%) — low school quality limits family demand, transient renter base, plan for 1-2y turnover; 70% free/reduced lunch — lower-income household profile, screen leases tightly.
- Zoned schools: Airline Park Academy For Advanced Studies (math 92% / reading 92%, grade A+, #3 of 646 statewide, top 0%, 418 students, 16% FRL); Bonnabel Magnet Academy High School (math 12% / reading 21%, grade F, #214 of 265 statewide, top 81%, 1,478 students, 52% FRL) — zoned schools average 34% FRL vs 70% district-wide (36 pts lower); this property's tenant base skews higher-income than the district average.
- Zoned-school proficiency averages 54% at this address vs 29% district-wide (+25 pts) — the actual schools serving this property are materially stronger than the Jefferson Parish average implies; a family-tenant draw the district grade alone would hide.
- Market conditions: 91 active listings in the ZIP; 10 comparable units currently listed for rent nearby; rentals at typical pace (median 25d on market — plan ~3-4 weeks tenant-placement turnaround); 40% of comp listings sitting > 30 days — soft ceiling on asking rent; 518 units permitted in Jefferson Parish in 2024 (43 in 5+ unit buildings).
- At $2,594/mo this rent would consume 60% of the median local household income ($51k/yr) (locally 1082% of renters already pay >50% of income on rent) — very limited rent-growth headroom before tenants either downsize or default.
Forward outlook
- Local home prices are declining (-3.0%/yr); year-one equity from $2k of loan paydown is wiped out by about $7k of value loss. Plan a longer hold.
Negotiation context
- It's been on market 17 days — a 2% lower offer ($241k) is reasonable based on typical stale-listing flexibility.
- 5 sale attempts since 3y ago with the ask held roughly flat each time — persistent listings suggest the price (not the market) is what's stuck; bring a comps-based counter.
- Current owner paid $160k; list at $245k implies a 53% gain — meaningful room to come down on a strong offer.
Risks & watch-outs
- Watch-outs: flood insurance adds $66/mo; built in 1943 — expect roof / HVAC / electrical / plumbing capex.
- Climate carrying-cost: major flood risk; severe wind risk, 99% chance of damaging wind over 30y; extreme-heat days projected 7→21/yr by 2055 (HVAC capex compounding) — expect insurance premiums to compound above CPI over the hold.
Questions for the listing agent
- Can we see the unit-by-unit rent roll, current vacancy, and any below-market leases? What's the average tenancy length?
- What capital expenditures (roof, boiler, parking lot, exteriors) have been made in the last 5 years, and what's planned in the next 2?
- Built in 1943 — when were the roof, HVAC, electrical panel, plumbing, and water heater last replaced?
- What's the actual annual flood-insurance premium (NFIP or private), and is the property in a SFHA with mandatory coverage?
- Is there a deadline driving the sale (1031 exchange, divorce, estate, relocation)? That informs how much negotiation room exists.
- Crime grade is D in this area — have there been break-ins, vandalism, or insurance claims at this property in the last 3 years? What carrier currently insures it and at what premium?
- What's the average days-on-market for RENTAL listings here right now (not sales)? A rising rental-DOM trend means longer vacancies and softer asking-rent achievability than the comps imply.
- What's the recent tenant-quality profile in this submarket — average credit score on applications, eviction rate, late-payment / NSF rate, and stable-employment percentage? A property-management company in the area should have these aggregated.
- How much new apartment / multifamily construction is in the pipeline within 1–3 miles? Heavy new supply (>2% of stock underway) typically softens rents 12–24 months out; light construction supports rent growth.
Investment metrics
- 1% rule
- 1.06% ✓
- Cap rate
- 8.87%
- Cash-on-cash
- 9.22%
- DSCR
- 1.41
- GRM
- 7.9
CMA / ARV
No comps found within radius.
Projected returns pro-forma
-3.0% appreciation · 3.0% rent growth · sell at horizon
- IRR
- -4.0%
- Equity multiple
- 0.85×
- Total profit
- $-10,394
- Equity at exit
- $36,530
- IRR
- 5.6%
- Equity multiple
- 1.42×
- Total profit
- $28,616
- Equity at exit
- $21,183
Cash invested: $68,600 (down + closing). Projections, not guarantees.
Landlord ↔ Tenant lean methodology
- Overall (STATE)
- 90 Strongly Landlord-Friendly
- State Louisiana
- 90 Strongly Landlord-Friendly · R+12
- County
- — inherits STATE
- City
- — inherits STATE
ZIP-level market 70062
- Active inventory
- 91
- Price-to-rent
- 15.7×
Monthly cashflow live
- Estimated rent
- $2,594 high interval (Pro) →
- Mortgage (P&I)
- −$1,285
- Tax from tax record
- −$135 /mo · $1,625/yr
- Insurance
- −$102
- Flood insurance flood zone
- −$66 /mo · $798/yr
- HOA
- −$0
- Vacancy / Maint / Mgmt
- −$545
- Net cashflow
- $461
Break-even live
Sensitivity live
| Price | -10% $599 | -5% $530 | +0% $461 | +5% $391 | +10% $322 |
|---|---|---|---|---|---|
| Rent | -10% $256 | -5% $358 | +0% $461 | +5% $563 | +10% $665 |
| Rate | -1.0pp $584 | -0.5pp $523 | base $461 | +0.5pp $397 | +1.0pp $332 |
2-unit breakdown (identical units grouped — click to expand)
| Units | Beds | Baths | Est. rent |
|---|---|---|---|
| 2× units | 2 | 1 | $2,594 |
| #1 | 2 | 1 | $1,297 |
| #2 | 2 | 1 | $1,297 |
| Total (2 units) | $2,594 | ||
UW: 25.0% down · 7.5% · 30yr · 1.5% tax · 5.0% vac · 8.0% maint · 8.0% mgmt
Financing live
Cash to close
- Down payment
- $61,250
- Closing costs
- $7,350
- Reserves months
- —
- Total cash needed
- —
Loan-product check · same deal, 3 products live
Conventional
25% down · 7.5% · 30yr
- Down + closing
- —
- Monthly P&I
- —
- Monthly cashflow
- —
- DSCR
- —
- Eligible?
- —
Personal DTI + credit; lowest rate.
DSCR
20% down · 8.5% · 30yr
- Down + closing
- —
- Monthly P&I
- —
- Monthly cashflow
- —
- DSCR
- —
- Eligible?
- —
No personal income docs; deal must DSCR.
Hard money
10% down · 12.0% · 12mo
- Down + closing
- —
- Monthly P&I
- —
- Monthly cashflow
- —
- DSCR
- —
- Eligible?
- —
Short-term bridge; refi at stabilization.
Rent comps 10 comps
| Address | Beds | Baths | Sqft | Rent | $/sqft | DOM | Units | Dist |
|---|---|---|---|---|---|---|---|---|
| 2603 Panama St Kenner, LA | 3.0 | 1.5 | 1400 | $1,400 | $1.00 | 25d | 1 | 1.40mi |
| 2617 Phoenix St Kenner, LA | 3.0 | 2.0 | 1350 | $1,800 | $1.33 | 45d | 1 | 1.43mi |
| 2604 Richland St Unit 1 Kenner, LA | 3.0 | 2.0 | 1442 | $1,500 | $1.04 | 5d | 1 | 1.44mi |
| 2611 Richland St Kenner, LA | 3.0 | 2.5 | 1443 | $2,200 | $1.52 | 3d | 1 | 1.45mi |
| 2127 Connecticut Ave Unit A Kenner, LA | 3.0 | 2.0 | 1310 | $2,000 | $1.53 | 45d | 1 | 1.46mi |
| 135 27th St Kenner, LA | 3.0 | 2.0 | 1205 | $1,200 | $1.00 | 5d | 1 | 1.47mi |
| 511 27th St Kenner, LA | 3.0 | 2.0 | 1200 | $1,575 | $1.31 | 5d | 1 | 1.47mi |
| 2609 Dawson Ave Kenner, LA | 3.0 | 2.0 | 1300 | $1,600 | $1.23 | 45d | 1 | 1.49mi |
| 1300 Webster St Kenner, LA | 3.0 | 2.0 | 1200 | $1,700 | $1.42 | 45d | 1 | 1.49mi |
| 1300 Webster St Kenner, LA | 3.0 | 2.0 | 1200 | $1,700 | $1.42 | 25d | 1 | 1.49mi |
Listing history 11 events
-
2026-06-21days on market $245,000 Active 17 DOM
-
2026-06-18days on market $245,000 Active 14 DOM
-
2026-06-17days on market $245,000 Active 13 DOM
-
2026-06-16days on market $245,000 Active 12 DOM
-
2026-06-15days on market $245,000 Active 11 DOM
-
2026-06-13days on market $245,000 Active 9 DOM
-
2026-06-10days on market $245,000 Active 6 DOM
-
2026-06-09days on market $245,000 Active 5 DOM
-
2026-06-08days on market $245,000 Active 4 DOM
-
2026-06-07remarks 699-char remark
-
2026-06-07$245,000 Active 3 DOM
ⓘ Source: listings_history table (triggers on properties + properties_extension) + one-shot
backfill from property_details.listing_events for pre-trigger history.
Tax reassessment forecast LA · Resets to sale price
- Current annual tax
- $1,625 · $135/mo
- Projected year-2 tax
- $1,625 · $135/mo
- Expected delta
- $0/yr ($0/mo · 0.0%)
ⓘ Screening estimate from a state-policy table — verify with the county assessor before closing.
Climate risk First Street
- Flood 7/10 Severe FEMA zone X · 60% chance over 30 yrs
- Wildfire 1/10 Low
- Heat 10/10 Extreme 7 d/yr ≥108°F today · 21 d/yr by 30 yrs out
- Wind 10/10 Extreme 99% chance of damaging wind over 30 yrs
- Air quality 3/10 Moderate 2 unhealthy d/yr today · 3 by 30 yrs out
Nearby sold comps map
Loading sold comps map…
Walkable amenities ~0.75 mi
Loading nearby amenities…
Taxation est. · year 1
- Rental income
- $31,128
- − Mortgage interest
- −$13,724
- − Property taxes
- −$1,625
- − Insurance
- −$2,022
- − Repairs & maintenance
- −$2,490
- − Management
- −$2,490
- − Depreciation
- −$7,127
- Taxable income
- $1,649
- Est. tax owed @ 24.0%
- −$396
- After-tax cash flow
- $5,131/yr
For passive investors: Depreciation is non-cash, so a rental often shows a tax loss while cash-flowing — sheltering income. Rental losses are passive: they offset passive income freely, and up to $25,000/yr can offset ordinary (W-2) income if you actively participate and your MAGI is under $100k (phasing out to $0 by $150k); unused losses carry forward. On sale, claimed depreciation is recaptured at up to 25%, and gains may owe capital-gains tax (a 1031 exchange can defer both). Figures are a year-1 estimate at your 24.0% rate — not tax advice; consult a CPA.
Schools (NCES district)
- District
- Jefferson Parish
- NCES district ID
- 2200840
- Math proficiency
- 24% ▼ -36.00%
- Reading proficiency
- 34% ▼ -30.00%
- Median HH income
- $48,421
- Composite
- 25.19/100
- National rank
- #7511
- State rank
- #44 of 98 in LA
Livability — Kenner
- Score
- 78/100
- State rank
- #6
- US rank
- #2414
Category grades
Schools grade is shown separately in the Schools card above.
Census & demographics
- Census place
- Kenner, LA
- County
- Jefferson Parish · 426,999 people
- City population
- 66,707
- Metro
- New Orleans-Metairie, LA
- Population (ZIP)
- 17,771
- Household income
- $51,477
- Rent vs Own
- Severe rent burden
- 1082.0
Population outlook (Jefferson County) Hauer SSP2
- Today (2025)
- 451,696 people
- By 2030
- 455,451 · +0.8%
- By 2040
- 458,308 · +1.5%
- By 2050
- 461,031 · +2.1%
- By 2075
- 476,351 · +5.5%
- By 2100
- 499,377 · +10.6%
Race, ethnicity, and origin ACS 2023
- Neighborhood character
- Highly diverse neighborhood (Simpson 0.70)
- Race & ethnicity
- Hispanic / Latino 37% Black 29% White 27% Two or more races 17% Asian 2% Native American 1%
- Hispanic origin (detail)
- Mexican 6% Cuban 2% Dominican 2%
- Common ancestry
- Lithuanian 5%
- Foreign-born
- 22% · Canada
- Languages at home
- 66% English-only · Spanish 32% Other Indo-European 2%
Political lean MEDSL · Jefferson
- 2024 margin
- R (+12.9) · D 42.5% · R 55.5% · Other 2.1%
- 2008→2024 swing
- +13.6pp toward D · 2008: -26.6pp · 2024: -12.9pp
- All cycles
- 2024: R+12.9 2020: R+11.1 2016: R+14.8 2012: R+18.4 2008: R+26.6
Not yet ingested
- Civics
- —
Market trends
- HPI YoY
- ▼ -108.55%
- Current HPI
- 105.3411
- Rent YoY
- —
- Metro
- New Orleans-Metairie, LA
- State GDP YoY
- ▲ 3.29%
- F500 in state
- 10
Industry mix (Fortune 500 HQ in LA)
| Industry | F500 HQs | Revenue |
|---|---|---|
| Telecommunications | 2 | $23B |
|
||
| Utilities | 1 | $12B |
|
||
| Wholesale / Distribution | 1 | $5B |
|
||
| Advertising | 1 | $2B |
|
||
Price history
+600.0% since first listed9 events — show timeline
- 2026-06-03 Listed $245,000 AcadianaMLS
- 2026-06-03 Listed $245,000 GSREIN
- 2024-06-03 Sold (Public Records) $160,000 Public Records
- 2024-05-31 Sold (MLS) $160,000 GSREIN
- 2024-04-04 Contingent — GSREIN
- 2023-10-19 Listed $185,000 AcadianaMLS
- 2023-10-19 Listed $185,000 GSREIN
- 2023-08-16 Listed $199,000 AcadianaMLS
- 1981-06-01 Sold (Public Records) $35,000 Public Records
Property tax history
+3.8%/yrLatest (2025): $1,625 · +21.5% YoY. Source: county tax records.
Cash-flow waterfall
monthlySold comps — $/sqft
last 12 mo · ≤1 miLoading sold comps…