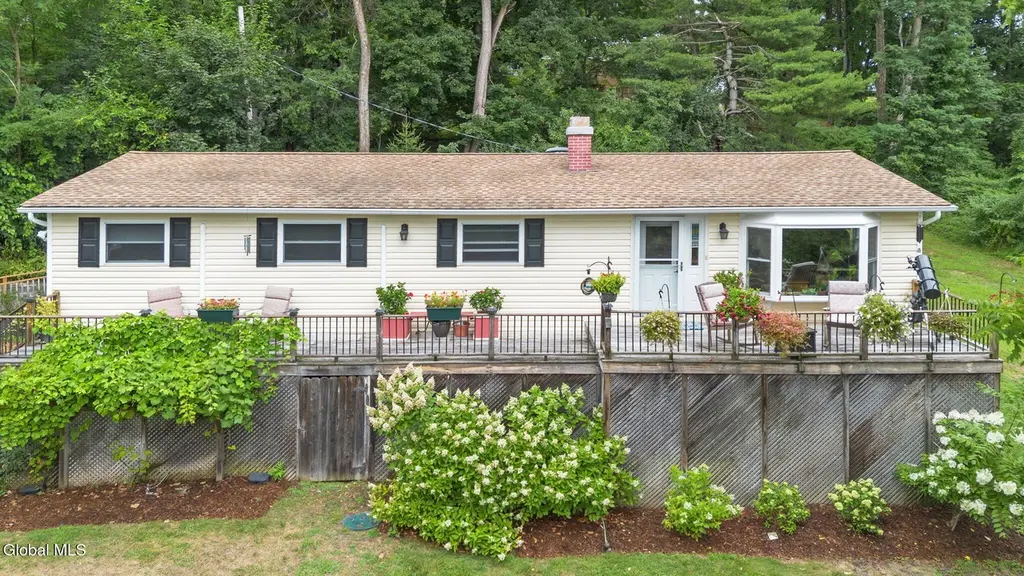
38 Green Acres Rd · Stottville, NY
Flood risk 1/10 · Minimal
- FEMA flood zone
- X
- Chance of flooding over 30 yrs
- 0.0%
- Est. flood insurance / yr
- $473 – $860
Fire risk 3/10 · Minor
- Est. fire insurance / yr
- $691 – $1,283
Heat risk 4/10 · Minor
- Hot days now (above 99°F)
- 7 days/yr
- Hot days in 30 yrs
- 16 days/yr
Wind risk 3/10 · Minor
- Chance of severe wind over 30 yrs
- 7.0%
Air-quality risk 2/10 · Minimal
- Unhealthy air days now
- 0 days/yr
- Unhealthy air days in 30 yrs
- 1 days/yr
Risk factors via First Street. Map © Google.
Why this score? — see what drove the D grade
The composite is a weighted blend of 9 inputs, each scored 0–100. Each bar is that input's sub-score; the figure is the points it added to the 100-point composite (weight × sub-score).
- Appreciation +10.0/10.0
- Cash flow +7.2/30.0
- ARV discount +7.0/15.0
- Rent growth +5.0/5.0
- Schools +3.6/10.0
- Livability +2.9/5.0
- Condition / age +2.5/5.0
- 1% rule +1.7/10.0
- DSCR +1.4/10.0
$399,900
🖨 Deal sheet 📄 Offer letter ✓ Due diligence
Listing remarks
Tucked away on a private half- acre setting backing to protected nature preserve land, this charming ranch offers the perfect blend of tranquility and convenience. The home welcomes you with an inviting front porch that opens to a sun filled living area, separate dining area and beautiful kitchen with a lot of upgraded appliances for easy living. All three bedrooms are conveniently located on the main level. The finished lower level has a classic brick fireplace, excellent potential for a media room, home office, workout space or additional lounge area with 1/2 bath, giving this home flexibility to adapt to your lifestyle. The owners added an elevator for convenience where stairs use to be,
Key facts
- Inviting front porch
- Beautiful kitchen
- Separate dining area
Tags
Property features AI
Exterior
- Parking: Attached garage with 2 garage spaces; Total parking for 8 vehicles; Garage has a workshop area and garage door opener; Under-residence parking and paved driveway
- Security: Smoke detectors; Carbon monoxide detectors
- Utilities: Public water; Septic tank sewer; Electric with circuit breakers and a generator
- Home design: Single-family residence; Updated/remodeled condition
- Construction: Vinyl siding; Asphalt roof
- Exterior features: Deck; Front porch; Paved driveway and drive-paved exterior; Exterior lighting; Storage shed(s)
Interior
- Kitchen: Dishwasher; Electric oven; Range; Range hood; Refrigerator
- Bedrooms: Primary bedroom on the first floor; Additional bedrooms on the first floor
- Flooring: Tile; Carpet; Hardwood
- Bathrooms: Two full bathrooms (both on the first floor); One half bathroom (in the basement)
- Heating & cooling: Electric heating with baseboard and ductless options; Ductless cooling
- Interior features: High-speed internet; Paddle ceiling fan; Wall paneling; Ceramic tile bath; Chair rail; Elevator; French doors; Mirrored closet doors; Sliding doors; Wood window frames; Bay window; One wood-burning fireplace in the family room; Finished, heated full basement with interior entry and walk-out access; 12 total rooms
- Laundry & utility: Main-level laundry room; Washer/Dryer included
Neighborhood map
What this means for you Summary
Snapshot
- This is a 3-bed/2.5-bath single-family listed at $400k.
Deal economics
- At list price, monthly cash flow is $-549 ($-7k/yr) — negative.
- To cash-flow at today's rent, offer at most $303k (24.2% below list).
- To meet the 1% rule (rent ≥ 1% of price), the offer needs to be $267k (33.3% below list).
- Recommended offer: $267k (33.3% below list) — sets the bar for 1% rule.
Location & tenants
- Location reads 58/100 on livability (#1,070 in NY) — a working-class tenant base; expect higher turnover. Strengths: crime A, housing A-; Watch: employment D+, schools F, amenities F.
- Hudson City School District (town): math 38% / reading 47% proficiency, ranked #494 of 590 in NY (top 84%) — families likely to look elsewhere, expect single-tenant / working-renter base with shorter leases.
- Market conditions: Rents rising fast (+10.9%/yr); 161 active listings in the ZIP; 1 comparable units currently listed for rent nearby; 136 units permitted in Columbia County in 2024 (0 in 5+ unit buildings).
- This rent runs 44% of the median local income ($73k/yr) — at the standard rent-burdened threshold; future hikes will face affordability resistance.
Forward outlook
- In year one you build about $43k of equity ($3k loan paydown + $40k appreciation (10.0% local appreciation)).
- Columbia County population projected at -22% by 2050 — secular population decline; favor cash flow + early exit over multi-decade hold.
- By year 2, paydown + projected appreciation supports a ~$69k cash-out refi (75% LTV) — recoverable capital for the next deal without selling this one.
Negotiation context
- Only 10 days on market — expect competitive offers; lowballing is unlikely to land.
- Current owner paid $130k; list at $400k implies a 208% gain — meaningful room to come down on a strong offer.
Questions for the listing agent
- What do current leases actually rent for vs. the listed asking? Can we see a recent rent roll and the last 12 months of T-12 income?
- Built in 1973 — when were the roof, HVAC, electrical panel, plumbing, and water heater last replaced?
- Is there a deadline driving the sale (1031 exchange, divorce, estate, relocation)? That informs how much negotiation room exists.
- Schools are F-rated, which usually means shorter tenancies and higher turnover. Who's the typical renter profile here, and what's been the actual vacancy rate?
- The area grade is low — what's the realistic commute time and amenity access for the typical tenant pool here? Any planned neighborhood developments (good or bad) we should know about?
- What's the average days-on-market for RENTAL listings here right now (not sales)? A rising rental-DOM trend means longer vacancies and softer asking-rent achievability than the comps imply.
- What's the recent tenant-quality profile in this submarket — average credit score on applications, eviction rate, late-payment / NSF rate, and stable-employment percentage? A property-management company in the area should have these aggregated.
- How much new for-sale + rental construction is in the pipeline within 1–3 miles? Heavy new supply typically softens prices + rents 12–24 months out; constrained supply supports both.
Investment metrics
- 1% rule
- 0.67% ✗
- Cap rate
- 4.65%
- Cash-on-cash
- -5.88%
- DSCR
- 0.74
- GRM
- 12.5
CMA / ARV
- ARV (on-the-fly)
- $395,616
- Comps found
- 5
Show comp detail 5 sales within ~0.75 mi
| Address | Dist | Beds/Ba | Sqft | Sold | Price | $/sf | Match |
|---|---|---|---|---|---|---|---|
| 460 Joslen Blvd | 0.58mi | 3/1.0 | 1,148 (-8%) | 10mo | $400,000 | $348 | 45 |
| 428 Joslen Boulevard Blvd | 0.68mi | 3/2.0 | 1,232 (-1%) | 24mo | $435,000 | $353 | 44 |
| 440 Joslen Blvd | 0.65mi | 3/1.0 | 1,136 (-9%) | 15mo | $327,000 | $288 | 36 |
| 424 Joslen Boulevard Blvd | 0.69mi | 4/1.0 (+1) | 1,152 (-8%) | 12mo | $365,000 | $317 | 34 |
| 10 Joslen Heights Road Rd | 0.57mi | 3/1.0 | 1,408 (+13%) | 18mo | $385,000 | $273 | 31 |
Match score weights: distance 35% · size 25% · config 20% · recency 20%. Top-matched comps best support the ARV.
Projected returns pro-forma
10.0% appreciation · 8.0% rent growth · sell at horizon
- IRR
- 21.5%
- Equity multiple
- 2.76×
- Total profit
- $196,912
- Equity at exit
- $360,262
- IRR
- 20.5%
- Equity multiple
- 6.74×
- Total profit
- $642,232
- Equity at exit
- $776,918
Cash invested: $111,972 (down + closing). Projections, not guarantees.
Landlord ↔ Tenant lean methodology
- Overall (STATE)
- 15 Strongly Tenant-Friendly
- State New York
- 15 Strongly Tenant-Friendly · D+10
- County
- — inherits STATE
- City
- — inherits STATE
ZIP-level market 12534
- Home prices YoY
- 5.6%
- Rents YoY
- 10.9%
- Active inventory
- 161
- Price-to-rent
- 12.5×
Monthly cashflow live
- Estimated rent
- $2,667 medium interval (Pro) →
- Mortgage (P&I)
- −$2,097
- Tax from tax record
- −$392 /mo · $4,707/yr
- Insurance
- −$167
- HOA
- −$0
- Vacancy / Maint / Mgmt
- −$560
- Net cashflow
- $-549
Break-even live
UW: 25.0% down · 7.5% · 30yr · 1.5% tax · 5.0% vac · 8.0% maint · 8.0% mgmt
Financing live
Cash to close
- Down payment
- $99,975
- Closing costs
- $11,997
- Reserves months
- —
- Total cash needed
- —
Loan-product check · same deal, 3 products live
Conventional
25% down · 7.5% · 30yr
- Down + closing
- —
- Monthly P&I
- —
- Monthly cashflow
- —
- DSCR
- —
- Eligible?
- —
Personal DTI + credit; lowest rate.
DSCR
20% down · 8.5% · 30yr
- Down + closing
- —
- Monthly P&I
- —
- Monthly cashflow
- —
- DSCR
- —
- Eligible?
- —
No personal income docs; deal must DSCR.
Hard money
10% down · 12.0% · 12mo
- Down + closing
- —
- Monthly P&I
- —
- Monthly cashflow
- —
- DSCR
- —
- Eligible?
- —
Short-term bridge; refi at stabilization.
Rent comps 1 comps
| Address | Beds | Baths | Sqft | Rent | $/sqft | DOM | Units | Dist |
|---|---|---|---|---|---|---|---|---|
| 540 Joslen Blvd Hudson, NY | 1.0–2.0 | 1.0–2.0 | 733 | $2,250 | $3.07 | 21d | 1 | 0.56mi |
Listing history 9 events
-
2026-06-17status $399,900 Pending 10 DOM
-
2026-06-16days on market $399,900 Active 10 DOM
-
2026-06-15days on market $399,900 Active 9 DOM
-
2026-06-14days on market $399,900 Active 7 DOM
-
2026-06-12days on market $399,900 Active 6 DOM
-
2026-06-09days on market $399,900 Active 3 DOM
-
2026-06-08days on market $399,900 Active 2 DOM
-
2026-06-07remarks 699-char remark
-
2026-06-07$399,900 Active 1 DOM
ⓘ Source: listings_history table (triggers on properties + properties_extension) + one-shot
backfill from property_details.listing_events for pre-trigger history.
Tax reassessment forecast NY · Partial reset (capped growth)
- Current annual tax
- $4,707 · $392/mo
- Projected year-2 tax
- $5,733 · $478/mo
- Expected delta
- +$1,026/yr (+$85/mo · 21.8%)
ⓘ Screening estimate from a state-policy table — verify with the county assessor before closing.
Climate risk First Street
- Flood 1/10 Low FEMA zone X · 0% chance over 30 yrs
- Wildfire 3/10 Moderate
- Heat 4/10 Moderate 7 d/yr ≥99°F today · 16 d/yr by 30 yrs out
- Wind 3/10 Moderate 7% chance of damaging wind over 30 yrs
- Air quality 2/10 Low 0 unhealthy d/yr today · 1 by 30 yrs out
Nearby sold comps map
Loading sold comps map…
Walkable amenities ~0.75 mi
Loading nearby amenities…
Taxation est. · year 1
- Rental income
- $32,008
- − Mortgage interest
- −$22,401
- − Property taxes
- −$4,707
- − Insurance
- −$2,000
- − Repairs & maintenance
- −$2,561
- − Management
- −$2,561
- − Depreciation
- −$11,633
- Taxable loss
- −$13,854
- Est. tax savings @ 24.0%
- +$3,325
- After-tax cash flow
- $-3,261/yr
For passive investors: Depreciation is non-cash, so a rental often shows a tax loss while cash-flowing — sheltering income. Rental losses are passive: they offset passive income freely, and up to $25,000/yr can offset ordinary (W-2) income if you actively participate and your MAGI is under $100k (phasing out to $0 by $150k); unused losses carry forward. On sale, claimed depreciation is recaptured at up to 25%, and gains may owe capital-gains tax (a 1031 exchange can defer both). Figures are a year-1 estimate at your 24.0% rate — not tax advice; consult a CPA.
Schools (NCES district)
- District
- Hudson City School District
- NCES district ID
- 3614940
- Math proficiency
- 38% ▲ 4.00%
- Reading proficiency
- 47% ▲ 7.00%
- Median HH income
- $44,663
- Composite
- 36.03/100
- National rank
- #4779
- State rank
- #494 of 590 in NY
Livability — Stottville
- Score
- 58/100
- State rank
- #1070
- US rank
- #21454
Category grades
Schools grade is shown separately in the Schools card above.
Census & demographics
- Census place
- Stottville, NY
- County
- Columbia County · 17,176 people
- City population
- 184
- Metro
- Hudson, NY
- Population (ZIP)
- 17,176
- Household income
- $72,741
- Rent vs Own
- Severe rent burden
- 1083.0
Population outlook (Columbia County) Hauer SSP2
- Today (2025)
- 58,662 people
- By 2030
- 56,557 · -3.6%
- By 2040
- 51,324 · -12.5%
- By 2050
- 45,790 · -21.9%
- By 2075
- 35,232 · -39.9%
- By 2100
- 25,846 · -55.9%
Race, ethnicity, and origin ACS 2023
- Neighborhood character
- Predominantly White (74%)
- Race & ethnicity
- White 74% Two or more races 7% Black 7% Hispanic / Latino 7% Asian 6%
- Hispanic origin (detail)
- Mexican 2% Puerto Rican 1%
- Common ancestry
- Lithuanian 4% Romanian 4% Iranian 3%
- Foreign-born
- 10% · Canada, China
- Languages at home
- 88% English-only · Spanish 5% Other Indo-European 3% Chinese 1%
Political lean MEDSL · Columbia
- 2024 margin
- D (+14.7) · D 57.4% · R 42.6%
- 2008→2024 swing
- +1.3pp toward D · 2008: 13.4pp · 2024: 14.7pp
- All cycles
- 2024: D+14.7 2020: D+16.7 2016: D+1.4 2012: D+11.7 2008: D+13.4
Not yet ingested
- Civics
- —
Market trends
- HPI YoY
- ▲ 25.98%
- Current HPI
- 490.0412
- Rent YoY
- ▲ 10.88%
- Metro
- Hudson, NY
- State GDP YoY
- ▲ 2.60%
- F500 in state
- 92
Industry mix (Fortune 500 HQ in NY)
| Industry | F500 HQs | Revenue |
|---|---|---|
| Financial Services | 10 | $950B |
|
||
| Consumer Goods | 9 | $162B |
|
||
| Insurance | 4 | $225B |
|
||
| Telecommunications | 2 | $144B |
|
||
| Pharmaceuticals | 2 | $112B |
|
||
| Media / Entertainment | 2 | $69B |
|
||
Price history
+207.6% since first listed2 events — show timeline
- 2026-06-06 Listed $399,900 Global MLS
- 2004-10-12 Sold (Public Records) $130,000 Public Records
Property tax history
+2.1%/yrLatest (2025): $4,707 · +16.6% YoY. Source: county tax records.
Cash-flow waterfall
monthlySold comps — $/sqft
last 12 mo · ≤1 miLoading sold comps…