 Duplex
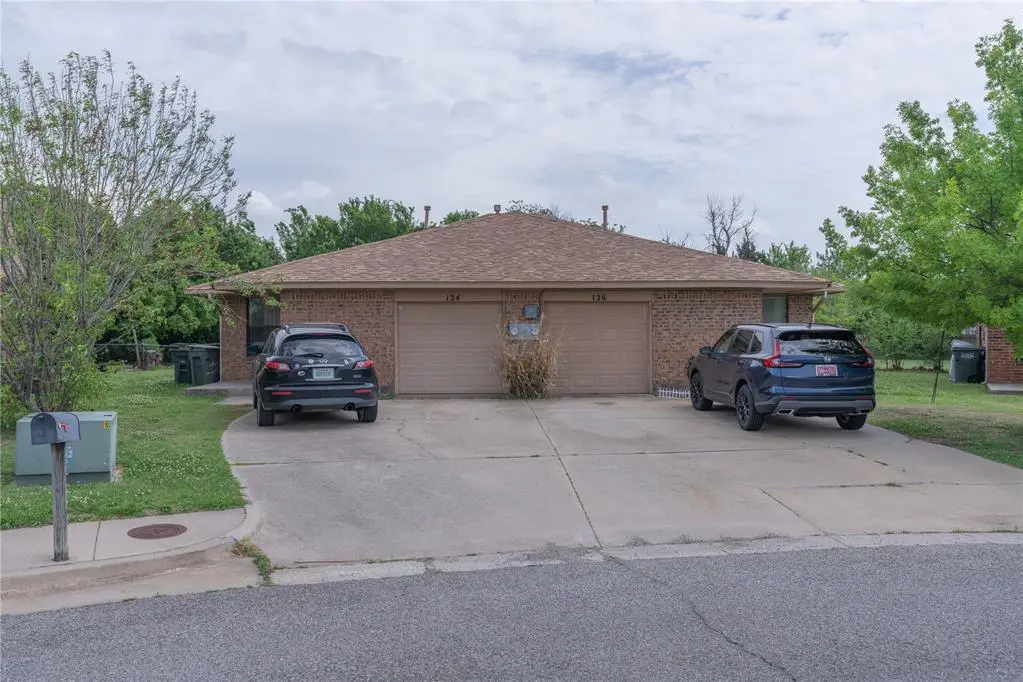
124 Barrett Pl · Edmond, OK
Flood risk 1/10 · Minimal
- FEMA flood zone
- X (unshaded)
- Chance of flooding over 30 yrs
- 0.0%
- Est. flood insurance / yr
- $507 – $1,088
Fire risk 2/10 · Minimal
- Est. fire insurance / yr
- $2,463 – $4,575
Heat risk 6/10 · Moderate
- Hot days now (above 108°F)
- 7 days/yr
- Hot days in 30 yrs
- 19 days/yr
Wind risk 2/10 · Minimal
- Chance of severe wind over 30 yrs
- 3.0%
Air-quality risk 2/10 · Minimal
- Unhealthy air days now
- 2 days/yr
- Unhealthy air days in 30 yrs
- 2 days/yr
Risk factors via First Street. Map © Google.
Why this score? — see what drove the C grade
The composite is a weighted blend of 9 inputs, each scored 0–100. Each bar is that input's sub-score; the figure is the points it added to the 100-point composite (weight × sub-score).
- Cash flow +24.1/30.0
- DSCR +7.8/10.0
- ARV discount +7.5/15.0
- 1% rule +5.8/10.0
- Livability +3.9/5.0
- Schools +3.6/10.0
- Rent growth +3.5/5.0
- Condition / age +2.5/5.0
- Appreciation +0.0/10.0
$275,000
🖨 Deal sheet (PDF) 📄 Offer letter ✓ Due diligence
Multi-family units
County records classify this as Multi-Family (2-4 Unit). Listing-text estimate: 2 units. confirmed
Listing remarks
Located in the heart of Edmond, this prime duplex presents an unbeatable opportunity for investors. Each unit offers a functional 2-bedroom, 1-bathroom layout, complete with its own private fenced yard and a 1-car attached garage for added convenience and security. The property’s incredible location is a major draw for tenants, situated within walking distance of the University of Central Oklahoma (UCO), making it an ideal choice for college students or university staff. Residents will enjoy being just minutes from the vibrant dining, shopping, and nightlife of downtown Edmond and the Railyard district, as well as easy access to local parks and the Edmond Farmer's Market. Whether you'
Key facts
- Private fenced yard
- 0.37 acre lot
- Built 1981
Tags
Property features AI
Finance
- Other: Located in Sunridge Addition to Edmond
- Financial info: Listing accepts Cash, Conventional, FHA or VA; Not assumable; Current price: $275,000; Days on market: 14
Exterior
- Home design: Duplex (residential income); Existing property
- Construction: Brick construction; Composition roof; Slab foundation; Built (existing structure)
- Exterior features: Interior lot
Interior
- Bedrooms: 4 bedrooms
- Bathrooms: 2 full bathrooms
- Interior features: Occupancy: currently rented/occupied
Neighborhood map
What this means for you Summary
Snapshot
- This is a 2 × 2-bed/1.0-bath units multifamily listed at $275k.
Deal economics
- At list price, monthly cash flow is $542 ($6k/yr) — positive. Per door: $271/mo.
- The deal already cash-flows at list — no discount required.
- Meets the 1% rule at list price ($3k rent vs $275k).
- Recommended offer: $267k (3.0% below list) — sets the bar for market timing.
- Cap rate 8.7% vs local median 3.4% in Edmond — top-decile yield for the area; either an underpriced asset or a hidden risk that comps aren't pricing in. Stress-test before assuming the spread holds.
Location & tenants
- Location reads 78/100 on livability (#6 in OK, #2,383 nationally) — a middle-class / working-renter tenant base. Strengths: employment A+, housing A+, crime A-; Watch: health & safety C-, commute F.
- Edmond (suburban): math 38% / reading 40% proficiency, ranked #11 of 270 in OK (top 4%) — families likely to look elsewhere, expect single-tenant / working-renter base with shorter leases.
- Zoned schools: Ida Freeman Es (math 17% / reading 17%, grade F, #540 of 845 statewide, top 68%, 464 students, 0% FRL); North Hs (math 47% / reading 57%, grade D+, #1 of 447 statewide, top 0%, 2,555 students, 0% FRL) — zoned schools average 0% FRL vs 22% district-wide (22 pts lower); this property's tenant base skews higher-income than the district average.
- Market conditions: Rents rising (+3.9%/yr); 215 active listings in the ZIP; 19 comparable units currently listed for rent nearby; rentals at typical pace (median 15d on market — plan ~3-4 weeks tenant-placement turnaround); solid renter incomes; 5,365 units permitted in Oklahoma County in 2024 (569 in 5+ unit buildings).
- At $2,981/mo this rent would consume 46% of the median local household income ($78k/yr) (locally 988% of renters already pay >50% of income on rent) — very limited rent-growth headroom before tenants either downsize or default.
Forward outlook
- Local home prices are declining (-3.0%/yr); year-one equity from $2k of loan paydown is wiped out by about $8k of value loss. Plan a longer hold.
- Oklahoma County population projected at +41% by 2050 — long-run rental-demand tailwind backs the buy-and-hold thesis.
Negotiation context
- It's been on market 35 days — a 3% lower offer ($267k) is reasonable based on typical stale-listing flexibility.
- Current owner paid $228k; 21% above their basis — modest negotiation headroom, anchor on the comps not their cost.
Risks & watch-outs
- Climate carrying-cost: extreme-heat days projected 7→19/yr by 2055 (HVAC capex compounding) — expect insurance premiums to compound above CPI over the hold.
Questions for the listing agent
- It's been on market 35 days. Have you received any prior offers? Is the seller open to a 3% concession, seller financing, or rate buy-down credit?
- Can we see the unit-by-unit rent roll, current vacancy, and any below-market leases? What's the average tenancy length?
- What capital expenditures (roof, boiler, parking lot, exteriors) have been made in the last 5 years, and what's planned in the next 2?
- Is there a deadline driving the sale (1031 exchange, divorce, estate, relocation)? That informs how much negotiation room exists.
- Schools are A-rated — typically a magnet for longer-tenancy family renters. What's the average tenant stay here, and is there a school-zone premium baked into asking?
- What's the average days-on-market for RENTAL listings here right now (not sales)? A rising rental-DOM trend means longer vacancies and softer asking-rent achievability than the comps imply.
- What's the recent tenant-quality profile in this submarket — average credit score on applications, eviction rate, late-payment / NSF rate, and stable-employment percentage? A property-management company in the area should have these aggregated.
- How much new apartment / multifamily construction is in the pipeline within 1–3 miles? Heavy new supply (>2% of stock underway) typically softens rents 12–24 months out; light construction supports rent growth.
Investment metrics
- 1% rule
- 1.08% ✓
- Cap rate
- 8.66%
- Cash-on-cash
- 8.44%
- DSCR
- 1.38
- GRM
- 7.7
CMA / ARV
No comps found within radius.
Projected returns pro-forma
-3.0% appreciation · 3.86% rent growth · sell at horizon
- IRR
- -2.6%
- Equity multiple
- 0.90×
- Total profit
- $-7,473
- Equity at exit
- $41,003
- IRR
- 8.0%
- Equity multiple
- 1.63×
- Total profit
- $48,741
- Equity at exit
- $23,777
Cash invested: $77,000 (down + closing). Projections, not guarantees.
Landlord ↔ Tenant lean methodology
- Overall (STATE)
- 83 Strongly Landlord-Friendly
- State Oklahoma
- 83 Strongly Landlord-Friendly · R+20
- County
- — inherits STATE
- City
- — inherits STATE
ZIP-level market 73003
- Home prices YoY
- -31.2%
- Rents YoY
- 3.9%
- Active inventory
- 215
- Price-to-rent
- 15.4×
Monthly cashflow live
- Estimated rent
- $2,981 high interval (Pro) →
- Mortgage (P&I)
- −$1,442
- Tax from tax record
- −$257 /mo · $3,080/yr
- Insurance
- −$115
- HOA
- −$0
- Vacancy / Maint / Mgmt
- −$626
- Net cashflow
- $542
Break-even live
Sensitivity live
| Price | -10% $697 | -5% $619 | +0% $542 | +5% $464 | +10% $386 |
|---|---|---|---|---|---|
| Rent | -10% $306 | -5% $424 | +0% $542 | +5% $659 | +10% $777 |
| Rate | -1.0pp $680 | -0.5pp $612 | base $542 | +0.5pp $470 | +1.0pp $398 |
2-unit breakdown (identical units grouped — click to expand)
| Units | Beds | Baths | Est. rent |
|---|---|---|---|
| 2× units | 2 | 1 | $2,980 |
| #1 | 2 | 1 | $1,490 |
| #2 | 2 | 1 | $1,490 |
| Total (2 units) | $2,981 | ||
UW: 25.0% down · 7.5% · 30yr · 1.5% tax · 5.0% vac · 8.0% maint · 8.0% mgmt
Financing live
Cash to close
- Down payment
- $68,750
- Closing costs
- $8,250
- Reserves months
- —
- Total cash needed
- —
Loan-product check · same deal, 3 products live
Conventional
25% down · 7.5% · 30yr
- Down + closing
- —
- Monthly P&I
- —
- Monthly cashflow
- —
- DSCR
- —
- Eligible?
- —
Personal DTI + credit; lowest rate.
DSCR
20% down · 8.5% · 30yr
- Down + closing
- —
- Monthly P&I
- —
- Monthly cashflow
- —
- DSCR
- —
- Eligible?
- —
No personal income docs; deal must DSCR.
Hard money
10% down · 12.0% · 12mo
- Down + closing
- —
- Monthly P&I
- —
- Monthly cashflow
- —
- DSCR
- —
- Eligible?
- —
Short-term bridge; refi at stabilization.
Rent comps 19 comps
| Address | Beds | Baths | Sqft | Rent | $/sqft | DOM | Units | Dist |
|---|---|---|---|---|---|---|---|---|
| 201 Barrett Pl Edmond, OK | 2.0 | 1.0 | 2034 | $1,095 | $0.54 | 2d | 1 | 0.10mi |
| 1117 Sequoyah Pl Unit C Edmond, OK | 3.0 | 2.5 | 1554 | $1,675 | $1.08 | 15d | 1 | 0.18mi |
| 1117 Sequoyah Pl Unit C Edmond, OK | 3.0 | 2.5 | 1554 | $1,675 | $1.08 | 24d | 1 | 0.18mi |
| 101 W Main St Edmond, OK | 3.0 | 1.0–2.0 | 991 | $1,959 | $1.98 | 2d | 111 | 0.56mi |
| 16 N Walnut St Edmond, OK | 3.0 | 2.5 | 1650 | $2,395 | $1.45 | 15d | 1 | 0.62mi |
| 645 W 2nd St Edmond, OK | 3.0 | 2.0 | 1660 | $1,975 | $1.19 | 15d | 1 | 0.89mi |
| 612 W 2nd St Unit 100 Edmond, OK | 3.0 | 2.5 | 1414 | $1,895 | $1.34 | 22d | 1 | 0.89mi |
| 463 S Fretz Ave Edmond, OK | 2.0 | 2.0 | 1550 | $1,695 | $1.09 | 15d | 1 | 0.95mi |
| 541 S Fretz Ave Edmond, OK | 2.0 | 2.5 | 1682 | $1,795 | $1.07 | 24d | 1 | 1.02mi |
| 1024 Carpe Diem Ct Edmond, OK | 3.0 | 2.0 | 1700 | $1,895 | $1.11 | 3d | 1 | 1.03mi |
| 575 S Fretz Ave Edmond, OK | 3.0 | 2.5 | 1530 | $2,000 | $1.31 | 3d | 1 | 1.04mi |
| 812 Richmond Rd Edmond, OK | 3.0 | 2.0 | 2211 | $1,800 | $0.81 | 24d | 1 | 1.08mi |
| 609 Abadan Dr Edmond, OK | 3.0 | 3.5 | 2292 | $2,500 | $1.09 | 2d | 1 | 1.10mi |
| 725 Lapwing Rd Edmond, OK | 3.0 | 2.0 | 1825 | $1,810 | $0.99 | 24d | 1 | 1.11mi |
| 616 Abadan Dr Edmond, OK | 3.0 | 3.5 | 2412 | $2,400 | $1.00 | 15d | 1 | 1.13mi |
| 1804 Victoria Pl Edmond, OK | 3.0 | 2.0 | 1725 | $1,990 | $1.15 | 24d | 1 | 1.40mi |
| 1028 Mollie Rausch Ln Edmond, OK | 3.0 | 2.0 | 1495 | $1,650 | $1.10 | 24d | 1 | 1.41mi |
| 1718 Windhill Ave Unit 1 Edmond, OK | 2.0 | 2.0 | 1724 | $1,600 | $0.93 | 24d | 1 | 1.48mi |
| 1718 Windhill Ave Edmond, OK | 2.0 | 2.0 | 1724 | $1,650 | $0.96 | 24d | 1 | 1.48mi |
Listing history 5 events
-
2026-05-20status Pending
-
2026-04-15$275,000 Active
-
2022-05-10soldstatus $227,500
-
2022-05-09soldstatus $192,000
-
1989-12-18soldstatus $36,000
ⓘ Source: listings_history table (triggers on properties + properties_extension) + one-shot
backfill from property_details.listing_events for pre-trigger history.
Tax reassessment forecast OK · Resets to sale price
- Current annual tax
- $3,080 · $257/mo
- Projected year-2 tax
- $3,080 · $257/mo
- Expected delta
- $0/yr ($0/mo · 0.0%)
ⓘ Screening estimate from a state-policy table — verify with the county assessor before closing.
Climate risk First Street
- Flood 1/10 Low FEMA zone X (unshaded) · 0% chance over 30 yrs
- Wildfire 2/10 Low
- Heat 6/10 Major 7 d/yr ≥108°F today · 19 d/yr by 30 yrs out
- Wind 2/10 Low 3% chance of damaging wind over 30 yrs
- Air quality 2/10 Low 2 unhealthy d/yr today · 2 by 30 yrs out
Nearby sold comps map
Loading sold comps map…
Walkable amenities ~0.75 mi
Loading nearby amenities…
Taxation est. · year 1
- Rental income
- $35,772
- − Mortgage interest
- −$15,404
- − Property taxes
- −$3,080
- − Insurance
- −$1,375
- − Repairs & maintenance
- −$2,862
- − Management
- −$2,862
- − Depreciation
- −$8,000
- Taxable income
- $2,189
- Est. tax owed @ 24.0%
- −$525
- After-tax cash flow
- $5,974/yr
For passive investors: Depreciation is non-cash, so a rental often shows a tax loss while cash-flowing — sheltering income. Rental losses are passive: they offset passive income freely, and up to $25,000/yr can offset ordinary (W-2) income if you actively participate and your MAGI is under $100k (phasing out to $0 by $150k); unused losses carry forward. On sale, claimed depreciation is recaptured at up to 25%, and gains may owe capital-gains tax (a 1031 exchange can defer both). Figures are a year-1 estimate at your 24.0% rate — not tax advice; consult a CPA.
Schools (NCES district)
- District
- Edmond
- NCES district ID
- 4010590
- Math proficiency
- 38% ▼ -12.00%
- Reading proficiency
- 40% ▼ -12.00%
- Median HH income
- $73,212
- Composite
- 35.88/100
- National rank
- #4814
- State rank
- #11 of 270 in OK
Livability — Edmond
- Score
- 78/100
- State rank
- #6
- US rank
- #2383
Category grades
Schools grade is shown separately in the Schools card above.
Census & demographics
- Census place
- Edmond, OK
- County
- Oklahoma County · 771,644 people
- City population
- 177,083
- Metro
- Oklahoma City, OK
- Population (ZIP)
- 23,236
- Household income
- $78,149
- Rent vs Own
- Severe rent burden
- 988.0
Population outlook (Oklahoma County) Hauer SSP2
- Today (2025)
- 911,875 people
- By 2030
- 982,413 · +7.7%
- By 2040
- 1,130,468 · +24.0%
- By 2050
- 1,288,422 · +41.3%
- By 2075
- 1,711,482 · +87.7%
- By 2100
- 2,088,448 · +129.0%
Race, ethnicity, and origin ACS 2023
- Neighborhood character
- Predominantly White (69%)
- Race & ethnicity
- White 69% Two or more races 13% Black 9% Hispanic / Latino 9% Asian 3%
- Hispanic origin (detail)
- Mexican 7%
- Common ancestry
- Italian 2% Slovak 2% Lithuanian 1%
- Foreign-born
- 8% · Canada, China
- Languages at home
- 90% English-only · Spanish 5% Other Indo-European 2% Chinese 1%
Political lean MEDSL · Oklahoma
- 2024 margin
- Toss-up / Even · D 48.0% · R 49.7% · Other 2.3%
- 2008→2024 swing
- +15.1pp toward D · 2008: -16.8pp · 2024: -1.7pp
- All cycles
- 2024: R+1.7 2020: R+1.1 2016: R+10.5 2012: R+16.7 2008: R+16.8
Not yet ingested
- Civics
- —
Market trends
- HPI YoY
- ▼ -104.15%
- Current HPI
- 229.3899
- Rent YoY
- ▲ 3.86%
- Metro
- Oklahoma City, OK
- State GDP YoY
- ▲ 1.55%
- F500 in state
- 6
Industry mix (Fortune 500 HQ in OK)
| Industry | F500 HQs | Revenue |
|---|---|---|
| Energy | 3 | $48B |
|
||
Price history
+663.9% since first listed5 events — show timeline
- 2026-05-20 Pending — MLSOK
- 2026-04-15 Listed $275,000 MLSOK
- 2022-05-10 Sold (Public Records) $227,500 Public Records
- 2022-05-09 Sold (Public Records) $192,000 Public Records
- 1989-12-18 Sold (Public Records) $36,000 Public Records
Property tax history
+11.2%/yrLatest (2025): $3,080 · +5.1% YoY. Source: county tax records.
Cash-flow waterfall
monthlySold comps — $/sqft
last 12 mo · ≤1 miLoading sold comps…