 Multi-family
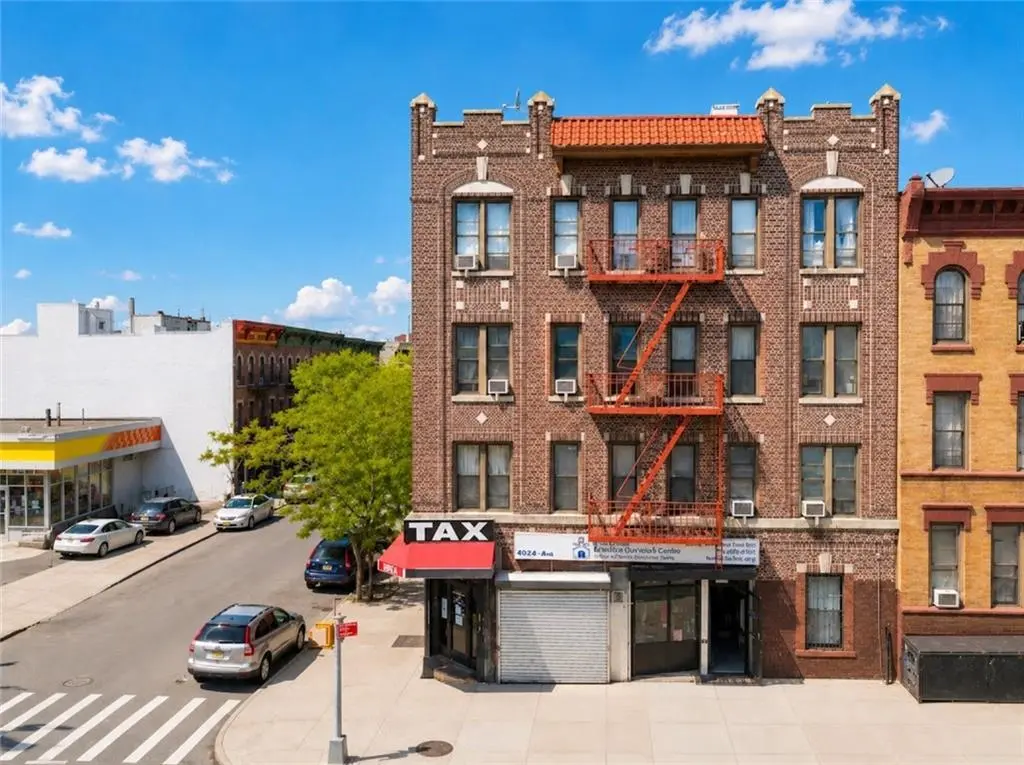
375 61 St · New York, NY
Flood risk No data
- FEMA flood zone
- —
- Chance of flooding over 30 yrs
- —
- Est. flood insurance / yr
- —
Fire risk No data
- Est. fire insurance / yr
- —
Heat risk No data
- Hot days now (above threshold)
- —
- Hot days in 30 yrs
- —
Wind risk No data
- Chance of severe wind over 30 yrs
- —
Air-quality risk No data
- Unhealthy air days now
- —
- Unhealthy air days in 30 yrs
- —
Risk factors via First Street. Map © Google.
Why this score? — see what drove the B- grade
The composite is a weighted blend of 9 inputs, each scored 0–100. Each bar is that input's sub-score; the figure is the points it added to the 100-point composite (weight × sub-score).
- Cash flow +21.5/30.0
- Appreciation +7.8/10.0
- ARV discount +7.5/15.0
- DSCR +6.9/10.0
- 1% rule +5.6/10.0
- Rent growth +5.0/5.0
- Schools +5.0/10.0
- Livability +3.8/5.0
- Condition / age +2.8/5.0
$3,750,000
🖨 Deal sheet 📄 Offer letter ✓ Due diligence
Multi-family units
County records classify this as Multi-Family (5+ Unit). Listing-text estimate: 1 unit. estimate disagrees with records
5+ unit building — per-unit beds/baths from public records are typically unavailable; the breakdown below (if shown) is an estimate from the listing text.
Listing remarks
Prime location investment property featuring 17 residential units and 2 stores. The seller is ready to consider all serious offers.
Key facts
- 3,600 sq ft lot
- Listed 36 days
Property features AI
Finance
- Financial info: Rent income reported; Financing considered: exchange, bank mortgage, or cash
Exterior
- Parking: Shared driveway
- Utilities: 220V electric service; Electric hot water; Gas for heating; Annual utility expense reported
- Home design: Mixed-use property; Semi-detached building; Flat roof; Faces unspecified
- Construction: Brick exterior; Block foundation
- Exterior features: Shared driveway
Interior
- Flooring: Hardwood floors
- Heating & cooling: Gas heating; Baseboard heat; Steam/radiator heat; Electric hot water (220V)
- Interior features: Hardwood floors; Full unfinished cellar
Neighborhood map
What this means for you Summary
Snapshot
- This is a multifamily listed at $3.75M. Condition is rated average.
Deal economics
- At list price, monthly cash flow is $6k ($68k/yr) — positive.
- The deal already cash-flows at list — no discount required.
- Meets the 1% rule at list price ($40k rent vs $3.75M).
- Recommended offer: $3.64M (3.0% below list) — sets the bar for market timing.
- Cap rate 8.1% vs local median 2.6% in New York — top-decile yield for the area; either an underpriced asset or a hidden risk that comps aren't pricing in. Stress-test before assuming the spread holds.
Location & tenants
- Location reads 75/100 on livability (#268 in NY, #4,188 nationally) — a middle-class / working-renter tenant base. Strengths: amenities A+, commute A+, health & safety A; Watch: crime F, cost of living F.
- Market conditions: Rents rising fast (+11.0%/yr); 271 active listings in the ZIP; 10,063 units permitted in Kings County in 2024 (9,789 in 5+ unit buildings).
- At $39,930/mo this rent would consume 686% of the median local household income ($70k/yr) (locally 6563% of renters already pay >50% of income on rent) — very limited rent-growth headroom before tenants either downsize or default.
Forward outlook
- In year one you build about $237k of equity ($26k loan paydown + $211k appreciation (5.6% local appreciation)).
- Kings County population projected at +13% by 2050 — modest demand growth; plan on rents tracking national, not racing it.
- At projected returns (5.6% appreciation + 8.0% rent growth), your $1.05M cash investment doubles in ~4 years — after that, you're playing with house money.
- By year 2, paydown + projected appreciation supports a ~$380k cash-out refi (75% LTV) — recoverable capital for the next deal without selling this one.
Negotiation context
- It's been on market 36 days — a 3% lower offer ($3.64M) is reasonable based on typical stale-listing flexibility.
Questions for the listing agent
- It's been on market 36 days. Have you received any prior offers? Is the seller open to a 3% concession, seller financing, or rate buy-down credit?
- Is there a deadline driving the sale (1031 exchange, divorce, estate, relocation)? That informs how much negotiation room exists.
- Schools are B-rated — typically a magnet for longer-tenancy family renters. What's the average tenant stay here, and is there a school-zone premium baked into asking?
- Crime grade is F in this area — have there been break-ins, vandalism, or insurance claims at this property in the last 3 years? What carrier currently insures it and at what premium?
- What's the average days-on-market for RENTAL listings here right now (not sales)? A rising rental-DOM trend means longer vacancies and softer asking-rent achievability than the comps imply.
- What's the recent tenant-quality profile in this submarket — average credit score on applications, eviction rate, late-payment / NSF rate, and stable-employment percentage? A property-management company in the area should have these aggregated.
- How much new apartment / multifamily construction is in the pipeline within 1–3 miles? Heavy new supply (>2% of stock underway) typically softens rents 12–24 months out; light construction supports rent growth.
Investment metrics
- 1% rule
- 1.06% ✓
- Cap rate
- 8.09%
- Cash-on-cash
- 6.43%
- DSCR
- 1.29
- GRM
- 7.8
CMA / ARV
No comps found within radius.
Projected returns pro-forma
5.63% appreciation · 8.0% rent growth · sell at horizon
- IRR
- 22.4%
- Equity multiple
- 2.50×
- Total profit
- $1,571,648
- Equity at exit
- $2,271,002
- IRR
- 23.7%
- Equity multiple
- 5.66×
- Total profit
- $4,890,144
- Equity at exit
- $4,045,768
Cash invested: $1,050,000 (down + closing). Projections, not guarantees.
Landlord ↔ Tenant lean methodology
- Overall (CITY)
- 0 Strongly Tenant-Friendly
- State New York
- 15 Strongly Tenant-Friendly · D+10
- County
- — inherits STATE
- City New York
- 0 Strongly Tenant-Friendly · D+34
ZIP-level market 11220
- Home prices YoY
- 2.5%
- Rents YoY
- 11.0%
- Active inventory
- 271
- Price-to-rent
- 133.0×
Monthly cashflow live
- Estimated rent
- $39,930 medium interval (Pro) →
- Mortgage (P&I)
- −$19,665
- Tax est. 1.5%
- −$4,688 /mo · $56,250/yr
- Insurance
- −$1,562
- HOA
- −$0
- Vacancy / Maint / Mgmt
- −$8,385
- Net cashflow
- $5,629
Break-even live
17-unit breakdown (identical units grouped — click to expand)
| Units | Beds | Baths | Est. rent |
|---|---|---|---|
| 17× units | 1 | 1 | $39,933 |
| #1 | 1 | 1 | $2,349 |
| #2 | 1 | 1 | $2,349 |
| #3 | 1 | 1 | $2,349 |
| #4 | 1 | 1 | $2,349 |
| #5 | 1 | 1 | $2,349 |
| #6 | 1 | 1 | $2,349 |
| #7 | 1 | 1 | $2,349 |
| #8 | 1 | 1 | $2,349 |
| #9 | 1 | 1 | $2,349 |
| #10 | 1 | 1 | $2,349 |
| #11 | 1 | 1 | $2,349 |
| #12 | 1 | 1 | $2,349 |
| #13 | 1 | 1 | $2,349 |
| #14 | 1 | 1 | $2,349 |
| #15 | 1 | 1 | $2,349 |
| #16 | 1 | 1 | $2,349 |
| #17 | 1 | 1 | $2,349 |
| Total (17 units) | $39,930 | ||
UW: 25.0% down · 7.5% · 30yr · 1.5% tax · 5.0% vac · 8.0% maint · 8.0% mgmt
Financing live
Cash to close
- Down payment
- $937,500
- Closing costs
- $112,500
- Reserves months
- —
- Total cash needed
- —
Loan-product check · same deal, 3 products live
Conventional
25% down · 7.5% · 30yr
- Down + closing
- —
- Monthly P&I
- —
- Monthly cashflow
- —
- DSCR
- —
- Eligible?
- —
Personal DTI + credit; lowest rate.
DSCR
20% down · 8.5% · 30yr
- Down + closing
- —
- Monthly P&I
- —
- Monthly cashflow
- —
- DSCR
- —
- Eligible?
- —
No personal income docs; deal must DSCR.
Hard money
10% down · 12.0% · 12mo
- Down + closing
- —
- Monthly P&I
- —
- Monthly cashflow
- —
- DSCR
- —
- Eligible?
- —
Short-term bridge; refi at stabilization.
Listing history 14 events
-
2026-06-18days on market $3,750,000 Active 36 DOM
-
2026-06-17days on market $3,750,000 Active 35 DOM
-
2026-06-16days on market $3,750,000 Active 34 DOM
-
2026-06-15days on market $3,750,000 Active 33 DOM
-
2026-06-13days on market $3,750,000 Active 31 DOM
-
2026-06-10days on market $3,750,000 Active 27 DOM
-
2026-06-08days on market $3,750,000 Active 26 DOM
-
2026-06-08days on market $3,750,000 Active 25 DOM
-
2026-06-04days on market $3,750,000 Active 22 DOM
-
2026-06-03days on market $3,750,000 Active 21 DOM
-
2026-06-02days on market $3,750,000 Active 20 DOM
-
2026-06-01days on market $3,750,000 Active 19 DOM
-
2026-05-31days on market $3,750,000 Active 18 DOM
-
2026-05-13$3,750,000 Active
ⓘ Source: listings_history table (triggers on properties + properties_extension) + one-shot
backfill from property_details.listing_events for pre-trigger history.
Nearby sold comps map
Loading sold comps map…
Walkable amenities ~0.75 mi
Loading nearby amenities…
Taxation est. · year 1
- Rental income
- $479,160
- − Mortgage interest
- −$210,058
- − Property taxes
- −$56,250
- − Insurance
- −$18,750
- − Repairs & maintenance
- −$38,333
- − Management
- −$38,333
- − Depreciation
- −$109,091
- Taxable income
- $8,345
- Est. tax owed @ 24.0%
- −$2,003
- After-tax cash flow
- $65,549/yr
For passive investors: Depreciation is non-cash, so a rental often shows a tax loss while cash-flowing — sheltering income. Rental losses are passive: they offset passive income freely, and up to $25,000/yr can offset ordinary (W-2) income if you actively participate and your MAGI is under $100k (phasing out to $0 by $150k); unused losses carry forward. On sale, claimed depreciation is recaptured at up to 25%, and gains may owe capital-gains tax (a 1031 exchange can defer both). Figures are a year-1 estimate at your 24.0% rate — not tax advice; consult a CPA.
Condition & rehab AI · 9 photos
A moderate rehab opportunity with average exterior and roof conditions. Exterior paint and roof inspection are recommended to enhance value and ensure structural integrity.
Repairs flagged
- Minor exterior paint — Some discoloration on brick facade
- Moderate roof inspection — Roof may need inspection for any issues
Value-add opportunities
- Both exterior paint — Enhances curb appeal and property value
- Both roof inspection and repair — Ensures structural integrity and prevents future issues
Renovation cost estimate screening
| Repair item | Severity | Est. cost |
|---|---|---|
| exterior paint · Some discoloration on brick facade | Minor | $500–3,000 |
| roof inspection · Roof may need inspection for any issues | Moderate | $3,000–15,000 |
| Total estimated repair cost · 2 items | $3,500–18,000 |
Value-add ROI direction
- Both exterior paint — Enhances curb appeal and property value ↑
- Both roof inspection and repair — Ensures structural integrity and prevents future issues ↑
ⓘ Cost ranges are severity-bucket heuristics (US national rule-of-thumb). Get contractor quotes + a written scope before underwriting a rehab budget.
Schools (NCES district)
No district data.
Livability — New York
- Score
- 75/100
- State rank
- #268
- US rank
- #4188
Category grades
Schools grade is shown separately in the Schools card above.
Census & demographics
- Census place
- New York, NY
- County
- Kings County · 2,614,986 people
- City population
- 7,731,280
- Metro
- New York-Newark-Jersey City, NY-NJ-PA
- Population (ZIP)
- 90,652
- Household income
- $69,883
- Rent vs Own
- Severe rent burden
- 6563.0
Population outlook (Kings County) Hauer SSP2
- Today (2025)
- 2,847,441 people
- By 2030
- 2,937,006 · +3.1%
- By 2040
- 3,095,491 · +8.7%
- By 2050
- 3,228,968 · +13.4%
- By 2075
- 3,321,723 · +16.7%
- By 2100
- 3,111,387 · +9.3%
Race, ethnicity, and origin ACS 2023
- Neighborhood character
- Diverse neighborhood (Simpson 0.65)
- Race & ethnicity
- Asian 40% Hispanic / Latino 40% White 16% Two or more races 7% Black 2% Native American 2%
- Hispanic origin (detail)
- Mexican 17% Puerto Rican 8% Dominican 5%
- Common ancestry
- Romanian 1% Scotch-Irish 1% Subsaharan African 1%
- Foreign-born
- 52% · China, Canada, Jamaica
- Languages at home
- 20% English-only · Spanish 35% Chinese 35% Arabic 3%
Political lean MEDSL · Kings
- 2024 margin
- Solid D (+44.0) · D 72.0% · R 28.0%
- 2008→2024 swing
- -15.5pp toward R · 2008: 59.4pp · 2024: 44.0pp
- All cycles
- 2024: D+44.0 2020: D+54.8 2016: D+61.8 2012: D+63.9 2008: D+59.4
Not yet ingested
- Civics
- —
Market trends
- HPI YoY
- ▲ 5.63%
- Current HPI
- 226.624
- Rent YoY
- ▲ 11.02%
- Metro
- New York-Newark-Jersey City, NY-NJ-PA
- State GDP YoY
- ▲ 2.60%
- F500 in state
- 92
Industry mix (Fortune 500 HQ in NY)
| Industry | F500 HQs | Revenue |
|---|---|---|
| Financial Services | 10 | $950B |
|
||
| Consumer Goods | 9 | $162B |
|
||
| Insurance | 4 | $225B |
|
||
| Telecommunications | 2 | $144B |
|
||
| Pharmaceuticals | 2 | $112B |
|
||
| Media / Entertainment | 2 | $69B |
|
||
Price history
1 event — show timeline
- 2026-05-13 Listed $3,750,000 BNYMLS
Cash-flow waterfall
monthlySold comps — $/sqft
last 12 mo · ≤1 miLoading sold comps…