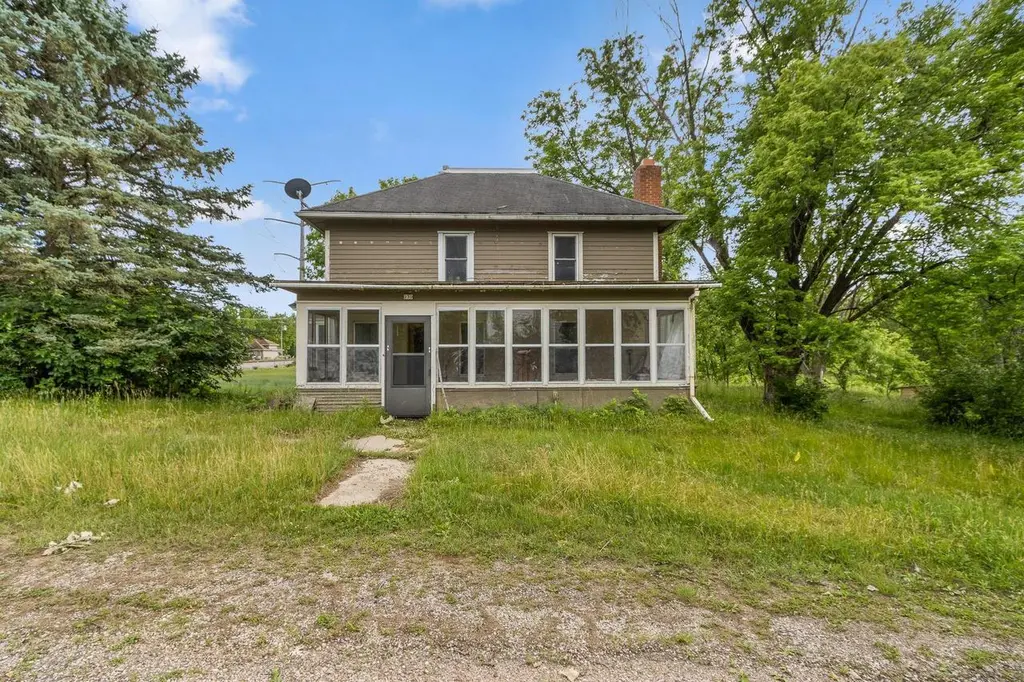
230 E Van Buren St · Poynette, WI
Flood risk 1/10 · Minimal
- FEMA flood zone
- X (unshaded)
- Chance of flooding over 30 yrs
- 0.0%
- Est. flood insurance / yr
- $473 – $860
Fire risk 4/10 · Minor
- Est. fire insurance / yr
- $636 – $1,182
Heat risk 2/10 · Minimal
- Hot days now (above 99°F)
- 7 days/yr
- Hot days in 30 yrs
- 14 days/yr
Wind risk 2/10 · Minimal
- Chance of severe wind over 30 yrs
- —
Air-quality risk 2/10 · Minimal
- Unhealthy air days now
- 1 days/yr
- Unhealthy air days in 30 yrs
- 1 days/yr
Risk factors via First Street. Map © Google.
Why this score? — see what drove the B- grade
The composite is a weighted blend of 9 inputs, each scored 0–100. Each bar is that input's sub-score; the figure is the points it added to the 100-point composite (weight × sub-score).
- Cash flow +30.0/30.0
- DSCR +10.0/10.0
- 1% rule +9.0/10.0
- ARV discount +7.5/15.0
- Schools +3.8/10.0
- Livability +3.6/5.0
- Rent growth +2.5/5.0
- Condition / age +2.5/5.0
- Appreciation +0.0/10.0
$125,000
🖨 Deal sheet 📄 Offer letter ✓ Due diligence
Listing remarks MLS
In need of a little TLC with great potential. Private street with Rowan Creek and open land beyond rear yard 1.643 areas. Home features 2 full baths w/ washer & dryer first floor, large living room with natural Fireplace. Three season room and rear inclosed porch.
Key facts
- New well
- Entirely gutted
- 104 acre lot
Tags
Property features AI
Finance
- Other: Seller excludes personal property; Includes a 1.04 acre parcel
Exterior
- Parking: Detached 2-car garage with opener included
- Utilities: Municipal sewer; Well; Natural gas heating
- Home design: Two-story single-family home; Approximately 1,614 finished above-grade square feet
- Construction: Finished above grade: 1,614 sq ft; Finished below grade: 0 sq ft
- Exterior features: Wood exterior; 1.64-acre lot; Residential zoning
Interior
- Kitchen: Kitchen on main level
- Bedrooms: Master bedroom on upper level; Second bedroom on upper level; Third bedroom on upper level
- Bathrooms: Two full bathrooms; No master bathroom
- Interior features: Full basement; Main-level living room; Main-level kitchen
Neighborhood map
What this means for you Summary
Snapshot
- This is a 3-bed/2.0-bath single-family listed at $125k.
Deal economics
- At list price, monthly cash flow is $510 ($6k/yr) — positive.
- The deal already cash-flows at list — no discount required.
- Meets the 1% rule at list price ($2k rent vs $125k).
- Cap rate 11.2% vs local median 2.1% in Poynette — top-decile yield for the area; either an underpriced asset or a hidden risk that comps aren't pricing in. Stress-test before assuming the spread holds.
Location & tenants
- Location reads 71/100 on livability (#282 in WI) — a middle-class / working-renter tenant base. Strengths: cost of living A+, housing A+, crime A; Watch: health & safety D, amenities F, commute F.
- Poynette School District (rural): math 43% / reading 42% proficiency, ranked #108 of 342 in WI (top 32%) — families likely to look elsewhere, expect single-tenant / working-renter base with shorter leases; only 18% free/reduced lunch — higher-income household profile.
- Zoned schools: Poynette Elementary (math 47% / reading 42%, grade F, #372 of 1,041 statewide, top 40%, 412 students, 29% FRL); Poynette High (math 37% / reading 47%, grade F, #74 of 483 statewide, top 18%, 307 students, 24% FRL).
- Market conditions: 33 active listings in the ZIP; 1 comparable units currently listed for rent nearby; 219 units permitted in Columbia County in 2024 (45 in 5+ unit buildings).
Forward outlook
- Local home prices are declining (-3.0%/yr); year-one equity from $864 of loan paydown is wiped out by about $4k of value loss. Plan a longer hold.
- Columbia County population projected at -10% by 2050 — secular population decline; favor cash flow + early exit over multi-decade hold.
- At projected returns (-3.0% appreciation + 3.0% rent growth), your $35k cash investment doubles in ~7 years — after that, you're playing with house money.
Negotiation context
- Only 1 days on market — expect competitive offers; lowballing is unlikely to land.
- 2 sale attempts with the ask held roughly flat each time — persistent listings suggest the price (not the market) is what's stuck; bring a comps-based counter.
Risks & watch-outs
- Watch-outs: built in 1920 — expect roof / HVAC / electrical / plumbing capex.
Questions for the listing agent
- Built in 1920 — when were the roof, HVAC, electrical panel, plumbing, and water heater last replaced?
- Is there a deadline driving the sale (1031 exchange, divorce, estate, relocation)? That informs how much negotiation room exists.
- Schools are B-rated — typically a magnet for longer-tenancy family renters. What's the average tenant stay here, and is there a school-zone premium baked into asking?
- What's the average days-on-market for RENTAL listings here right now (not sales)? A rising rental-DOM trend means longer vacancies and softer asking-rent achievability than the comps imply.
- What's the recent tenant-quality profile in this submarket — average credit score on applications, eviction rate, late-payment / NSF rate, and stable-employment percentage? A property-management company in the area should have these aggregated.
- How much new for-sale + rental construction is in the pipeline within 1–3 miles? Heavy new supply typically softens prices + rents 12–24 months out; constrained supply supports both.
Investment metrics
- 1% rule
- 1.40% ✓
- Cap rate
- 11.19%
- Cash-on-cash
- 17.50%
- DSCR
- 1.78
- GRM
- 6.0
CMA / ARV
- ARV (on-the-fly)
- $332,484
- Comps found
- 12
Show comp detail 12 sales within ~0.75 mi
| Address | Dist | Beds/Ba | Sqft | Sold | Price | $/sf | Match |
|---|---|---|---|---|---|---|---|
| 306 N Franklin St | 0.25mi | 3/2.0 | 1,617 (+0%) | 8mo | $290,000 | $179 | 81 |
| 111 W Thomas St | 0.25mi | 3/1.5 | 1,524 (-6%) | 1mo | $290,000 | $190 | 76 |
| 155 Academy St | 0.30mi | 3/2.0 | 1,640 (+2%) | 10mo | $308,000 | $188 | 76 |
| 313 N Main St | 0.31mi | 2/2.0 (-1) | 1,555 (-4%) | 4mo | $290,000 | $186 | 71 |
| 121 Old Settlers Trl | 0.44mi | 3/1.0 | 1,580 (-2%) | 6mo | $356,000 | $225 | 67 |
| 214 Pauquette Dr | 0.41mi | 4/2.0 (+1) | 1,560 (-3%) | 10mo | $345,000 | $221 | 62 |
| 315 S Main St | 0.14mi | 3/1.0 | 1,440 (-11%) | 13mo | $250,000 | $174 | 60 |
| 215 S Lincoln St | 0.11mi | 3/1.5 | 1,374 (-15%) | 10mo | $336,000 | $245 | 60 |
| 305 Meadow Ln | 0.48mi | 3/2.5 | 1,770 (+10%) | 2mo | $365,500 | $206 | 58 |
| 171 Academy St | 0.30mi | 3/2.0 | 1,426 (-12%) | 11mo | $305,000 | $214 | 57 |
| N2895 County Road V | 0.64mi | 4/2.0 (+1) | 1,432 (-11%) | 2mo | $1,500,000 | $1,047 | 45 |
| 911 Valley Rd | 0.75mi | 3/2.0 | 1,852 (+15%) | 3mo | $325,000 | $175 | 38 |
Match score weights: distance 35% · size 25% · config 20% · recency 20%. Top-matched comps best support the ARV.
Projected returns pro-forma
-3.0% appreciation · 3.0% rent growth · sell at horizon
- IRR
- 8.9%
- Equity multiple
- 1.35×
- Total profit
- $12,287
- Equity at exit
- $18,638
- IRR
- 18.1%
- Equity multiple
- 2.51×
- Total profit
- $52,691
- Equity at exit
- $10,808
Cash invested: $35,000 (down + closing). Projections, not guarantees.
Landlord ↔ Tenant lean methodology
- Overall (STATE)
- 73 Landlord-Friendly
- State Wisconsin
- 73 Landlord-Friendly · R+2
- County
- — inherits STATE
- City
- — inherits STATE
ZIP-level market 53955
- Home prices YoY
- -13.7%
- Active inventory
- 33
- Price-to-rent
- 6.0×
Monthly cashflow live
- Estimated rent
- $1,750 medium interval (Pro) →
- Mortgage (P&I)
- −$656
- Tax from tax record
- −$164 /mo · $1,973/yr
- Insurance
- −$52
- HOA
- −$0
- Vacancy / Maint / Mgmt
- −$368
- Net cashflow
- $510
Break-even live
UW: 25.0% down · 7.5% · 30yr · 1.5% tax · 5.0% vac · 8.0% maint · 8.0% mgmt
Financing live
Cash to close
- Down payment
- $31,250
- Closing costs
- $3,750
- Reserves months
- —
- Total cash needed
- —
Loan-product check · same deal, 3 products live
Conventional
25% down · 7.5% · 30yr
- Down + closing
- —
- Monthly P&I
- —
- Monthly cashflow
- —
- DSCR
- —
- Eligible?
- —
Personal DTI + credit; lowest rate.
DSCR
20% down · 8.5% · 30yr
- Down + closing
- —
- Monthly P&I
- —
- Monthly cashflow
- —
- DSCR
- —
- Eligible?
- —
No personal income docs; deal must DSCR.
Hard money
10% down · 12.0% · 12mo
- Down + closing
- —
- Monthly P&I
- —
- Monthly cashflow
- —
- DSCR
- —
- Eligible?
- —
Short-term bridge; refi at stabilization.
Rent comps 1 comps
| Address | Beds | Baths | Sqft | Rent | $/sqft | DOM | Units | Dist |
|---|---|---|---|---|---|---|---|---|
| 115 Boneset Ave Poynette, WI | 1.0–2.0 | 1.0–2.0 | 939 | $1,750 | $1.86 | 14d | 11 | 0.89mi |
Listing history 2 events
-
2026-06-18remarks 699-char remark
-
2026-06-18$125,000 Active 1 DOM
ⓘ Source: listings_history table (triggers on properties + properties_extension) + one-shot
backfill from property_details.listing_events for pre-trigger history.
Tax reassessment forecast WI · Partial reset (capped growth)
- Current annual tax
- $1,973 · $164/mo
- Projected year-2 tax
- $2,143 · $179/mo
- Expected delta
- +$170/yr (+$14/mo · 8.6%)
ⓘ Screening estimate from a state-policy table — verify with the county assessor before closing.
Climate risk First Street
- Flood 1/10 Low FEMA zone X (unshaded) · 0% chance over 30 yrs
- Wildfire 4/10 Moderate
- Heat 2/10 Low 7 d/yr ≥99°F today · 14 d/yr by 30 yrs out
- Wind 2/10 Low
- Air quality 2/10 Low 1 unhealthy d/yr today · 1 by 30 yrs out
Nearby sold comps map
Loading sold comps map…
Walkable amenities ~0.75 mi
Loading nearby amenities…
Taxation est. · year 1
- Rental income
- $21,000
- − Mortgage interest
- −$7,002
- − Property taxes
- −$1,973
- − Insurance
- −$625
- − Repairs & maintenance
- −$1,680
- − Management
- −$1,680
- − Depreciation
- −$3,636
- Taxable income
- $4,403
- Est. tax owed @ 24.0%
- −$1,057
- After-tax cash flow
- $5,069/yr
For passive investors: Depreciation is non-cash, so a rental often shows a tax loss while cash-flowing — sheltering income. Rental losses are passive: they offset passive income freely, and up to $25,000/yr can offset ordinary (W-2) income if you actively participate and your MAGI is under $100k (phasing out to $0 by $150k); unused losses carry forward. On sale, claimed depreciation is recaptured at up to 25%, and gains may owe capital-gains tax (a 1031 exchange can defer both). Figures are a year-1 estimate at your 24.0% rate — not tax advice; consult a CPA.
Schools (NCES district)
- District
- Poynette School District
- NCES district ID
- 5512120
- Math proficiency
- 43% ▼ -8.00%
- Reading proficiency
- 42% ▼ -7.00%
- Median HH income
- $66,884
- Composite
- 38.19/100
- National rank
- #4261
- State rank
- #108 of 342 in WI
Livability — Poynette
- Score
- 71/100
- State rank
- #282
- US rank
- #7287
Category grades
Schools grade is shown separately in the Schools card above.
Census & demographics
- Census place
- Poynette, WI
- City population
- 5,909
- Population (ZIP)
- 5,909
Population outlook (Columbia County) Hauer SSP2
- Today (2025)
- 56,322 people
- By 2030
- 55,530 · -1.4%
- By 2040
- 53,204 · -5.5%
- By 2050
- 50,388 · -10.5%
- By 2075
- 44,799 · -20.5%
- By 2100
- 38,207 · -32.2%
Race, ethnicity, and origin ACS 2023
- Neighborhood character
- Predominantly White (92%)
- Race & ethnicity
- White 92% Hispanic / Latino 5% Two or more races 4% Native American 1%
- Common ancestry
- Portuguese 16% Romanian 4% Lithuanian 4%
- Foreign-born
- 0%
- Languages at home
- 98% English-only · Spanish 1%
Political lean MEDSL · Columbia
- 2024 margin
- Toss-up / Even · D 47.0% · R 51.6% · Other 1.3%
- 2008→2024 swing
- -19.9pp toward R · 2008: 15.3pp · 2024: -4.6pp
- All cycles
- 2024: R+4.6 2020: R+1.5 2016: R+2.2 2012: D+13.6 2008: D+15.3
Not yet ingested
- Civics
- —
Market trends
- HPI YoY
- ▼ -54.02%
- Current HPI
- 340.6593
- Rent YoY
- —
- Metro
- —
- State GDP YoY
- ▲ 2.10%
- F500 in state
- 20
Industry mix (Fortune 500 HQ in WI)
| Industry | F500 HQs | Revenue |
|---|---|---|
| Industrial Machinery | 4 | $23B |
|
||
| Industrial Technology | 2 | $36B |
|
||
| Insurance | 1 | $36B |
|
||
| Professional Services | 1 | $19B |
|
||
| Utilities | 1 | $9B |
|
||
| Consumer Goods | 1 | $3B |
|
||
Price history
+4.3% since first listed6 events — show timeline
- 2026-06-17 Listed $125,000 SCWMLS
- 2025-04-09 Sold (Public Records) $135,000 Public Records
- 2025-04-04 Sold (MLS) $135,000 METROMLS
- 2025-03-09 Pending — METROMLS
- 2025-03-08 Contingent — METROMLS
- 2025-03-02 Listed $119,900 METROMLS
Property tax history
+2.7%/yrLatest (2025): $1,973 · -29.3% YoY. Source: county tax records.
Cash-flow waterfall
monthlySold comps — $/sqft
last 12 mo · ≤1 miLoading sold comps…