 6-Plex
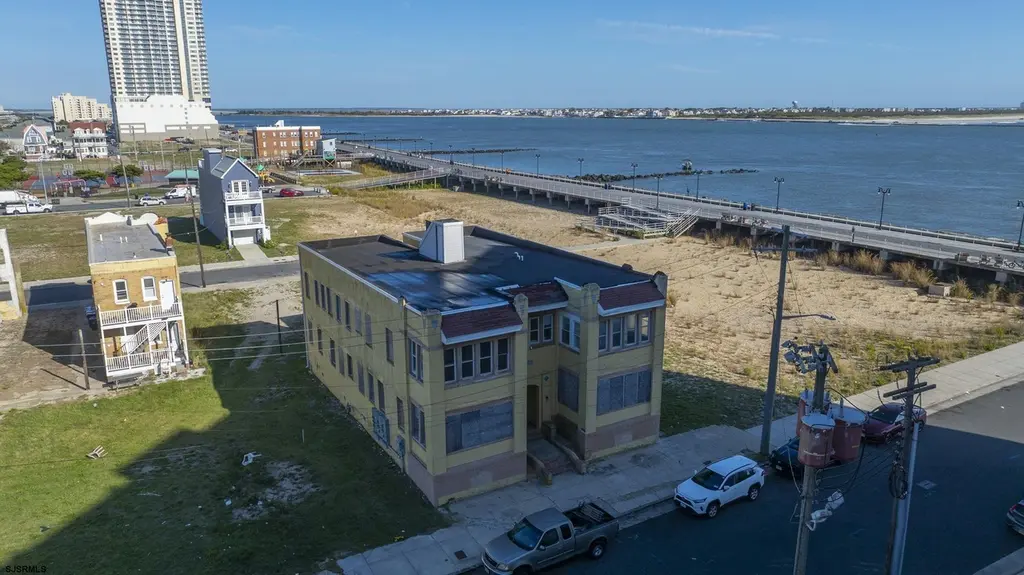
111 Oriental Ave · Atlantic City, NJ
Flood risk 6/10 · Moderate
- FEMA flood zone
- AE
- Chance of flooding over 30 yrs
- 0.86%
- Est. flood insurance / yr
- $1,737 – $8,500
Fire risk 1/10 · Minimal
- Est. fire insurance / yr
- $526 – $976
Heat risk 8/10 · Major
- Hot days now (above 94°F)
- 8 days/yr
- Hot days in 30 yrs
- 18 days/yr
Wind risk 8/10 · Major
- Chance of severe wind over 30 yrs
- 80.0%
Air-quality risk 3/10 · Minor
- Unhealthy air days now
- 2 days/yr
- Unhealthy air days in 30 yrs
- 3 days/yr
Risk factors via First Street. Map © Google.
Why this score? — see what drove the B- grade
The composite is a weighted blend of 9 inputs, each scored 0–100. Each bar is that input's sub-score; the figure is the points it added to the 100-point composite (weight × sub-score).
- Cash flow +30.0/30.0
- 1% rule +10.0/10.0
- DSCR +10.0/10.0
- ARV discount +7.5/15.0
- Rent growth +3.9/5.0
- Livability +2.8/5.0
- Condition / age +2.5/5.0
- Schools +1.4/10.0
- Appreciation +0.0/10.0
$799,000
🖨 Deal sheet 📄 Offer letter ✓ Due diligence
Multi-family units
County records classify this as Multi-Family (5+ Unit). Listing-text estimate: 6 units. confirmed
5+ unit building — per-unit beds/baths from public records are typically unavailable; the breakdown below (if shown) is an estimate from the listing text.
Listing remarks MLS
Opportunity meets vision at 111 Oriental Avenue, a property positioned just steps from the Atlantic City Boardwalk and the oceanfront. The structure has already been gutted and fit out for six units - five two-bedroom, one one-bedroom - all with one bath, in accordance with the City's current six-unit limit. A variance would be required for any additional units, including the potential to reactivate the basement level which was once utilized for living space. The groundwork has been laid with all brand-new windows installed, plywood flooring in place, and a full basement offering added flexibility pending approvals. What makes this offering compelling is not only the existing configuration, but the location. With direct ocean views, immediate access to the beach, and proximity to the Ocean Casino Resort and the surrounding corridor of redevelopment, this is the kind of project where smart capital and strong execution will capture the momentum of a market in transition. The area is benefiting from ongoing investment and revitalization, creating the conditions for significant upside in both short-term rental strategies such as Airbnb and long-term, stabilized income approaches.
Key facts
- Direct ocean views
- Brand-new windows
- Full basement
Tags
Neighborhood map
What this means for you Summary
Snapshot
- This is a 5×2bd/1ba + 1×1bd/1ba units multifamily listed at $799k.
Deal economics
- At list price, monthly cash flow is $5k ($54k/yr) — positive. Per door: $756/mo.
- The deal already cash-flows at list — no discount required.
- Meets the 1% rule at list price ($13k rent vs $799k).
- Recommended offer: $703k (12.0% below list) — sets the bar for market timing.
- Cap rate 13.7% vs local median 3.7% in Atlantic City — top-decile yield for the area; either an underpriced asset or a hidden risk that comps aren't pricing in. Stress-test before assuming the spread holds.
Location & tenants
- Location reads 55/100 on livability (#525 in NJ) — a working-class tenant base; expect higher turnover. Strengths: health & safety A; Watch: commute D, schools F, crime F.
- Atlantic City School District (urban): math 9% / reading 26% proficiency, ranked #454 of 472 in NJ (top 96%) — low school quality limits family demand, transient renter base, plan for 1-2y turnover; 85% free/reduced lunch — lower-income household profile, screen leases tightly.
- Market conditions: Rents rising fast (+5.5%/yr); 482 active listings in the ZIP; lower-income renter base — watch delinquency; 672 units permitted in Atlantic County in 2024 (258 in 5+ unit buildings).
- At $12,723/mo this rent would consume 371% of the median local household income ($41k/yr) (locally 3414% of renters already pay >50% of income on rent) — very limited rent-growth headroom before tenants either downsize or default.
Forward outlook
- Local home prices are declining (-3.0%/yr); year-one equity from $6k of loan paydown is wiped out by about $24k of value loss. Plan a longer hold.
- Atlantic County population projected at -12% by 2050 — secular population decline; favor cash flow + early exit over multi-decade hold.
- At projected returns (-3.0% appreciation + 5.5% rent growth), your $224k cash investment doubles in ~5 years — after that, you're playing with house money.
Negotiation context
- It's been on market 232 days — a 12% lower offer ($703k) is reasonable based on typical stale-listing flexibility.
- 3 sale attempts since 6y ago; this cycle's ask has dropped $200k (20%) from the opening price — seller is motivated, your offer sets the floor, not the list.
- Current owner paid $425k; list at $799k implies a 88% gain — meaningful room to come down on a strong offer.
Risks & watch-outs
- Watch-outs: flood insurance adds $427/mo; built in 1950 — expect roof / HVAC / electrical / plumbing capex.
- Climate carrying-cost: in FEMA flood zone AE (mandatory federal flood insurance); severe wind risk, 80% chance of damaging wind over 30y; extreme-heat days projected 8→18/yr by 2055 (HVAC capex compounding) — expect insurance premiums to compound above CPI over the hold.
Questions for the listing agent
- It's been on market 232 days. Have you received any prior offers? Is the seller open to a 12% concession, seller financing, or rate buy-down credit?
- Can we see the unit-by-unit rent roll, current vacancy, and any below-market leases? What's the average tenancy length?
- What capital expenditures (roof, boiler, parking lot, exteriors) have been made in the last 5 years, and what's planned in the next 2?
- Built in 1950 — when were the roof, HVAC, electrical panel, plumbing, and water heater last replaced?
- What's the actual annual flood-insurance premium (NFIP or private), and is the property in a SFHA with mandatory coverage?
- Why hasn't it sold? Are there any deal-killer items the seller is aware of (foundation, flood, title, zoning, code violations)?
- Is there a deadline driving the sale (1031 exchange, divorce, estate, relocation)? That informs how much negotiation room exists.
- Schools are F-rated, which usually means shorter tenancies and higher turnover. Who's the typical renter profile here, and what's been the actual vacancy rate?
- Crime grade is F in this area — have there been break-ins, vandalism, or insurance claims at this property in the last 3 years? What carrier currently insures it and at what premium?
- What's the average days-on-market for RENTAL listings here right now (not sales)? A rising rental-DOM trend means longer vacancies and softer asking-rent achievability than the comps imply.
- What's the recent tenant-quality profile in this submarket — average credit score on applications, eviction rate, late-payment / NSF rate, and stable-employment percentage? A property-management company in the area should have these aggregated.
- How much new apartment / multifamily construction is in the pipeline within 1–3 miles? Heavy new supply (>2% of stock underway) typically softens rents 12–24 months out; light construction supports rent growth.
Investment metrics
- 1% rule
- 1.59% ✓
- Cap rate
- 13.75%
- Cash-on-cash
- 26.63%
- DSCR
- 2.18
- GRM
- 5.2
CMA / ARV
No comps found within radius.
Projected returns pro-forma
-3.0% appreciation · 5.52% rent growth · sell at horizon
- IRR
- 20.5%
- Equity multiple
- 1.86×
- Total profit
- $192,834
- Equity at exit
- $119,133
- IRR
- 30.3%
- Equity multiple
- 4.06×
- Total profit
- $683,772
- Equity at exit
- $69,083
Cash invested: $223,720 (down + closing). Projections, not guarantees.
Landlord ↔ Tenant lean methodology
- Overall (STATE)
- 21 Tenant-Leaning
- State New Jersey
- 21 Tenant-Leaning · D+6
- County
- — inherits STATE
- City
- — inherits STATE
ZIP-level market 08401
- Home prices YoY
- -7.0%
- Rents YoY
- 5.5%
- Active inventory
- 482
- Price-to-rent
- 30.5×
Monthly cashflow live
- Estimated rent
- $12,723 high interval (Pro) →
- Mortgage (P&I)
- −$4,190
- Tax from tax record
- −$563 /mo · $6,760/yr
- Insurance
- −$333
- Flood insurance flood zone
- −$427 /mo · $5,118/yr
- HOA
- −$0
- Vacancy / Maint / Mgmt
- −$2,672
- Net cashflow
- $4,538
Break-even live
6-unit breakdown (identical units grouped — click to expand)
| Units | Beds | Baths | Est. rent |
|---|---|---|---|
| 5× units | 2 | 1 | $10,925 |
| #1 | 2 | 1 | $2,185 |
| #2 | 2 | 1 | $2,185 |
| #3 | 2 | 1 | $2,185 |
| #4 | 2 | 1 | $2,185 |
| #5 | 2 | 1 | $2,185 |
| 1× unit | 1 | 1 | $1,796 |
| Total (6 units) | $12,723 | ||
UW: 25.0% down · 7.5% · 30yr · 1.5% tax · 5.0% vac · 8.0% maint · 8.0% mgmt
Financing live
Cash to close
- Down payment
- $199,750
- Closing costs
- $23,970
- Reserves months
- —
- Total cash needed
- —
Loan-product check · same deal, 3 products live
Conventional
25% down · 7.5% · 30yr
- Down + closing
- —
- Monthly P&I
- —
- Monthly cashflow
- —
- DSCR
- —
- Eligible?
- —
Personal DTI + credit; lowest rate.
DSCR
20% down · 8.5% · 30yr
- Down + closing
- —
- Monthly P&I
- —
- Monthly cashflow
- —
- DSCR
- —
- Eligible?
- —
No personal income docs; deal must DSCR.
Hard money
10% down · 12.0% · 12mo
- Down + closing
- —
- Monthly P&I
- —
- Monthly cashflow
- —
- DSCR
- —
- Eligible?
- —
Short-term bridge; refi at stabilization.
Listing history 24 events
-
2026-06-19days on market $799,000 Active 232 DOM
-
2026-06-18days on market $799,000 Active 231 DOM
-
2026-06-17days on market $799,000 Active 230 DOM
-
2026-06-16days on market $799,000 Active 229 DOM
-
2026-06-15days on market $799,000 Active 228 DOM
-
2026-06-14days on market $799,000 Active 226 DOM
-
2026-06-13days on market $799,000 Active 225 DOM
-
2026-06-10days on market $799,000 Active 223 DOM
-
2026-06-09days on market $799,000 Active 222 DOM
-
2026-06-08days on market $799,000 Active 221 DOM
-
2026-06-07days on market $799,000 Active 220 DOM
-
2026-06-02days on market $799,000 Active 215 DOM
-
2026-06-01days on market $799,000 Active 214 DOM
-
2026-05-31days on market $799,000 Active 213 DOM
-
2026-05-30days on market $799,000 Active 212 DOM
-
2026-04-22price $799,000 1194-char remark
Show marketing remark (1194 chars)
Opportunity meets vision at 111 Oriental Avenue, a property positioned just steps from the Atlantic City Boardwalk and the oceanfront. The structure has already been gutted and fit out for six units - five two-bedroom, one one-bedroom - all with one bath, in accordance with the City's current six-unit limit. A variance would be required for any additional units, including the potential to reactivate the basement level which was once utilized for living space. The groundwork has been laid with all brand-new windows installed, plywood flooring in place, and a full basement offering added flexibility pending approvals. What makes this offering compelling is not only the existing configuration, but the location. With direct ocean views, immediate access to the beach, and proximity to the Ocean Casino Resort and the surrounding corridor of redevelopment, this is the kind of project where smart capital and strong execution will capture the momentum of a market in transition. The area is benefiting from ongoing investment and revitalization, creating the conditions for significant upside in both short-term rental strategies such as Airbnb and long-term, stabilized income approaches.
-
2025-10-09$999,000 Active 1194-char remark
Show marketing remark (1194 chars)
Opportunity meets vision at 111 Oriental Avenue, a property positioned just steps from the Atlantic City Boardwalk and the oceanfront. The structure has already been gutted and fit out for six units - five two-bedroom, one one-bedroom - all with one bath, in accordance with the City's current six-unit limit. A variance would be required for any additional units, including the potential to reactivate the basement level which was once utilized for living space. The groundwork has been laid with all brand-new windows installed, plywood flooring in place, and a full basement offering added flexibility pending approvals. What makes this offering compelling is not only the existing configuration, but the location. With direct ocean views, immediate access to the beach, and proximity to the Ocean Casino Resort and the surrounding corridor of redevelopment, this is the kind of project where smart capital and strong execution will capture the momentum of a market in transition. The area is benefiting from ongoing investment and revitalization, creating the conditions for significant upside in both short-term rental strategies such as Airbnb and long-term, stabilized income approaches.
-
2022-04-08historical 317-char remark
Show marketing remark (317 chars)
Great opportunity awaits here in the heart of AC! Great location right down the street from Ocean Casino. Direct beach front multi family unit. Great for Air B & B or even yearly rentals. Each unit has 1-2 bed rooms. totaling 6 units. Property is currently under construction. So there will be no showings inside.
-
2021-09-22price $1,300,900 317-char remark
Show marketing remark (317 chars)
Great opportunity awaits here in the heart of AC! Great location right down the street from Ocean Casino. Direct beach front multi family unit. Great for Air B & B or even yearly rentals. Each unit has 1-2 bed rooms. totaling 6 units. Property is currently under construction. So there will be no showings inside.
-
2021-07-23$1,500,000 Active 317-char remark
Show marketing remark (317 chars)
Great opportunity awaits here in the heart of AC! Great location right down the street from Ocean Casino. Direct beach front multi family unit. Great for Air B & B or even yearly rentals. Each unit has 1-2 bed rooms. totaling 6 units. Property is currently under construction. So there will be no showings inside.
-
2020-09-01historical
-
2020-03-26$1,300,000 Active
-
2005-02-16soldstatus $425,000
-
2000-08-28soldstatus $162,500
ⓘ Source: listings_history table (triggers on properties + properties_extension) + one-shot
backfill from property_details.listing_events for pre-trigger history.
Tax reassessment forecast NJ · Partial reset (capped growth)
- Current annual tax
- $6,760 · $563/mo
- Projected year-2 tax
- $13,328 · $1,111/mo
- Expected delta
- +$6,568/yr (+$547/mo · 97.2%)
ⓘ Screening estimate from a state-policy table — verify with the county assessor before closing.
Climate risk First Street
- Flood 6/10 Major FEMA zone AE · 86% chance over 30 yrs
- Wildfire 1/10 Low
- Heat 8/10 Severe 8 d/yr ≥94°F today · 18 d/yr by 30 yrs out
- Wind 8/10 Severe 80% chance of damaging wind over 30 yrs
- Air quality 3/10 Moderate 2 unhealthy d/yr today · 3 by 30 yrs out
Nearby sold comps map
Loading sold comps map…
Walkable amenities ~0.75 mi
Loading nearby amenities…
Taxation est. · year 1
- Rental income
- $152,676
- − Mortgage interest
- −$44,756
- − Property taxes
- −$6,760
- − Insurance
- −$9,114
- − Repairs & maintenance
- −$12,214
- − Management
- −$12,214
- − Depreciation
- −$23,244
- Taxable income
- $44,374
- Est. tax owed @ 24.0%
- −$10,650
- After-tax cash flow
- $43,810/yr
For passive investors: Depreciation is non-cash, so a rental often shows a tax loss while cash-flowing — sheltering income. Rental losses are passive: they offset passive income freely, and up to $25,000/yr can offset ordinary (W-2) income if you actively participate and your MAGI is under $100k (phasing out to $0 by $150k); unused losses carry forward. On sale, claimed depreciation is recaptured at up to 25%, and gains may owe capital-gains tax (a 1031 exchange can defer both). Figures are a year-1 estimate at your 24.0% rate — not tax advice; consult a CPA.
Schools (NCES district)
- District
- Atlantic City School District
- NCES district ID
- 3400960
- Math proficiency
- 9% ▼ -12.00%
- Reading proficiency
- 26% ▼ -6.00%
- Median HH income
- $27,842
- Composite
- 13.66/100
- National rank
- #9504
- State rank
- #454 of 472 in NJ
Livability — Atlantic City
- Score
- 55/100
- State rank
- #525
- US rank
- #23095
Category grades
Schools grade is shown separately in the Schools card above.
Census & demographics
- Census place
- Atlantic City, NJ
- County
- Atlantic County · 143,611 people
- City population
- 38,925
- Metro
- Atlantic City-Hammonton, NJ
- Population (ZIP)
- 38,925
- Household income
- $41,126
- Rent vs Own
- Severe rent burden
- 3414.0
Population outlook (Atlantic County) Hauer SSP2
- Today (2025)
- 268,948 people
- By 2030
- 264,497 · -1.7%
- By 2040
- 252,261 · -6.2%
- By 2050
- 237,846 · -11.6%
- By 2075
- 210,650 · -21.7%
- By 2100
- 180,234 · -33.0%
Race, ethnicity, and origin ACS 2023
- Neighborhood character
- Highly diverse neighborhood (Simpson 0.75)
- Race & ethnicity
- Hispanic / Latino 32% Black 32% Asian 16% White 16% Two or more races 11% Native American 2%
- Hispanic origin (detail)
- Mexican 10% Puerto Rican 8% Dominican 8%
- Common ancestry
- Romanian 1% Scotch-Irish 1%
- Foreign-born
- 29% · Canada, Vietnam, Jamaica
- Languages at home
- 52% English-only · Spanish 30% Other Indo-European 8% Vietnamese 3%
Political lean MEDSL · Atlantic
- 2024 margin
- Toss-up / Even · D 47.7% · R 50.7% · Other 1.6%
- 2008→2024 swing
- -18.1pp toward R · 2008: 15.1pp · 2024: -3.0pp
- All cycles
- 2024: R+3.0 2020: D+6.7 2016: D+6.2 2012: D+17.2 2008: D+15.1
Not yet ingested
- Civics
- —
Market trends
- HPI YoY
- ▼ -26.82%
- Current HPI
- 353.7827
- Rent YoY
- ▲ 5.52%
- Metro
- Atlantic City-Hammonton, NJ
- State GDP YoY
- ▲ 2.05%
- F500 in state
- 34
Industry mix (Fortune 500 HQ in NJ)
| Industry | F500 HQs | Revenue |
|---|---|---|
| Consumer Goods | 3 | $31B |
|
||
| Pharmaceuticals | 2 | $153B |
|
||
| Technology | 2 | $21B |
|
||
| Insurance | 2 | $20B |
|
||
| Healthcare | 2 | $19B |
|
||
| Financial Services | 1 | $70B |
|
||
Price history
+391.7% since first listed9 events — show timeline
- 2026-04-22 Price Changed $799,000 SJSRMLS
- 2025-10-09 Listed $999,000 SJSRMLS
- 2022-04-08 Listing Removed — SJSRMLS
- 2021-09-22 Price Changed $1,300,900 SJSRMLS
- 2021-07-23 Listed $1,500,000 SJSRMLS
- 2020-09-01 Listing Removed — SJSRMLS
- 2020-03-26 Listed $1,300,000 SJSRMLS
- 2005-02-16 Sold (Public Records) $425,000 Public Records
- 2000-08-28 Sold (Public Records) $162,500 Public Records
Property tax history
-3.5%/yrLatest (2025): $6,760 · -2.1% YoY. Source: county tax records.
Cash-flow waterfall
monthlySold comps — $/sqft
last 12 mo · ≤1 miLoading sold comps…