12590 NE 16th Ave #209 · North Miami, FL
Flood risk 9/10 · Severe
- FEMA flood zone
- AE
- Chance of flooding over 30 yrs
- 0.99%
- Est. flood insurance / yr
- $1,737 – $8,500
Fire risk 1/10 · Minimal
- Est. fire insurance / yr
- $947 – $1,759
Heat risk 10/10 · Severe
- Hot days now (above 103°F)
- 7 days/yr
- Hot days in 30 yrs
- 29 days/yr
Wind risk 10/10 · Severe
- Chance of severe wind over 30 yrs
- 99.0%
Air-quality risk 2/10 · Minimal
- Unhealthy air days now
- 1 days/yr
- Unhealthy air days in 30 yrs
- 2 days/yr
Risk factors via First Street. Map © Google.
Why this score? — see what drove the B grade
The composite is a weighted blend of 9 inputs, each scored 0–100. Each bar is that input's sub-score; the figure is the points it added to the 100-point composite (weight × sub-score).
- Cash flow +30.0/30.0
- 1% rule +10.0/10.0
- DSCR +10.0/10.0
- ARV discount +7.5/15.0
- Schools +4.2/10.0
- Livability +4.2/5.0
- Condition / age +2.5/5.0
- Rent growth +2.3/5.0
- Appreciation +0.0/10.0
$118,000
🖨 Deal sheet 📄 Offer letter ✓ Due diligence
Listing remarks MLS
AMAZING 1/1.5 WITH MODERN RENOVATIONS THROUGHOUT. TONS OF NATURAL LIGHT. NEW CABINETS & COUNTER TOPS IN KITCHEN AND BATHS. NEW STAINLESS STEEL APPLIANCES TO BE INSTALLED PRIOR TO CLOSING. NEW TILED TUB SURROUND. RAIN SHOWER HEAD. LARGE CLOSETS. FRESHLY PA INTED. GATED PARKING. SCREENED IN BALCONY WITH STUNNING POOL AND LAKE VIEWS! ELEVATORS. 1ST FLOOR LAUNDRY. WALKING DISTANCE TO JOHNSON & WALES, SHOPS, RESTAURANTS AND PUBLIX. LOW MAINTENANCE FEE. * * MOVE IN READY! * *
Key facts
- Gated community
- High-growth location
- $878 HOA
Tags
Property features AI
Finance
- Financial info: Pets allowed with restrictions or possible restrictions (conditional)
- HOA & community: Monthly association fee; Association fee covers amenities, common areas, structure maintenance, and parking; Community amenities include laundry, pool, and elevator(s); Community of about 50 units
Exterior
- Parking: Assigned parking; One covered space; Garage with one space and garage door opener; Secured garage/parking
- Security: Complex fenced; Key card entry
- Utilities: Has cooling (central air); Has heating (central)
- Home design: Condo/Apartment in a 6-story building; Faces west; Entry on level 2; Attached property
- Construction: Block construction; Resale property
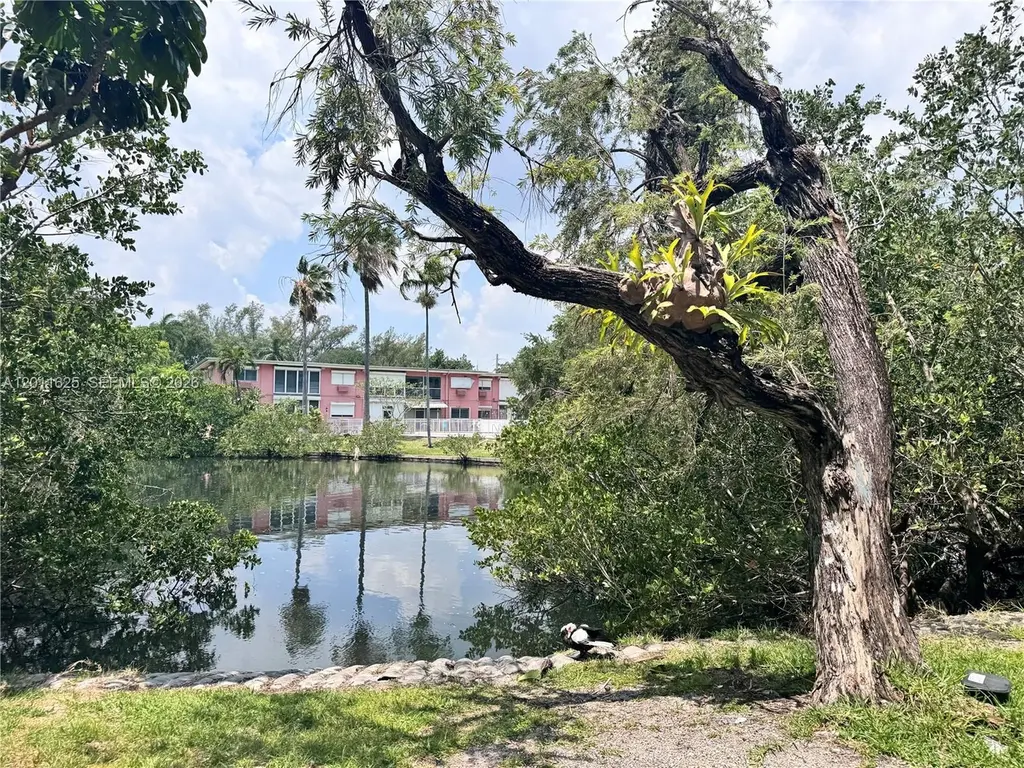
- Exterior features: Balcony; Fence; Lakefront; Association pool
Interior
- Kitchen: Dishwasher; Electric range; Microwave; Refrigerator; Electric water heater
- Flooring: Ceramic tile; Laminate; Tile
- Bathrooms: One full bathroom; One half bathroom
- Heating & cooling: Central heating; Central air conditioning
- Interior features: Sliding windows; Closet cabinetry; Living/Dining room; Walk-in closet(s); Elevator
- Laundry & utility: Common area laundry
Neighborhood map
What this means for you Summary
Snapshot
- This is a 1-bed/1.5-bath condo listed at $118k.
Deal economics
- At list price, monthly cash flow is $477 ($6k/yr) — positive.
- The deal already cash-flows at list — no discount required.
- Meets the 1% rule at list price ($3k rent vs $118k).
- Recommended offer: $114k (3.0% below list) — sets the bar for market timing.
- Cap rate 15.5% vs local median 4.1% in North Miami — top-decile yield for the area; either an underpriced asset or a hidden risk that comps aren't pricing in. Stress-test before assuming the spread holds.
Location & tenants
- Location reads 83/100 on livability (#51 in FL, #914 nationally) — a professional / high-income tenant draw. Strengths: amenities A+, commute A+, health & safety A+; Watch: schools D+, employment D.
- Miami-Dade (suburban): math 45% / reading 54% proficiency, ranked #40 of 73 in FL (top 55%) — families likely to look elsewhere, expect single-tenant / working-renter base with shorter leases; 64% free/reduced lunch — lower-income household profile, screen leases tightly.
- Market conditions: Rents soft (-0.7%/yr); 338 active listings in the ZIP; 2 comparable units currently listed for rent nearby; 10,051 units permitted in Miami-Dade County in 2024 (7,758 in 5+ unit buildings).
- At $3,173/mo this rent would consume 65% of the median local household income ($58k/yr) (locally 3226% of renters already pay >50% of income on rent) — very limited rent-growth headroom before tenants either downsize or default.
Forward outlook
- Local home prices are declining (-3.0%/yr); year-one equity from $816 of loan paydown is wiped out by about $4k of value loss. Plan a longer hold.
- Miami-Dade County population projected at +28% by 2050 — long-run rental-demand tailwind backs the buy-and-hold thesis.
Negotiation context
- It's been on market 47 days — a 3% lower offer ($114k) is reasonable based on typical stale-listing flexibility.
- 2 sale attempts since 2y ago with the ask held roughly flat each time — persistent listings suggest the price (not the market) is what's stuck; bring a comps-based counter.
- Current owner paid $77k; list at $118k implies a 53% gain — meaningful room to come down on a strong offer.
Risks & watch-outs
- Watch-outs: flood insurance adds $427/mo; HOA is 28% of rent.
- Climate carrying-cost: in FEMA flood zone AE (mandatory federal flood insurance); severe wind risk, 99% chance of damaging wind over 30y; extreme-heat days projected 7→29/yr by 2055 (HVAC capex compounding) — expect insurance premiums to compound above CPI over the hold.
Questions for the listing agent
- It's been on market 47 days. Have you received any prior offers? Is the seller open to a 3% concession, seller financing, or rate buy-down credit?
- Built in 1969 — when were the roof, HVAC, electrical panel, plumbing, and water heater last replaced?
- What's the actual annual flood-insurance premium (NFIP or private), and is the property in a SFHA with mandatory coverage?
- What does the HOA fee cover, when was the last increase, and are there any pending special assessments or reserve-fund shortfalls?
- Any open or pending special assessments — roof, HVAC, plumbing, elevator, façade? What's the per-unit balance and payoff schedule, and is the seller paying it off at close or rolling it to the buyer?
- Is there a deadline driving the sale (1031 exchange, divorce, estate, relocation)? That informs how much negotiation room exists.
- Schools are D-rated, which usually means shorter tenancies and higher turnover. Who's the typical renter profile here, and what's been the actual vacancy rate?
- What's the average days-on-market for RENTAL listings here right now (not sales)? A rising rental-DOM trend means longer vacancies and softer asking-rent achievability than the comps imply.
- What's the recent tenant-quality profile in this submarket — average credit score on applications, eviction rate, late-payment / NSF rate, and stable-employment percentage? A property-management company in the area should have these aggregated.
- How much new apartment / multifamily construction is in the pipeline within 1–3 miles? Heavy new supply (>2% of stock underway) typically softens rents 12–24 months out; light construction supports rent growth.
Investment metrics
- 1% rule
- 2.69% ✓
- Cap rate
- 15.48%
- Cash-on-cash
- 32.81%
- DSCR
- 2.46
- GRM
- 3.1
CMA / ARV
No comps found within radius.
Projected returns pro-forma
-3.0% appreciation · 0.0% rent growth · sell at horizon
- IRR
- 2.3%
- Equity multiple
- 1.08×
- Total profit
- $2,739
- Equity at exit
- $17,594
- IRR
- 4.9%
- Equity multiple
- 1.27×
- Total profit
- $8,777
- Equity at exit
- $10,202
Cash invested: $33,040 (down + closing). Projections, not guarantees.
Landlord ↔ Tenant lean methodology
- Overall (STATE)
- 87 Strongly Landlord-Friendly
- State Florida
- 87 Strongly Landlord-Friendly · R+3
- County
- — inherits STATE
- City
- — inherits STATE
ZIP-level market 33161
- Rents YoY
- -0.7%
- Active inventory
- 338
- Price-to-rent
- 3.1×
Monthly cashflow live
- Estimated rent
- $3,173 medium interval (Pro) →
- Mortgage (P&I)
- −$619
- Tax from tax record
- −$57 /mo · $686/yr
- Insurance
- −$49
- Flood insurance flood zone
- −$427 /mo · $5,118/yr
- HOA
- −$878
- Vacancy / Maint / Mgmt
- −$666
- Net cashflow
- $477
Break-even live
UW: 25.0% down · 7.5% · 30yr · 1.5% tax · 5.0% vac · 8.0% maint · 8.0% mgmt
Financing live
Cash to close
- Down payment
- $29,500
- Closing costs
- $3,540
- Reserves months
- —
- Total cash needed
- —
Loan-product check · same deal, 3 products live
Conventional
25% down · 7.5% · 30yr
- Down + closing
- —
- Monthly P&I
- —
- Monthly cashflow
- —
- DSCR
- —
- Eligible?
- —
Personal DTI + credit; lowest rate.
DSCR
20% down · 8.5% · 30yr
- Down + closing
- —
- Monthly P&I
- —
- Monthly cashflow
- —
- DSCR
- —
- Eligible?
- —
No personal income docs; deal must DSCR.
Hard money
10% down · 12.0% · 12mo
- Down + closing
- —
- Monthly P&I
- —
- Monthly cashflow
- —
- DSCR
- —
- Eligible?
- —
Short-term bridge; refi at stabilization.
Rent comps 2 comps
| Address | Beds | Baths | Sqft | Rent | $/sqft | DOM | Units | Dist |
|---|---|---|---|---|---|---|---|---|
| 2020 NE 135th St #904 North Miami, FL | 2.0 | 2.0 | 963 | $23,509 | $24.41 | 15d | 1 | 0.94mi |
| 2020 NE 135th St North Miami, FL | 2.0 | 2.0 | 963 | $23,509 | $24.41 | 13d | 1 | 0.94mi |
HOA detail condo
- Monthly dues
- $878 · $10,536/yr
- Likely covers
- poolsecurity
- Assessments
- None detected in remarks — confirm with the listing agent.
Listing history 24 events
-
2026-06-18days on market $118,000 Active 47 DOM
-
2026-06-17days on market $118,000 Active 46 DOM
-
2026-06-16days on market $118,000 Active 45 DOM
-
2026-06-15days on market $118,000 Active 44 DOM
-
2026-06-13days on market $118,000 Active 42 DOM
-
2026-06-09days on market $118,000 Active 38 DOM
-
2026-06-08days on market $118,000 Active 37 DOM
-
2026-06-07days on market $118,000 Active 36 DOM
-
2026-06-04days on market $118,000 Active 33 DOM
-
2026-06-03days on market $118,000 Active 32 DOM
-
2026-06-02days on market $118,000 Active 31 DOM
-
2026-06-01days on market $118,000 Active 30 DOM
-
2026-05-31days on market $118,000 Active 29 DOM
-
2026-05-01$118,000 Active
-
2024-04-12historical $1,600
-
2024-03-31price $1,600
-
2024-03-26$1,700
-
2012-11-29soldstatus $77,000
-
2012-11-20soldstatus $77,000 488-char remark
Show marketing remark (488 chars)
AMAZING 1/1.5 WITH MODERN RENOVATIONS THROUGHOUT. TONS OF NATURAL LIGHT. NEW CABINETS & COUNTER TOPS IN KITCHEN AND BATHS. NEW STAINLESS STEEL APPLIANCES TO BE INSTALLED PRIOR TO CLOSING. NEW TILED TUB SURROUND. RAIN SHOWER HEAD. LARGE CLOSETS. FRESHLY PA INTED. GATED PARKING. SCREENED IN BALCONY WITH STUNNING POOL AND LAKE VIEWS! ELEVATORS. 1ST FLOOR LAUNDRY. WALKING DISTANCE TO JOHNSON & WALES, SHOPS, RESTAURANTS AND PUBLIX. LOW MAINTENANCE FEE. * * MOVE IN READY! * *
-
2012-06-06soldstatus $25,000 415-char remark
Show marketing remark (415 chars)
Excellent Corporate Owned 1bed/1.5 bath unit located within walking distance to shops, restaurants and Johnson and Wales University. Low monthly maintenance bldg. NO RENTALS ALLOWED. All offers are "SUBJECT TO" bank Approval and need Pre-Qualification Let ter from Bank of America or Merril Lynch and/or Proof of Funds if ALL CASH. Property SOLD AS-IS. No kitchen appliances. Seller to select Title Agent.
-
2007-08-28soldstatus $122,500
-
2007-02-01soldstatus $122,500
-
1994-02-15soldstatus $22,000
-
1986-09-01soldstatus $24,000
ⓘ Source: listings_history table (triggers on properties + properties_extension) + one-shot
backfill from property_details.listing_events for pre-trigger history.
Tax reassessment forecast FL · Resets to sale price
- Current annual tax
- $686 · $57/mo
- Projected year-2 tax
- $979 · $82/mo
- Expected delta
- +$294/yr (+$24/mo · 42.9%)
ⓘ Screening estimate from a state-policy table — verify with the county assessor before closing.
Climate risk First Street
- Flood 9/10 Extreme FEMA zone AE · 99% chance over 30 yrs
- Wildfire 1/10 Low
- Heat 10/10 Extreme 7 d/yr ≥103°F today · 29 d/yr by 30 yrs out
- Wind 10/10 Extreme 99% chance of damaging wind over 30 yrs
- Air quality 2/10 Low 1 unhealthy d/yr today · 2 by 30 yrs out
Nearby sold comps map
Loading sold comps map…
Walkable amenities ~0.75 mi
Loading nearby amenities…
Taxation est. · year 1
- Rental income
- $38,072
- − Mortgage interest
- −$6,610
- − Property taxes
- −$686
- − Insurance
- −$5,708
- − Repairs & maintenance
- −$3,046
- − Management
- −$3,046
- − HOA
- −$10,536
- − Depreciation
- −$3,433
- Taxable income
- $5,008
- Est. tax owed @ 24.0%
- −$1,202
- After-tax cash flow
- $4,519/yr
For passive investors: Depreciation is non-cash, so a rental often shows a tax loss while cash-flowing — sheltering income. Rental losses are passive: they offset passive income freely, and up to $25,000/yr can offset ordinary (W-2) income if you actively participate and your MAGI is under $100k (phasing out to $0 by $150k); unused losses carry forward. On sale, claimed depreciation is recaptured at up to 25%, and gains may owe capital-gains tax (a 1031 exchange can defer both). Figures are a year-1 estimate at your 24.0% rate — not tax advice; consult a CPA.
Schools (NCES district)
- District
- Miami-Dade
- NCES district ID
- 1200390
- Math proficiency
- 45% ▼ -16.00%
- Reading proficiency
- 54% ▼ -5.00%
- Median HH income
- $43,928
- Composite
- 41.76/100
- National rank
- #3397
- State rank
- #40 of 73 in FL
Livability — North Miami
- Score
- 83/100
- State rank
- #51
- US rank
- #914
Category grades
Schools grade is shown separately in the Schools card above.
Census & demographics
- Census place
- North Miami, FL
- County
- Miami-Dade County · 2,697,751 people
- City population
- 99,437
- Metro
- Miami-Fort Lauderdale-Pompano Beach, FL
- Population (ZIP)
- 54,814
- Household income
- $58,325
- Rent vs Own
- Severe rent burden
- 3226.0
Population outlook (Miami-Dade County) Hauer SSP2
- Today (2025)
- 3,126,439 people
- By 2030
- 3,325,765 · +6.4%
- By 2040
- 3,697,561 · +18.3%
- By 2050
- 4,012,134 · +28.3%
- By 2075
- 4,605,612 · +47.3%
- By 2100
- 4,866,598 · +55.7%
Race, ethnicity, and origin ACS 2023
- Neighborhood character
- Diverse neighborhood (Simpson 0.58)
- Race & ethnicity
- Black 56% Hispanic / Latino 31% Two or more races 18% White 8% Asian 2%
- Hispanic origin (detail)
- Puerto Rican 4% Cuban 7% Dominican 4% Salvadoran 1%
- Common ancestry
- Hispanic 35% Estonian 1% Lithuanian 1%
- Foreign-born
- 51% · Canada, Jamaica, Dominican Republic
- Languages at home
- 25% English-only · French/Haitian/Cajun 41% Spanish 30% Other Indo-European 2%
Political lean MEDSL · Miami-Dade
- 2024 margin
- R (+11.4) · D 43.9% · R 55.4%
- 2008→2024 swing
- -27.6pp toward R · 2008: 16.1pp · 2024: -11.4pp
- All cycles
- 2024: R+11.4 2020: D+7.3 2016: D+29.6 2012: D+23.7 2008: D+16.1
Not yet ingested
- Civics
- —
Market trends
- HPI YoY
- ▼ -492.86%
- Current HPI
- 630.6932
- Rent YoY
- ▼ -0.73%
- Metro
- Miami-Fort Lauderdale-Pompano Beach, FL
- State GDP YoY
- ▲ 3.28%
- F500 in state
- 36
Industry mix (Fortune 500 HQ in FL)
| Industry | F500 HQs | Revenue |
|---|---|---|
| Industrial Technology | 2 | $29B |
|
||
| Insurance | 2 | $17B |
|
||
| Retail | 1 | $60B |
|
||
| Technology Distribution | 1 | $58B |
|
||
| Homebuilding | 1 | $35B |
|
||
| Technology Manufacturing | 1 | $35B |
|
||
Price history
+391.7% since first listed11 events — show timeline
- 2026-05-01 Listed $118,000 MARMLS
- 2024-04-12 Rental Removed $1,600 MARMLS
- 2024-03-31 Price Changed $1,600 MARMLS
- 2024-03-26 Listed for Rent $1,700 MARMLS
- 2012-11-29 Sold (Public Records) $77,000 Public Records
- 2012-11-20 Sold (MLS) $77,000 MARMLS
- 2012-06-06 Sold (MLS) $25,000 MARMLS
- 2007-08-28 Sold (MLS) $122,500 MARMLS
- 2007-02-01 Sold (Public Records) $122,500 Public Records
- 1994-02-15 Sold (Public Records) $22,000 Public Records
- 1986-09-01 Sold (Public Records) $24,000 Public Records
Property tax history
-1.9%/yrLatest (2025): $686 · +2.0% YoY. Source: county tax records.
Cash-flow waterfall
monthlySold comps — $/sqft
last 12 mo · ≤1 miLoading sold comps…