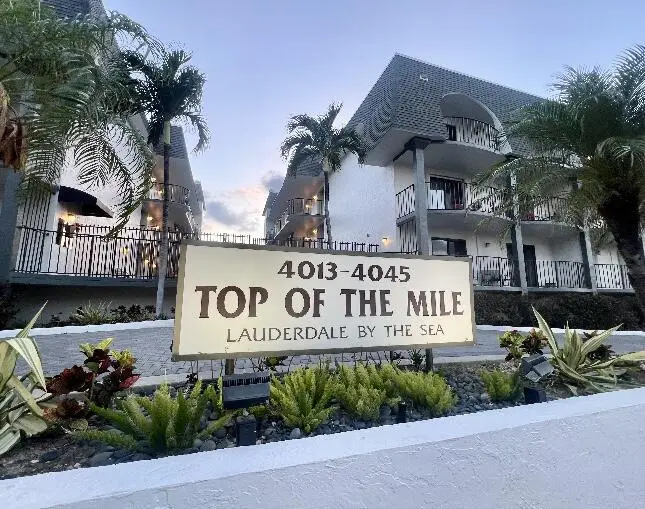
4013 N Ocean Dr N #109 · Lauderdale-by-the-Sea, FL
Flood risk 5/10 · Moderate
- FEMA flood zone
- X (unshaded)
- Chance of flooding over 30 yrs
- 0.24%
- Est. flood insurance / yr
- $507 – $1,088
Fire risk 1/10 · Minimal
- Est. fire insurance / yr
- $947 – $1,759
Heat risk 10/10 · Severe
- Hot days now (above 105°F)
- 7 days/yr
- Hot days in 30 yrs
- 26 days/yr
Wind risk 10/10 · Severe
- Chance of severe wind over 30 yrs
- 99.0%
Air-quality risk 2/10 · Minimal
- Unhealthy air days now
- 1 days/yr
- Unhealthy air days in 30 yrs
- 2 days/yr
Risk factors via First Street. Map © Google.
Why this score? — see what drove the D grade
The composite is a weighted blend of 9 inputs, each scored 0–100. Each bar is that input's sub-score; the figure is the points it added to the 100-point composite (weight × sub-score).
- Cash flow +11.8/30.0
- ARV discount +7.5/15.0
- 1% rule +6.5/10.0
- Schools +4.1/10.0
- DSCR +3.5/10.0
- Rent growth +3.4/5.0
- Livability +2.5/5.0
- Condition / age +2.5/5.0
- Appreciation +0.0/10.0
$285,000
🖨 Deal sheet (PDF) 📄 Offer letter ✓ Due diligence
Listing remarks
GREAT LOCATION SITUATED IN LAUDERDALE BY THE SEA! BOUTIQUE BLDG STEPS TO THE OCEAN WITH DIRECT BEACH ACCESS. MINUTES WALK TO SHOPS AND RESTAURANTS. SPACIOUS ONE BEDROOM CORNER UNIT WITH EXTRA HALF BATH FOR GUESTS, CENTRAL AC, WASHER and DRYER IN UNIT, LARGE DOUBLE BALCONY AND COVERED GARAGE PARKING! BUILDING HAS COMPLETED 40 YR INSPECTIONS AND SIRS STUDY, NEWER ROOF AND RECENTLY PAINTED. WELL KEPT AND MANAGED, DIRECTLY ACROSS ST FROM BEACH. MINUTES WALK TO COMMERCIAL BLVD SHOPS, PIER, RESTAURANTS AND NIGHTLIFE! EASY COMMUTE TO 1-95 AND MAJOR ARTERIES. GREAT BUILDING, RESERVES and ONE OF THE BEST BEACH LOCATIONS IN THE FT LAUDERDALE AREA!
Key facts
- $696 HOA
- Garage
- Community pool
Property features AI
Finance
- Other: Number of units in community: 48
- Financial info: No land lease
- HOA & community: Association: TOP OF THE MILE INC; Quarterly HOA fee; Association amenities include beach access, elevator(s), parking, pool (heated), maintained community, gated access, and maintenance services; HOA covers insurance, grounds and structure maintenance, pest control, sewer, trash, water, common areas, common real estate tax, elevator, legal/accounting, reserve funds, roof repairs, and pool service; Community of 48 units; Pets not allowed
Exterior
- Parking: Total 64 parking spaces in community; Assigned and guest parking; Covered parking (1 covered space); Attached 1-car garage with garage door opener; Open parking (4 spaces); Concrete, paver block and underground/under-building parking available
- Security: Gated community (no guard); Security gate; Secured garage/parking; Security lights; Entry phone/intercom; Elevator secure; Fire alarm; Smoke detectors; Security fence
- Utilities: Public water; Public sewer; Cable available; Electricity connected; Sewer connected; Water connected; Natural gas not available
- Home design: Condominium; One level; Entry level 1; Faces east; Resale
- Construction: Built with block/CBS and stucco (concrete block with stucco); Combination foundation including concrete perimeter, slab, pilings, pillars/posts/piers; raised and permanent elements; Roof materials include concrete, flat, mansard and shingle; 3 total stories in building; Building area from assessor: 790
- Exterior features: Open patio; Patio; Fenced with wrought iron; Full perimeter privacy/security fence with gate; Corner lot; Landscaped; Oversized lot; Sidewalks; Asphalt/paved road
Interior
- Kitchen: Dishwasher; Electric range; Refrigerator; Electric water heater (owned)
- Bedrooms: 1 bedroom on the main level
- Flooring: Carpet; Tile
- Bathrooms: 1 full bathroom; 1 half bathroom
- Heating & cooling: Central heating (electric); Central air conditioning (electric)
- Interior features: Entrance foyer; Custom mirrors; Partially furnished
- Laundry & utility: In-unit laundry; Laundry closet; Electric dryer hookup; Laundry located in bathroom
Neighborhood map
What this means for you Summary
Snapshot
- This is a 1-bed/2.0-bath condo listed at $285k.
Deal economics
- At list price, monthly cash flow is $-79 ($-952/yr) — negative.
- To cash-flow at today's rent, offer at most $271k (4.9% below list).
- Meets the 1% rule at list price ($3k rent vs $285k).
- Recommended offer: $271k (4.9% below list) — sets the bar for cash-flow.
- Cap rate 6.0% vs local median 2.0% in Lauderdale-by-the-Sea — top-decile yield for the area; either an underpriced asset or a hidden risk that comps aren't pricing in. Stress-test before assuming the spread holds.
Location & tenants
- Location reads: area grade D — affects rentability + tenant quality, not the cash-flow math above.
- Broward (suburban): math 42% / reading 53% proficiency, ranked #46 of 73 in FL (top 63%) — families likely to look elsewhere, expect single-tenant / working-renter base with shorter leases.
- Zoned schools: Bayview Elementary School (math 79% / reading 85%, grade A+, #79 of 2,144 statewide, top 4%, 552 students, 23% FRL); Sunrise Middle School (math 50% / reading 52%, grade C, #237 of 571 statewide, top 43%, 1,242 students, 64% FRL); Fort Lauderdale High School (math 38% / reading 67%, grade C-, #154 of 667 statewide, top 24%, 2,228 students, 57% FRL) — zoned schools at 48% FRL track the district average.
- Zoned-school proficiency averages 62% at this address vs 48% district-wide (+14 pts) — the actual schools serving this property are materially stronger than the Broward average implies; a family-tenant draw the district grade alone would hide.
- Market conditions: Rents rising (+3.6%/yr); 746 active listings in the ZIP; 33 comparable units currently listed for rent nearby; rentals at typical pace (median 17d on market — plan ~3-4 weeks tenant-placement turnaround); solid renter incomes; 2,111 units permitted in Broward County in 2024 (1,265 in 5+ unit buildings).
- This rent runs 42% of the median local income ($94k/yr) — at the standard rent-burdened threshold; future hikes will face affordability resistance.
Forward outlook
- Local home prices are declining (-3.0%/yr); year-one equity from $2k of loan paydown is wiped out by about $9k of value loss. Plan a longer hold.
- Broward County population projected at +34% by 2050 — long-run rental-demand tailwind backs the buy-and-hold thesis.
Negotiation context
- It's been on market 53 days — a 3% lower offer ($276k) is reasonable based on typical stale-listing flexibility.
- Current owner paid $80k; list at $285k implies a 256% gain — meaningful room to come down on a strong offer.
Risks & watch-outs
- Watch-outs: HOA is 21% of rent.
- Climate carrying-cost: moderate flood risk; severe wind risk, 99% chance of damaging wind over 30y; extreme-heat days projected 7→26/yr by 2055 (HVAC capex compounding) — expect insurance premiums to compound above CPI over the hold.
Questions for the listing agent
- What do current leases actually rent for vs. the listed asking? Can we see a recent rent roll and the last 12 months of T-12 income?
- It's been on market 53 days. Have you received any prior offers? Is the seller open to a 5% concession, seller financing, or rate buy-down credit?
- Built in 1978 — when were the roof, HVAC, electrical panel, plumbing, and water heater last replaced?
- What does the HOA fee cover, when was the last increase, and are there any pending special assessments or reserve-fund shortfalls?
- Any open or pending special assessments — roof, HVAC, plumbing, elevator, façade? What's the per-unit balance and payoff schedule, and is the seller paying it off at close or rolling it to the buyer?
- Is there a deadline driving the sale (1031 exchange, divorce, estate, relocation)? That informs how much negotiation room exists.
- The area grade is low — what's the realistic commute time and amenity access for the typical tenant pool here? Any planned neighborhood developments (good or bad) we should know about?
- What's the average days-on-market for RENTAL listings here right now (not sales)? A rising rental-DOM trend means longer vacancies and softer asking-rent achievability than the comps imply.
- What's the recent tenant-quality profile in this submarket — average credit score on applications, eviction rate, late-payment / NSF rate, and stable-employment percentage? A property-management company in the area should have these aggregated.
- How much new apartment / multifamily construction is in the pipeline within 1–3 miles? Heavy new supply (>2% of stock underway) typically softens rents 12–24 months out; light construction supports rent growth.
Investment metrics
- 1% rule
- 1.15% ✓
- Cap rate
- 5.96%
- Cash-on-cash
- -1.19%
- DSCR
- 0.95
- GRM
- 7.2
CMA / ARV
No comps found within radius.
Projected returns pro-forma
-3.0% appreciation · 3.63% rent growth · sell at horizon
- IRR
- -17.1%
- Equity multiple
- 0.39×
- Total profit
- $-48,663
- Equity at exit
- $42,494
- IRR
- -7.2%
- Equity multiple
- 0.52×
- Total profit
- $-38,234
- Equity at exit
- $24,642
Cash invested: $79,800 (down + closing). Projections, not guarantees.
Landlord ↔ Tenant lean methodology
- Overall (STATE)
- 87 Strongly Landlord-Friendly
- State Florida
- 87 Strongly Landlord-Friendly · R+3
- County
- — inherits STATE
- City
- — inherits STATE
ZIP-level market 33308
- Rents YoY
- 3.6%
- Active inventory
- 746
- Price-to-rent
- 7.2×
Monthly cashflow live
- Estimated rent
- $3,280 high interval (Pro) →
- Mortgage (P&I)
- −$1,495
- Tax from tax record
- −$361 /mo · $4,335/yr
- Insurance
- −$119
- HOA
- −$696
- Vacancy / Maint / Mgmt
- −$689
- Net cashflow
- $-79
Break-even live
Sensitivity live
| Price | -10% $82 | -5% $1 | +0% $-79 | +5% $-160 | +10% $-241 |
|---|---|---|---|---|---|
| Rent | -10% $-338 | -5% $-209 | +0% $-79 | +5% $50 | +10% $180 |
| Rate | -1.0pp $64 | -0.5pp $-7 | base $-79 | +0.5pp $-153 | +1.0pp $-228 |
UW: 25.0% down · 7.5% · 30yr · 1.5% tax · 5.0% vac · 8.0% maint · 8.0% mgmt
Financing live
Cash to close
- Down payment
- $71,250
- Closing costs
- $8,550
- Reserves months
- —
- Total cash needed
- —
Loan-product check · same deal, 3 products live
Conventional
25% down · 7.5% · 30yr
- Down + closing
- —
- Monthly P&I
- —
- Monthly cashflow
- —
- DSCR
- —
- Eligible?
- —
Personal DTI + credit; lowest rate.
DSCR
20% down · 8.5% · 30yr
- Down + closing
- —
- Monthly P&I
- —
- Monthly cashflow
- —
- DSCR
- —
- Eligible?
- —
No personal income docs; deal must DSCR.
Hard money
10% down · 12.0% · 12mo
- Down + closing
- —
- Monthly P&I
- —
- Monthly cashflow
- —
- DSCR
- —
- Eligible?
- —
Short-term bridge; refi at stabilization.
Rent comps 33 comps
| Address | Beds | Baths | Sqft | Rent | $/sqft | DOM | Units | Dist |
|---|---|---|---|---|---|---|---|---|
| 4013 N Ocean Dr #102 Fort Lauderdale, FL | 1.0 | 1.5 | 790 | $3,500 | $4.43 | 26d | 1 | 0.02mi |
| 4144 El Mar Dr Unit 1 Lauderdale-By-The-Sea, FL | 2.0 | 2.0 | 1116 | $3,250 | $2.91 | 26d | 1 | 0.23mi |
| 4010 Galt Ocean Dr Fort Lauderdale, FL | 2.0–3.0 | 2.0 | 810 | $3,200 | $3.95 | 6d | 3 | 0.43mi |
| 4010 Galt Ocean Dr Fort Lauderdale, FL | 2.0–3.0 | 2.0 | 810 | $5,000 | $6.17 | 7d | 2 | 0.43mi |
| 3900 Galt Ocean Dr Fort Lauderdale, FL | 1.0–2.0 | 1.5–2.0 | 1429 | $3,750 | $2.62 | 0d | 4 | 0.49mi |
| 3900 Galt Ocean Dr Fort Lauderdale, FL | 1.0–2.0 | 1.5–2.0 | 1429 | $3,100 | $2.17 | 19d | 4 | 0.49mi |
| 3850 Galt Ocean Dr #1003 Fort Lauderdale, FL | 1.0 | 1.5 | 1050 | $3,300 | $3.14 | 26d | 1 | 0.54mi |
| 3800 Galt Ocean Dr Fort Lauderdale, FL | 1.0–2.0 | 1.5–2.0 | 1071 | $3,300 | $3.08 | 6d | 6 | 0.58mi |
| 3800 Galt Ocean Dr Fort Lauderdale, FL | 1.0–2.0 | 1.5–2.0 | 1071 | $3,400 | $3.17 | 16d | 6 | 0.58mi |
| 3800 Galt Ocean Dr Fort Lauderdale, FL | 1.0–2.0 | 1.5–2.0 | 1071 | $3,200 | $2.99 | 4d | 7 | 0.58mi |
| 4800 Bayview Dr #303 Fort Lauderdale, FL | 2.0 | 2.0 | 1032 | $3,500 | $3.39 | 26d | 1 | 0.65mi |
| 3700 Galt Ocean Dr Fort Lauderdale, FL | 1.0–2.0 | 1.5–2.0 | 1025 | $3,500 | $3.41 | 26d | 2 | 0.66mi |
| 4512 Sea Grape Dr Unit 1 Lauderdale-By-The-Sea, FL | 1.0 | 1.0 | 853 | $3,500 | $4.10 | 26d | 1 | 0.70mi |
| 3605 NE 32nd Ave Unit 209A Fort Lauderdale, FL | 2.0 | 2.0 | 1000 | $3,300 | $3.30 | 21d | 1 | 0.75mi |
| 3605 NE 32nd Ave Unit 209A Fort Lauderdale, FL | 2.0 | 2.0 | 1000 | $3,300 | $3.30 | 3d | 1 | 0.75mi |
| 3500 Galt Ocean Dr #2314 Fort Lauderdale, FL | 1.0 | 1.5 | 1088 | $4,500 | $4.14 | 26d | 1 | 0.79mi |
| 3500 Galt Ocean Dr #2314 Fort Lauderdale, FL | 1.0 | 1.5 | 1088 | $4,500 | $4.14 | 6d | 1 | 0.79mi |
| 4564 El Mar Dr #4 Lauderdale by the Sea, FL | 1.0 | 1.0 | 566 | $3,500 | $6.18 | 19d | 1 | 0.82mi |
| 3430 Galt Ocean Dr Fort Lauderdale, FL | 1.0–4.0 | 1.5–4.5 | 2873 | $3,980 | $1.39 | 9d | 4 | 0.85mi |
| 3430 Galt Ocean Dr Fort Lauderdale, FL | 1.0–2.0 | 1.5–2.0 | 1343 | $3,200 | $2.38 | 17d | 4 | 0.85mi |
| 4900 N Ocean Blvd #1209 Lauderdale by the Sea, FL | 1.0 | 2.0 | 960 | $4,100 | $4.27 | 16d | 1 | 1.04mi |
| 4900 N Ocean Blvd #1601 Lauderdale by the Sea, FL | 1.0 | 1.5 | 1000 | $4,000 | $4.00 | 26d | 1 | 1.04mi |
| 5000 N Ocean Blvd #506 Lauderdale by the Sea, FL | 1.0 | 1.5 | 1080 | $3,900 | $3.61 | 26d | 1 | 1.12mi |
| 3031 N Ocean Blvd Fort Lauderdale, FL | 2.0–3.0 | 2.0 | 1290 | $3,400 | $2.63 | 9d | 3 | 1.14mi |
| 3031 N Ocean Blvd Fort Lauderdale, FL | 2.0–3.0 | 2.0 | 1290 | $3,200 | $2.48 | 6d | 4 | 1.14mi |
| 3031 N Ocean Blvd Fort Lauderdale, FL | 2.0–3.0 | 2.0 | 1325 | $3,475 | $2.62 | 19d | 3 | 1.14mi |
| 5100 N Ocean Blvd #502 Lauderdale by the Sea, FL | 1.0 | 1.5 | 1080 | $3,400 | $3.15 | 26d | 1 | 1.18mi |
| 3020 NE 32nd Ave Fort Lauderdale, FL | 1.0–2.0 | 1.0–2.0 | 920 | $3,200 | $3.48 | 6d | 4 | 1.21mi |
| 2900 NE 30th St Unit H6 Fort Lauderdale, FL | 2.0 | 2.0 | 1040 | $3,200 | $3.08 | 26d | 1 | 1.25mi |
| 2866 NE 30th St Fort Lauderdale, FL | 2.0 | 2.0 | 931 | $4,900 | $5.26 | 0d | 2 | 1.27mi |
| 2841 N Ocean Blvd Fort Lauderdale, FL | 2.0 | 2.0 | 1150 | $3,700 | $3.22 | 16d | 3 | 1.30mi |
| 6000 N Ocean Blvd Unit 1D Lauderdale by the Sea, FL | 2.0 | 2.0 | 904 | $3,200 | $3.54 | 23d | 1 | 1.46mi |
| 6000 N Ocean Blvd Lauderdale by the Sea, FL | 2.0 | 2.0 | 904 | $3,350 | $3.71 | 0d | 2 | 1.46mi |
HOA detail condo
- Monthly dues
- $696 · $8,352/yr
- Assessments
- None detected in remarks — confirm with the listing agent.
Listing history 18 events
-
2026-06-21days on market $285,000 Active 53 DOM
-
2026-06-18days on market $285,000 Active 50 DOM
-
2026-06-17days on market $285,000 Active 49 DOM
-
2026-06-16days on market $285,000 Active 48 DOM
-
2026-06-15days on market $285,000 Active 47 DOM
-
2026-06-13days on market $285,000 Active 45 DOM
-
2026-06-09days on market $285,000 Active 41 DOM
-
2026-06-08days on market $285,000 Active 40 DOM
-
2026-06-07days on market $285,000 Active 39 DOM
-
2026-06-04days on market $285,000 Active 36 DOM
-
2026-06-03days on market $285,000 Active 35 DOM
-
2026-06-02days on market $285,000 Active 34 DOM
-
2026-06-01days on market $285,000 Active 33 DOM
-
2026-05-31days on market $285,000 Active 32 DOM
-
2026-04-25$285,000 Active
-
2001-02-23soldstatus $80,000
-
1981-06-01soldstatus $78,500
-
1979-11-01soldstatus $72,500
ⓘ Source: listings_history table (triggers on properties + properties_extension) + one-shot
backfill from property_details.listing_events for pre-trigger history.
Tax reassessment forecast FL · Resets to sale price
- Current annual tax
- $4,335 · $361/mo
- Projected year-2 tax
- $4,335 · $361/mo
- Expected delta
- $0/yr ($0/mo · 0.0%)
ⓘ Screening estimate from a state-policy table — verify with the county assessor before closing.
Climate risk First Street
- Flood 5/10 Major FEMA zone X (unshaded) · 24% chance over 30 yrs
- Wildfire 1/10 Low
- Heat 10/10 Extreme 7 d/yr ≥105°F today · 26 d/yr by 30 yrs out
- Wind 10/10 Extreme 99% chance of damaging wind over 30 yrs
- Air quality 2/10 Low 1 unhealthy d/yr today · 2 by 30 yrs out
Nearby sold comps map
Loading sold comps map…
Walkable amenities ~0.75 mi
Loading nearby amenities…
Taxation est. · year 1
- Rental income
- $39,361
- − Mortgage interest
- −$15,964
- − Property taxes
- −$4,335
- − Insurance
- −$1,425
- − Repairs & maintenance
- −$3,149
- − Management
- −$3,149
- − HOA
- −$8,352
- − Depreciation
- −$8,291
- Taxable loss
- −$5,304
- Est. tax savings @ 24.0%
- +$1,273
- After-tax cash flow
- $321/yr
For passive investors: Depreciation is non-cash, so a rental often shows a tax loss while cash-flowing — sheltering income. Rental losses are passive: they offset passive income freely, and up to $25,000/yr can offset ordinary (W-2) income if you actively participate and your MAGI is under $100k (phasing out to $0 by $150k); unused losses carry forward. On sale, claimed depreciation is recaptured at up to 25%, and gains may owe capital-gains tax (a 1031 exchange can defer both). Figures are a year-1 estimate at your 24.0% rate — not tax advice; consult a CPA.
Schools (NCES district)
- District
- Broward
- NCES district ID
- 1200180
- Math proficiency
- 42% ▼ -18.00%
- Reading proficiency
- 53% ▼ -5.00%
- Median HH income
- $52,139
- Composite
- 40.88/100
- National rank
- #3621
- State rank
- #46 of 73 in FL
Livability — Lauderdale-by-the-Sea
No livability data for this city. (Only ~50 U.S. cities are tracked.)
Census & demographics
- Census place
- Lauderdale-by-the-Sea, FL
- County
- Broward County · 1,963,430 people
- City population
- 235,769
- Metro
- Miami-Fort Lauderdale-Pompano Beach, FL
- Population (ZIP)
- 27,935
- Household income
- $93,879
- Rent vs Own
- Severe rent burden
- 912.0
Population outlook (Broward County) Hauer SSP2
- Today (2025)
- 2,207,033 people
- By 2030
- 2,360,704 · +7.0%
- By 2040
- 2,661,208 · +20.6%
- By 2050
- 2,946,698 · +33.5%
- By 2075
- 3,602,273 · +63.2%
- By 2100
- 3,970,984 · +79.9%
Race, ethnicity, and origin ACS 2023
- Neighborhood character
- Predominantly White (75%)
- Race & ethnicity
- White 75% Hispanic / Latino 16% Two or more races 14% Asian 3% Black 2%
- Hispanic origin (detail)
- Puerto Rican 2% Cuban 3%
- Common ancestry
- Romanian 4% Lithuanian 3% Scotch-Irish 3%
- Foreign-born
- 24% · Canada, Jamaica, Dominican Republic
- Languages at home
- 75% English-only · Spanish 14% Other Indo-European 5% Russian/Polish/Slavic 2%
Political lean MEDSL · Broward
- 2024 margin
- D (+17.0) · D 58.0% · R 41.0%
- 2008→2024 swing
- -17.8pp toward R · 2008: 34.7pp · 2024: 17.0pp
- All cycles
- 2024: D+17.0 2020: D+29.8 2016: D+35.0 2012: D+34.9 2008: D+34.7
Not yet ingested
- Civics
- —
Market trends
- HPI YoY
- ▼ -417.95%
- Current HPI
- 325.3902
- Rent YoY
- ▲ 3.63%
- Metro
- Miami-Fort Lauderdale-Pompano Beach, FL
- State GDP YoY
- ▲ 3.28%
- F500 in state
- 36
Industry mix (Fortune 500 HQ in FL)
| Industry | F500 HQs | Revenue |
|---|---|---|
| Industrial Technology | 2 | $29B |
|
||
| Insurance | 2 | $17B |
|
||
| Retail | 1 | $60B |
|
||
| Technology Distribution | 1 | $58B |
|
||
| Homebuilding | 1 | $35B |
|
||
| Technology Manufacturing | 1 | $35B |
|
||
Price history
+293.1% since first listed4 events — show timeline
- 2026-04-25 Listed $285,000 Beaches MLS
- 2001-02-23 Sold (Public Records) $80,000 Public Records
- 1981-06-01 Sold (Public Records) $78,500 Public Records
- 1979-11-01 Sold (Public Records) $72,500 Public Records
Property tax history
+6.5%/yrLatest (2025): $4,335 · +8.1% YoY. Source: county tax records.
Cash-flow waterfall
monthlySold comps — $/sqft
last 12 mo · ≤1 miLoading sold comps…