134 Scout Rd · Jones Creek, TX
Flood risk 7/10 · Major
- FEMA flood zone
- X (shaded)
- Chance of flooding over 30 yrs
- 0.75%
- Est. flood insurance / yr
- $507 – $1,088
Fire risk 4/10 · Minor
- Est. fire insurance / yr
- $1,222 – $2,270
Heat risk 10/10 · Severe
- Hot days now (above 116°F)
- 7 days/yr
- Hot days in 30 yrs
- 25 days/yr
Wind risk 9/10 · Severe
- Chance of severe wind over 30 yrs
- 99.0%
Air-quality risk 2/10 · Minimal
- Unhealthy air days now
- 1 days/yr
- Unhealthy air days in 30 yrs
- 2 days/yr
Risk factors via First Street. Map © Google.
Why this score? — see what drove the B- grade
The composite is a weighted blend of 9 inputs, each scored 0–100. Each bar is that input's sub-score; the figure is the points it added to the 100-point composite (weight × sub-score).
- Cash flow +30.0/30.0
- 1% rule +10.0/10.0
- DSCR +10.0/10.0
- ARV discount +7.5/15.0
- Schools +3.7/10.0
- Livability +3.3/5.0
- Rent growth +2.5/5.0
- Condition / age +2.5/5.0
- Appreciation +0.0/10.0
$69,000
🖨 Deal sheet (PDF) 📄 Offer letter ✓ Due diligence
Listing remarks MLS
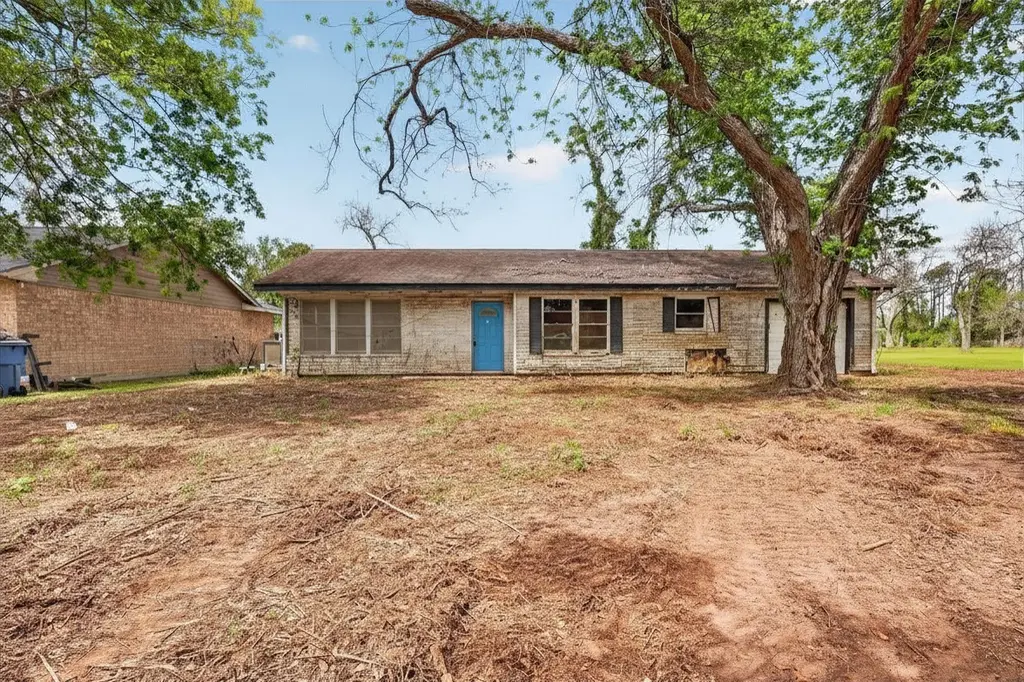
Investor special in an established Freeport neighborhood! This 3-bedroom, 1-bath home offers 1,198 sq. ft. of living space and sits on a spacious, cleared .8-acre lot, providing ample room for expansion, redevelopment, or additional improvements. Built in 1954, the home is in need of significant repairs and updating, making it an ideal project for investors, flippers, or those looking to create value. The large lot is a rare find and offers endless potential for outdoor living, storage, or future development. Conveniently located near local industry, schools, and coastal amenities. Don’t miss your chance to claim this Texas treasure!
Key facts
- Spacious cleared lot
- 0.79 acre lot
- Garage
Tags
Neighborhood map
What this means for you Summary
Snapshot
- This is a 3-bed/1.0-bath single-family listed at $69k.
Deal economics
- At list price, monthly cash flow is $652 ($8k/yr) — positive.
- The deal already cash-flows at list — no discount required.
- Meets the 1% rule at list price ($2k rent vs $69k).
- Recommended offer: $65k (6.0% below list) — sets the bar for market timing.
- Cap rate 18.8% vs local median 1.8% in Jones Creek — top-decile yield for the area; either an underpriced asset or a hidden risk that comps aren't pricing in. Stress-test before assuming the spread holds.
Location & tenants
- Location reads 66/100 on livability (#633 in TX) — a middle-class / working-renter tenant base. Strengths: crime A+, cost of living A+, housing A+; Watch: amenities F, commute F, health & safety F.
- Brazosport ISD (suburban): math 43% / reading 41% proficiency, ranked #305 of 826 in TX (top 37%) — families likely to look elsewhere, expect single-tenant / working-renter base with shorter leases.
- Zoned schools: S F Austin El (math 42% / reading 37%, grade F, #1,545 of 4,322 statewide, top 38%, 265 students, 74% FRL); Freeport Int (math 41% / reading 31%, grade F, #805 of 1,662 statewide, top 50%, 425 students, 86% FRL); Brazosport H S (math 40% / reading 27%, grade F, #1,011 of 1,632 statewide, top 63%, 948 students, 78% FRL) — zoned schools average 80% FRL vs 53% district-wide (27 pts higher); higher-poverty schools than district average — tighter screening recommended.
- Market conditions: 593 active listings in the ZIP; 3,960 units permitted in Brazoria County in 2024 (593 in 5+ unit buildings).
Forward outlook
- Local home prices are declining (-3.0%/yr); year-one equity from $477 of loan paydown is wiped out by about $2k of value loss. Plan a longer hold.
- Brazoria County population projected at +44% by 2050 — long-run rental-demand tailwind backs the buy-and-hold thesis.
- At projected returns (-3.0% appreciation + 3.0% rent growth), your $19k cash investment doubles in ~3 years — after that, you're playing with house money.
Negotiation context
- It's been on market 73 days — a 6% lower offer ($65k) is reasonable based on typical stale-listing flexibility.
Risks & watch-outs
- Watch-outs: flood insurance adds $66/mo; built in 1954 — expect roof / HVAC / electrical / plumbing capex.
- Climate carrying-cost: major flood risk; severe wind risk, 99% chance of damaging wind over 30y; extreme-heat days projected 7→25/yr by 2055 (HVAC capex compounding) — expect insurance premiums to compound above CPI over the hold.
Questions for the listing agent
- It's been on market 73 days. Have you received any prior offers? Is the seller open to a 6% concession, seller financing, or rate buy-down credit?
- Built in 1954 — when were the roof, HVAC, electrical panel, plumbing, and water heater last replaced?
- What's the actual annual flood-insurance premium (NFIP or private), and is the property in a SFHA with mandatory coverage?
- Why hasn't it sold? Are there any deal-killer items the seller is aware of (foundation, flood, title, zoning, code violations)?
- Is there a deadline driving the sale (1031 exchange, divorce, estate, relocation)? That informs how much negotiation room exists.
- Schools are F-rated, which usually means shorter tenancies and higher turnover. Who's the typical renter profile here, and what's been the actual vacancy rate?
- What's the average days-on-market for RENTAL listings here right now (not sales)? A rising rental-DOM trend means longer vacancies and softer asking-rent achievability than the comps imply.
- What's the recent tenant-quality profile in this submarket — average credit score on applications, eviction rate, late-payment / NSF rate, and stable-employment percentage? A property-management company in the area should have these aggregated.
- How much new for-sale + rental construction is in the pipeline within 1–3 miles? Heavy new supply typically softens prices + rents 12–24 months out; constrained supply supports both.
Investment metrics
- 1% rule
- 2.19% ✓
- Cap rate
- 18.79%
- Cash-on-cash
- 44.62%
- DSCR
- 2.99
- GRM
- 3.8
CMA / ARV
- ARV (median comp)
- $163,273
- List price
- $69,000
- Delta
- -57.74%
- Verdict
- UNDERPRICED
- Comps
- 18 within 1.0 mi
Show comp detail 2 sales within ~0.75 mi
| Address | Dist | Beds/Ba | Sqft | Sold | Price | $/sf | Match |
|---|---|---|---|---|---|---|---|
| 7342 Live Oak Dr | 0.38mi | 3/1.0 | 1,262 (+5%) | 2mo | $150,000 | $119 | 71 |
| 7219 Live Oak Dr | 0.27mi | 4/1.0 (+1) | 1,068 (-11%) | 14mo | $78,500 | $74 | 53 |
Match score weights: distance 35% · size 25% · config 20% · recency 20%. Top-matched comps best support the ARV.
Projected returns pro-forma
-3.0% appreciation · 3.0% rent growth · sell at horizon
- IRR
- 37.0%
- Equity multiple
- 2.57×
- Total profit
- $30,402
- Equity at exit
- $10,288
- IRR
- 43.6%
- Equity multiple
- 5.15×
- Total profit
- $80,196
- Equity at exit
- $5,966
Cash invested: $19,320 (down + closing). Projections, not guarantees.
Landlord ↔ Tenant lean methodology
- Overall (STATE)
- 87 Strongly Landlord-Friendly
- State Texas
- 87 Strongly Landlord-Friendly · R+5
- County
- — inherits STATE
- City
- — inherits STATE
ZIP-level market 77541
- Home prices YoY
- -29.3%
- Active inventory
- 593
- Price-to-rent
- 3.8×
Monthly cashflow live
- Estimated rent
- $1,513 medium interval (Pro) →
- Mortgage (P&I)
- −$362
- Tax est. 1.5%
- −$86 /mo · $1,035/yr
- Insurance
- −$29
- Flood insurance flood zone
- −$66 /mo · $798/yr
- HOA
- −$0
- Vacancy / Maint / Mgmt
- −$318
- Net cashflow
- $652
Break-even live
Sensitivity live
| Price | -10% $700 | -5% $676 | +0% $652 | +5% $628 | +10% $604 |
|---|---|---|---|---|---|
| Rent | -10% $532 | -5% $592 | +0% $652 | +5% $712 | +10% $771 |
| Rate | -1.0pp $687 | -0.5pp $669 | base $652 | +0.5pp $634 | +1.0pp $616 |
UW: 25.0% down · 7.5% · 30yr · 1.5% tax · 5.0% vac · 8.0% maint · 8.0% mgmt
Financing live
Cash to close
- Down payment
- $17,250
- Closing costs
- $2,070
- Reserves months
- —
- Total cash needed
- —
Loan-product check · same deal, 3 products live
Conventional
25% down · 7.5% · 30yr
- Down + closing
- —
- Monthly P&I
- —
- Monthly cashflow
- —
- DSCR
- —
- Eligible?
- —
Personal DTI + credit; lowest rate.
DSCR
20% down · 8.5% · 30yr
- Down + closing
- —
- Monthly P&I
- —
- Monthly cashflow
- —
- DSCR
- —
- Eligible?
- —
No personal income docs; deal must DSCR.
Hard money
10% down · 12.0% · 12mo
- Down + closing
- —
- Monthly P&I
- —
- Monthly cashflow
- —
- DSCR
- —
- Eligible?
- —
Short-term bridge; refi at stabilization.
Listing history 17 events
-
2026-06-21days on market $69,000 Active 73 DOM
-
2026-06-18days on market $69,000 Active 70 DOM
-
2026-06-17pricedays on market $69,000 Active 69 DOM
-
2026-06-16days on market $74,000 Active 68 DOM
-
2026-06-15days on market $74,000 Active 67 DOM
-
2026-06-13days on market $74,000 Active 65 DOM
-
2026-06-09days on market $74,000 Active 61 DOM
-
2026-06-08pricedays on market $74,000 Active 60 DOM
-
2026-06-07days on market $79,999 Active 59 DOM
-
2026-06-04days on market $79,999 Active 56 DOM
-
2026-06-03days on market $79,999 Active 55 DOM
-
2026-06-02days on market $79,999 Active 54 DOM
-
2026-06-01days on market $79,999 Active 53 DOM
-
2026-05-31days on market $79,999 Active 52 DOM
-
2026-05-01price $89,999 647-char remark
Show marketing remark (647 chars)
Investor special in an established Freeport neighborhood! This 3-bedroom, 1-bath home offers 1,198 sq. ft. of living space and sits on a spacious, cleared .8-acre lot, providing ample room for expansion, redevelopment, or additional improvements. Built in 1954, the home is in need of significant repairs and updating, making it an ideal project for investors, flippers, or those looking to create value. The large lot is a rare find and offers endless potential for outdoor living, storage, or future development. Conveniently located near local industry, schools, and coastal amenities. Don’t miss your chance to claim this Texas treasure!
-
2026-04-21price $99,999 647-char remark
Show marketing remark (647 chars)
Investor special in an established Freeport neighborhood! This 3-bedroom, 1-bath home offers 1,198 sq. ft. of living space and sits on a spacious, cleared .8-acre lot, providing ample room for expansion, redevelopment, or additional improvements. Built in 1954, the home is in need of significant repairs and updating, making it an ideal project for investors, flippers, or those looking to create value. The large lot is a rare find and offers endless potential for outdoor living, storage, or future development. Conveniently located near local industry, schools, and coastal amenities. Don’t miss your chance to claim this Texas treasure!
-
2026-04-09$110,000 Active 647-char remark
Show marketing remark (647 chars)
Investor special in an established Freeport neighborhood! This 3-bedroom, 1-bath home offers 1,198 sq. ft. of living space and sits on a spacious, cleared .8-acre lot, providing ample room for expansion, redevelopment, or additional improvements. Built in 1954, the home is in need of significant repairs and updating, making it an ideal project for investors, flippers, or those looking to create value. The large lot is a rare find and offers endless potential for outdoor living, storage, or future development. Conveniently located near local industry, schools, and coastal amenities. Don’t miss your chance to claim this Texas treasure!
ⓘ Source: listings_history table (triggers on properties + properties_extension) + one-shot
backfill from property_details.listing_events for pre-trigger history.
Climate risk First Street
- Flood 7/10 Severe FEMA zone X (shaded) · 75% chance over 30 yrs
- Wildfire 4/10 Moderate
- Heat 10/10 Extreme 7 d/yr ≥116°F today · 25 d/yr by 30 yrs out
- Wind 9/10 Extreme 99% chance of damaging wind over 30 yrs
- Air quality 2/10 Low 1 unhealthy d/yr today · 2 by 30 yrs out
Nearby sold comps map
Loading sold comps map…
Walkable amenities ~0.75 mi
Loading nearby amenities…
Taxation est. · year 1
- Rental income
- $18,155
- − Mortgage interest
- −$3,865
- − Property taxes
- −$1,035
- − Insurance
- −$1,142
- − Repairs & maintenance
- −$1,452
- − Management
- −$1,452
- − Depreciation
- −$2,007
- Taxable income
- $7,200
- Est. tax owed @ 24.0%
- −$1,728
- After-tax cash flow
- $6,095/yr
For passive investors: Depreciation is non-cash, so a rental often shows a tax loss while cash-flowing — sheltering income. Rental losses are passive: they offset passive income freely, and up to $25,000/yr can offset ordinary (W-2) income if you actively participate and your MAGI is under $100k (phasing out to $0 by $150k); unused losses carry forward. On sale, claimed depreciation is recaptured at up to 25%, and gains may owe capital-gains tax (a 1031 exchange can defer both). Figures are a year-1 estimate at your 24.0% rate — not tax advice; consult a CPA.
Schools (NCES district)
- District
- Brazosport ISD
- NCES district ID
- 4811190
- Math proficiency
- 43% ▼ -6.00%
- Reading proficiency
- 41% ▼ -2.00%
- Median HH income
- $57,024
- Composite
- 36.84/100
- National rank
- #4557
- State rank
- #305 of 826 in TX
Livability — Jones Creek
- Score
- 66/100
- State rank
- #633
- US rank
- #12077
Category grades
Schools grade is shown separately in the Schools card above.
Census & demographics
- Census place
- Jones Creek, TX
- County
- Brazoria County · 374,982 people
- Metro
- Houston-The Woodlands-Sugar Land, TX
- Population (ZIP)
- 16,996
- Household income
- $66,507
- Rent vs Own
- Severe rent burden
- 354.0
Population outlook (Brazoria County) Hauer SSP2
- Today (2025)
- 420,414 people
- By 2030
- 457,585 · +8.8%
- By 2040
- 532,232 · +26.6%
- By 2050
- 605,399 · +44.0%
- By 2075
- 779,358 · +85.4%
- By 2100
- 883,759 · +110.2%
Race, ethnicity, and origin ACS 2023
- Neighborhood character
- Diverse neighborhood (Simpson 0.62)
- Race & ethnicity
- Hispanic / Latino 47% White 38% Two or more races 23% Black 12%
- Hispanic origin (detail)
- Mexican 42%
- Common ancestry
- Romanian 1% Italian 1% Lithuanian 1%
- Foreign-born
- 12% · Canada
- Languages at home
- 71% English-only · Spanish 29%
Political lean MEDSL · Brazoria
- 2024 margin
- R (+19.7) · D 39.5% · R 59.2% · Other 1.3%
- 2008→2024 swing
- +9.9pp toward D · 2008: -29.6pp · 2024: -19.7pp
- All cycles
- 2024: R+19.7 2020: R+18.2 2016: R+24.6 2012: R+34.2 2008: R+29.6
Not yet ingested
- Civics
- —
Market trends
- HPI YoY
- ▼ -110.12%
- Current HPI
- 265.9301
- Rent YoY
- —
- Metro
- Houston-The Woodlands-Sugar Land, TX
- State GDP YoY
- ▲ 3.95%
- F500 in state
- 110
Industry mix (Fortune 500 HQ in TX)
| Industry | F500 HQs | Revenue |
|---|---|---|
| Energy | 16 | $1,198B |
|
||
| Technology | 5 | $198B |
|
||
| Engineering / Construction | 4 | $72B |
|
||
| Energy Services | 3 | $60B |
|
||
| Utilities | 3 | $41B |
|
||
| Healthcare | 2 | $330B |
|
||
Price history
-18.2% since first listed3 events — show timeline
- 2026-05-01 Price Changed $89,999 HARMLS
- 2026-04-21 Price Changed $99,999 HARMLS
- 2026-04-09 Listed $110,000 HARMLS
Property tax history
+8.0%/yrLatest (2025): $3,474 · +3.0% YoY. Source: county tax records.
Cash-flow waterfall
monthlySold comps — $/sqft
last 12 mo · ≤1 miLoading sold comps…