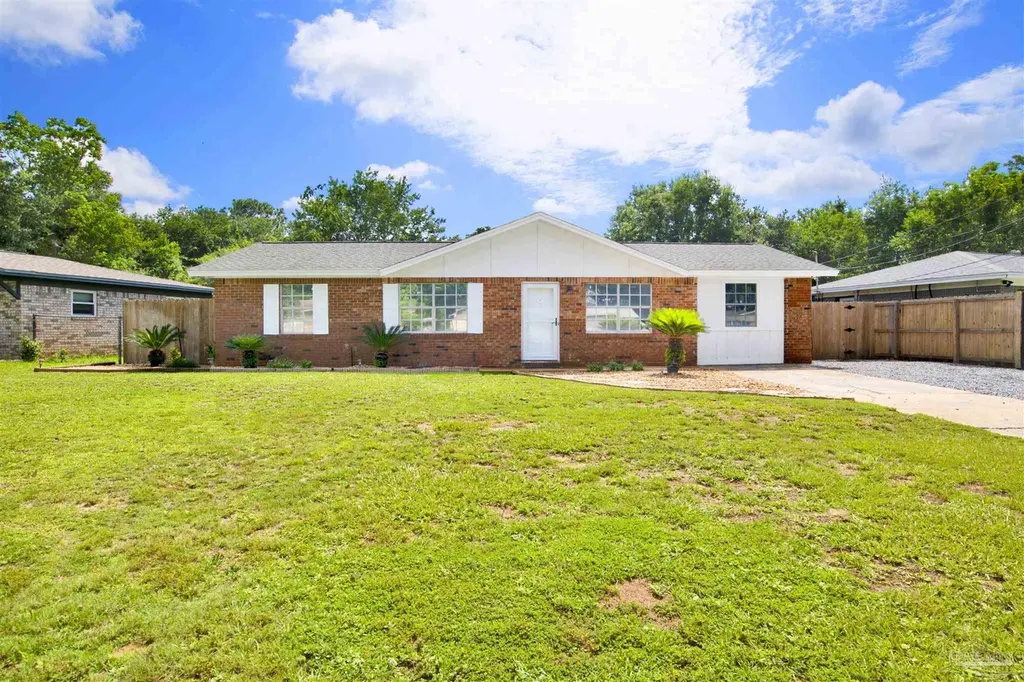
3040 Newton Dr · Pensacola, FL
Flood risk 1/10 · Minimal
- FEMA flood zone
- X (unshaded)
- Chance of flooding over 30 yrs
- 0.0%
- Est. flood insurance / yr
- $507 – $1,088
Fire risk 1/10 · Minimal
- Est. fire insurance / yr
- $947 – $1,759
Heat risk 10/10 · Severe
- Hot days now (above 105°F)
- 7 days/yr
- Hot days in 30 yrs
- 22 days/yr
Wind risk 9/10 · Severe
- Chance of severe wind over 30 yrs
- 99.0%
Air-quality risk 1/10 · Minimal
- Unhealthy air days now
- 0 days/yr
- Unhealthy air days in 30 yrs
- 0 days/yr
Risk factors via First Street. Map © Google.
Why this score? — see what drove the C grade
The composite is a weighted blend of 9 inputs, each scored 0–100. Each bar is that input's sub-score; the figure is the points it added to the 100-point composite (weight × sub-score).
- Cash flow +18.9/30.0
- ARV discount +12.7/15.0
- DSCR +6.0/10.0
- Livability +4.2/5.0
- 1% rule +3.8/10.0
- Schools +3.6/10.0
- Rent growth +3.3/5.0
- Condition / age +2.5/5.0
- Appreciation +0.0/10.0
$300,000
🖨 Deal sheet 📄 Offer letter ✓ Due diligence
Listing remarks MLS
ADDENDUM MUST BE SIGNED TO PRESENT OFFERS.FORECLOSED PROPERTY LOTS OF ROOM. LOTS OF POTENTIAL.CONVENIENT MALLORY HEIGHTS SUBDIVISION.
Key facts
- 8,324 sq ft lot
- Built 1972
- Listed 6 days
Property features AI
Finance
- Other: Paved public maintained road access
- HOA & community: No homeowners association
Exterior
- Parking: Driveway with open parking
- Security: Smoke detector(s)
- Utilities: Public water; Public sewer; Circuit breakers for electric; Cable available
- Home design: Single-story frame house; One level; Resale property; Not attached to another property; Homestead exempt; Green features include insulation, insulated floors and walls, and ridge vent
- Construction: Frame construction; Slab foundation
- Exterior features: Patio; Sprinkler system; Satellite dish; Back yard fencing with privacy panels; Shingle roof
Interior
- Kitchen: Updated kitchen with pantry; Stainless steel appliances; Butcher block countertops; White shaker cabinets; Built-in microwave
- Bedrooms: Primary bedroom on the first floor (approx. 13.4' x 15.6'); Bedroom 1 on the first floor (approx. 9.3' x 13.1'); Bedroom 2 on the first floor (approx. 10.1' x 9.6'); Bedroom 3 on the first floor (approx. 9.3' x 9.1')
- Flooring: Tile flooring
- Bathrooms: Two full bathrooms; Updated vanities, toilets and fixtures (updated within 1–5 years)
- Heating & cooling: Central heating; Central air; Ceiling fans
- Interior features: Storage; Baseboards; Ceiling fan(s); High speed internet; Bonus room; Insulated doors; Storm door(s); Blinds; Shutters
- Laundry & utility: Washer and dryer included; Laundry inside with washer/dryer hookups; Electric water heater
Neighborhood map
What this means for you Summary
Snapshot
- This is a 4-bed/2.0-bath single-family listed at $300k.
Deal economics
- At list price, monthly cash flow is $310 ($4k/yr) — positive.
- The deal already cash-flows at list — no discount required.
- To meet the 1% rule (rent ≥ 1% of price), the offer needs to be $265k (11.8% below list).
- Recommended offer: $265k (11.8% below list) — sets the bar for 1% rule.
- Cap rate 7.5% vs local median 3.6% in Pensacola — top-decile yield for the area; either an underpriced asset or a hidden risk that comps aren't pricing in. Stress-test before assuming the spread holds.
Location & tenants
- Location reads 83/100 on livability (#53 in FL, #924 nationally) — a professional / high-income tenant draw. Strengths: commute A+, cost of living A+, housing A+.
- Escambia (suburban): math 40% / reading 45% proficiency, ranked #56 of 73 in FL (top 77%) — families likely to look elsewhere, expect single-tenant / working-renter base with shorter leases.
- Market conditions: Rents rising (+3.4%/yr); 240 active listings in the ZIP; 4 comparable units currently listed for rent nearby; rentals at typical pace (median 23d on market — plan ~3-4 weeks tenant-placement turnaround); 1,479 units permitted in Escambia County in 2024 (0 in 5+ unit buildings).
- This rent runs 44% of the median local income ($71k/yr) — at the standard rent-burdened threshold; future hikes will face affordability resistance.
Forward outlook
- Local home prices are declining (-3.0%/yr); year-one equity from $2k of loan paydown is wiped out by about $9k of value loss. Plan a longer hold.
- Escambia County population projected at +13% by 2050 — modest demand growth; plan on rents tracking national, not racing it.
Negotiation context
- Only 7 days on market — expect competitive offers; lowballing is unlikely to land.
- 2 sale attempts since 26y ago with the ask held roughly flat each time — persistent listings suggest the price (not the market) is what's stuck; bring a comps-based counter.
- Current owner paid $64k; list at $300k implies a 369% gain — meaningful room to come down on a strong offer.
Risks & watch-outs
- Climate carrying-cost: severe wind risk, 99% chance of damaging wind over 30y; extreme-heat days projected 7→22/yr by 2055 (HVAC capex compounding) — expect insurance premiums to compound above CPI over the hold.
Questions for the listing agent
- Built in 1972 — when were the roof, HVAC, electrical panel, plumbing, and water heater last replaced?
- Is there a deadline driving the sale (1031 exchange, divorce, estate, relocation)? That informs how much negotiation room exists.
- What's the average days-on-market for RENTAL listings here right now (not sales)? A rising rental-DOM trend means longer vacancies and softer asking-rent achievability than the comps imply.
- What's the recent tenant-quality profile in this submarket — average credit score on applications, eviction rate, late-payment / NSF rate, and stable-employment percentage? A property-management company in the area should have these aggregated.
- How much new for-sale + rental construction is in the pipeline within 1–3 miles? Heavy new supply typically softens prices + rents 12–24 months out; constrained supply supports both.
Investment metrics
- 1% rule
- 0.88% ✗
- Cap rate
- 7.53%
- Cash-on-cash
- 4.42%
- DSCR
- 1.20
- GRM
- 9.4
CMA / ARV
- ARV (on-the-fly)
- $339,605
- Comps found
- 12
Show comp detail 12 sales within ~0.75 mi
| Address | Dist | Beds/Ba | Sqft | Sold | Price | $/sf | Match |
|---|---|---|---|---|---|---|---|
| 3121 Whistler Dr | 0.07mi | 3/2.0 (-1) | 1,625 (+4%) | 1mo | $349,000 | $215 | 84 |
| 3600 Summit Blvd | 0.46mi | 3/2.0 (-1) | 1,530 (-2%) | 4mo | $335,000 | $219 | 66 |
| 3621 Bonner Rd | 0.64mi | 3/2.0 (-1) | 1,540 (-2%) | 3mo | $399,900 | $260 | 60 |
| 3755 Firestone Blvd | 0.55mi | 3/2.0 (-1) | 1,625 (+4%) | 5mo | $320,000 | $197 | 59 |
| 761 Connell Dr | 0.68mi | 3/2.5 (-1) | 1,585 (+1%) | 1mo | $385,000 | $243 | 58 |
| 3420 Summit Blvd | 0.36mi | 3/2.0 (-1) | 1,686 (+8%) | 11mo | $318,000 | $189 | 57 |
| 3540 Dunfries Rd | 0.53mi | 3/2.0 (-1) | 1,700 (+9%) | 3mo | $494,500 | $291 | 54 |
| 4020 Coppertree Ln | 0.74mi | 3/2.0 (-1) | 1,634 (+4%) | 5mo | $340,000 | $208 | 49 |
| 3251 Wythe Cir | 0.45mi | 3/2.0 (-1) | 1,376 (-12%) | 6mo | $235,000 | $171 | 49 |
| 3251 Braxton Cir | 0.49mi | 3/2.0 (-1) | 1,359 (-13%) | 3mo | $295,000 | $217 | 48 |
| 3545 Blueridge Dr | 0.65mi | 3/2.0 (-1) | 1,736 (+11%) | 6mo | $347,000 | $200 | 41 |
| 3640 Maule Rd | 0.67mi | 3/2.0 (-1) | 1,782 (+14%) | 8mo | $480,000 | $269 | 34 |
Match score weights: distance 35% · size 25% · config 20% · recency 20%. Top-matched comps best support the ARV.
Projected returns pro-forma
-3.0% appreciation · 3.39% rent growth · sell at horizon
- IRR
- -9.1%
- Equity multiple
- 0.67×
- Total profit
- $-27,998
- Equity at exit
- $44,731
- IRR
- 0.8%
- Equity multiple
- 1.06×
- Total profit
- $4,746
- Equity at exit
- $25,939
Cash invested: $84,000 (down + closing). Projections, not guarantees.
Landlord ↔ Tenant lean methodology
- Overall (STATE)
- 87 Strongly Landlord-Friendly
- State Florida
- 87 Strongly Landlord-Friendly · R+3
- County
- — inherits STATE
- City
- — inherits STATE
ZIP-level market 32503
- Rents YoY
- 3.4%
- Active inventory
- 240
- Price-to-rent
- 9.4×
Monthly cashflow live
- Estimated rent
- $2,646 medium interval (Pro) →
- Mortgage (P&I)
- −$1,573
- Tax from tax record
- −$82 /mo · $988/yr
- Insurance
- −$125
- HOA
- −$0
- Vacancy / Maint / Mgmt
- −$556
- Net cashflow
- $310
Break-even live
UW: 25.0% down · 7.5% · 30yr · 1.5% tax · 5.0% vac · 8.0% maint · 8.0% mgmt
Financing live
Cash to close
- Down payment
- $75,000
- Closing costs
- $9,000
- Reserves months
- —
- Total cash needed
- —
Loan-product check · same deal, 3 products live
Conventional
25% down · 7.5% · 30yr
- Down + closing
- —
- Monthly P&I
- —
- Monthly cashflow
- —
- DSCR
- —
- Eligible?
- —
Personal DTI + credit; lowest rate.
DSCR
20% down · 8.5% · 30yr
- Down + closing
- —
- Monthly P&I
- —
- Monthly cashflow
- —
- DSCR
- —
- Eligible?
- —
No personal income docs; deal must DSCR.
Hard money
10% down · 12.0% · 12mo
- Down + closing
- —
- Monthly P&I
- —
- Monthly cashflow
- —
- DSCR
- —
- Eligible?
- —
Short-term bridge; refi at stabilization.
Rent comps 4 comps
| Address | Beds | Baths | Sqft | Rent | $/sqft | DOM | Units | Dist |
|---|---|---|---|---|---|---|---|---|
| 3545 Hopestill Rd Pensacola, FL | 4.0 | 2.0 | 1984 | $2,400 | $1.21 | 23d | 1 | 0.51mi |
| 3547 Firestone Blvd Pensacola, FL | 4.0 | 2.0 | 2000 | $2,695 | $1.35 | 23d | 1 | 0.59mi |
| 3791 Maule Rd Pensacola, FL | 4.0 | 3.0 | 2000 | $3,250 | $1.62 | 23d | 1 | 0.65mi |
| 3014 Magnolia Ave Pensacola, FL | 3.0 | 2.0 | 1650 | $2,750 | $1.67 | 23d | 1 | 1.25mi |
Listing history 6 events
-
2026-06-10days on market $300,000 Active 7 DOM
-
2026-06-09days on market $300,000 Active 6 DOM
-
2026-06-08days on market $300,000 Active 5 DOM
-
2026-06-07days on market $300,000 Active 4 DOM
-
2026-06-03remarks 699-char remark
-
2026-06-03$300,000 Active 1 DOM
ⓘ Source: listings_history table (triggers on properties + properties_extension) + one-shot
backfill from property_details.listing_events for pre-trigger history.
Tax reassessment forecast FL · Resets to sale price
- Current annual tax
- $988 · $82/mo
- Projected year-2 tax
- $2,490 · $208/mo
- Expected delta
- +$1,502/yr (+$125/mo · 151.9%)
ⓘ Screening estimate from a state-policy table — verify with the county assessor before closing.
Climate risk First Street
- Flood 1/10 Low FEMA zone X (unshaded) · 0% chance over 30 yrs
- Wildfire 1/10 Low
- Heat 10/10 Extreme 7 d/yr ≥105°F today · 22 d/yr by 30 yrs out
- Wind 9/10 Extreme 99% chance of damaging wind over 30 yrs
- Air quality 1/10 Low 0 unhealthy d/yr today · 0 by 30 yrs out
Nearby sold comps map
Loading sold comps map…
Walkable amenities ~0.75 mi
Loading nearby amenities…
Taxation est. · year 1
- Rental income
- $31,749
- − Mortgage interest
- −$16,805
- − Property taxes
- −$988
- − Insurance
- −$1,500
- − Repairs & maintenance
- −$2,540
- − Management
- −$2,540
- − Depreciation
- −$8,727
- Taxable loss
- −$1,352
- Est. tax savings @ 24.0%
- +$324
- After-tax cash flow
- $4,039/yr
For passive investors: Depreciation is non-cash, so a rental often shows a tax loss while cash-flowing — sheltering income. Rental losses are passive: they offset passive income freely, and up to $25,000/yr can offset ordinary (W-2) income if you actively participate and your MAGI is under $100k (phasing out to $0 by $150k); unused losses carry forward. On sale, claimed depreciation is recaptured at up to 25%, and gains may owe capital-gains tax (a 1031 exchange can defer both). Figures are a year-1 estimate at your 24.0% rate — not tax advice; consult a CPA.
Schools (NCES district)
- District
- Escambia
- NCES district ID
- 1200510
- Math proficiency
- 40% ▼ -9.00%
- Reading proficiency
- 45% ▼ -4.00%
- Median HH income
- $44,649
- Composite
- 36.04/100
- National rank
- #4773
- State rank
- #56 of 73 in FL
Livability — Pensacola
- Score
- 83/100
- State rank
- #53
- US rank
- #924
Category grades
Schools grade is shown separately in the Schools card above.
Census & demographics
- Census place
- Pensacola, FL
- County
- Escambia County · 301,722 people
- City population
- 237,636
- Metro
- Pensacola-Ferry Pass-Brent, FL
- Population (ZIP)
- 33,559
- Household income
- $71,411
- Rent vs Own
- Severe rent burden
- 948.0
Population outlook (Escambia County) Hauer SSP2
- Today (2025)
- 334,637 people
- By 2030
- 345,779 · +3.3%
- By 2040
- 364,828 · +9.0%
- By 2050
- 378,514 · +13.1%
- By 2075
- 403,220 · +20.5%
- By 2100
- 386,125 · +15.4%
Race, ethnicity, and origin ACS 2023
- Neighborhood character
- Predominantly White (68%)
- Race & ethnicity
- White 68% Black 20% Two or more races 6% Hispanic / Latino 5% Asian 2%
- Common ancestry
- Lithuanian 3% Italian 2% Romanian 2%
- Foreign-born
- 5% · Canada, China
- Languages at home
- 93% English-only · Spanish 3% Arabic 1% Tagalog/Filipino 1%
Political lean MEDSL · Escambia
- 2024 margin
- R (+19.5) · D 39.7% · R 59.2% · Other 1.1%
- 2008→2024 swing
- -0.2pp no change · 2008: -19.3pp · 2024: -19.5pp
- All cycles
- 2024: R+19.5 2020: R+15.1 2016: R+20.6 2012: R+20.6 2008: R+19.3
Not yet ingested
- Civics
- —
Market trends
- HPI YoY
- ▼ -300.02%
- Current HPI
- 294.4873
- Rent YoY
- ▲ 3.39%
- Metro
- Pensacola-Ferry Pass-Brent, FL
- State GDP YoY
- ▲ 3.28%
- F500 in state
- 36
Industry mix (Fortune 500 HQ in FL)
| Industry | F500 HQs | Revenue |
|---|---|---|
| Industrial Technology | 2 | $29B |
|
||
| Insurance | 2 | $17B |
|
||
| Retail | 1 | $60B |
|
||
| Technology Distribution | 1 | $58B |
|
||
| Homebuilding | 1 | $35B |
|
||
| Technology Manufacturing | 1 | $35B |
|
||
Price history
+347.8% since first listed6 events — show timeline
- 2026-06-12 Listing Removed — PARMLS
- 2026-06-03 Listed $300,000 PARMLS
- 2000-08-16 Sold (Public Records) $64,000 Public Records
- 2000-08-09 Sold (MLS) $64,000 PARMLS
- 2000-07-10 Listed $69,900 PARMLS
- 1996-03-13 Sold (Public Records) $67,000 Public Records
Property tax history
+3.3%/yrLatest (2025): $988 · +7.7% YoY. Source: county tax records.
Cash-flow waterfall
monthlySold comps — $/sqft
last 12 mo · ≤1 miLoading sold comps…